303 W Greenwich Rd · Kearny, AZ
Flood risk 5/10 · Moderate
- FEMA flood zone
- X (unshaded)
- Chance of flooding over 30 yrs
- 0.65%
- Est. flood insurance / yr
- $507 – $1,088
Fire risk 5/10 · Moderate
- Est. fire insurance / yr
- $610 – $1,132
Heat risk 8/10 · Major
- Hot days now (above 109°F)
- 7 days/yr
- Hot days in 30 yrs
- 19 days/yr
Wind risk 1/10 · Minimal
- Chance of severe wind over 30 yrs
- —
Air-quality risk 1/10 · Minimal
- Unhealthy air days now
- 0 days/yr
- Unhealthy air days in 30 yrs
- 0 days/yr
Risk factors via First Street. Map © Google.
Why this score? — see what drove the C+ grade
The composite is a weighted blend of 9 inputs, each scored 0–100. Each bar is that input's sub-score; the figure is the points it added to the 100-point composite (weight × sub-score).
- Cash flow +26.0/30.0
- Appreciation +10.0/10.0
- DSCR +8.8/10.0
- 1% rule +5.8/10.0
- Livability +3.7/5.0
- Rent growth +2.5/5.0
- Schools +2.5/10.0
- Condition / age +2.5/5.0
- ARV discount +0.0/15.0
$149,000
🖨 Deal sheet (PDF) 📄 Offer letter ✓ Due diligence
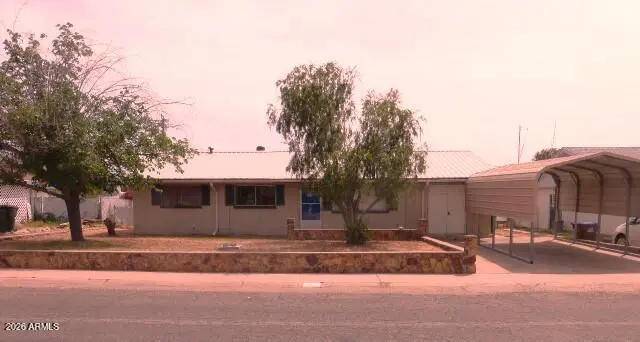
Listing remarks
Very nice block home located in the peaceful town of Kearny AZ. This home is ready for its new owners. Some updates include partial kitchen remodel. Metal roof installed recently. Upgraded 200 amp electrical service. Brand new AC/Gas Heat system with warranty to keep the house at the perfect temperature. New arcadian door leading out to the fully fenced back yard perfect for entertaining, relaxing, and fur babies to run. Large metal carport to keep your vehicles shaded. There is a Bonus room can be used as an extra bedroom, a media room, game room or anything you can imagine. This home is within walking distance to local churches, parks and shopping. Come check this one out, this is the hou
Key facts
- Metal roof
- Arcadian door
- Large metal carport
Tags
Property features AI
Finance
- Financial info: Annual property tax listed (see official records)
- HOA & community: No association fees
Exterior
- Parking: 2 open parking spaces; 1 covered space; 1 carport space
- Utilities: City water; Public sewer
- Home design: Single family residence; Fee simple ownership
- Construction: Painted block construction; Metal roof
- Exterior features: Chain link fencing; Natural desert front and back; Asphalt road access; Mountain views
Interior
- Kitchen: Eat-in kitchen; Refrigerator
- Bedrooms: 3 possible bedrooms
- Flooring: Concrete flooring
- Bathrooms: 1 full bathroom
- Heating & cooling: Central air conditioning; Natural gas heating
- Interior features: Eat-in kitchen; Refrigerator provided
- Laundry & utility: No laundry hookups specified
Neighborhood map
What this means for you Summary
Snapshot
- This is a 3-bed/1.0-bath single-family listed at $149k.
Deal economics
- At list price, monthly cash flow is $372 ($4k/yr) — positive.
- The deal already cash-flows at list — no discount required.
- Meets the 1% rule at list price ($2k rent vs $149k).
- Recommended offer: $147k (1.5% below list) — sets the bar for market timing.
Location & tenants
- Location reads 74/100 on livability (#20 in AZ, #4,875 nationally) — a middle-class / working-renter tenant base. Strengths: cost of living A+, housing A+, health & safety A+; Watch: employment C-, amenities F, commute F.
- Ray Unified District (4438) (rural): math 22% / reading 30% proficiency, ranked #318 of 501 in AZ (top 64%) — low school quality limits family demand, transient renter base, plan for 1-2y turnover.
- Zoned schools: Ray Elementary School (math 17% / reading 22%, grade F, #752 of 1,109 statewide, top 70%, 184 students, 55% FRL); Ray Jr/Sr High School (math 8% / reading 12%, grade F, #343 of 381 statewide, top 93%, 189 students, 48% FRL).
- Market conditions: 16 active listings in the ZIP; 9,504 units permitted in Pinal County in 2024 (776 in 5+ unit buildings).
Forward outlook
- In year one you build about $16k of equity ($1k loan paydown + $15k appreciation (10.0% local appreciation)).
- At projected returns (10.0% appreciation + 3.0% rent growth), your $42k cash investment doubles in ~2 years — after that, you're playing with house money.
- By year 3, paydown + projected appreciation supports a ~$40k cash-out refi (75% LTV) — recoverable capital for the next deal without selling this one.
Negotiation context
- It's been on market 26 days — a 2% lower offer ($147k) is reasonable based on typical stale-listing flexibility.
- 9 sale attempts since 25y ago with the ask held roughly flat each time — persistent listings suggest the price (not the market) is what's stuck; bring a comps-based counter.
- Current owner paid $60k; list at $149k implies a 148% gain — meaningful room to come down on a strong offer.
Risks & watch-outs
- Watch-outs: built in 1958 — expect roof / HVAC / electrical / plumbing capex.
- Climate carrying-cost: moderate flood risk; moderate wildfire risk; extreme-heat days projected 7→19/yr by 2055 (HVAC capex compounding) — expect insurance premiums to compound above CPI over the hold.
Questions for the listing agent
- Built in 1958 — when were the roof, HVAC, electrical panel, plumbing, and water heater last replaced?
- Is there a deadline driving the sale (1031 exchange, divorce, estate, relocation)? That informs how much negotiation room exists.
- Schools are F-rated, which usually means shorter tenancies and higher turnover. Who's the typical renter profile here, and what's been the actual vacancy rate?
- What's the average days-on-market for RENTAL listings here right now (not sales)? A rising rental-DOM trend means longer vacancies and softer asking-rent achievability than the comps imply.
- What's the recent tenant-quality profile in this submarket — average credit score on applications, eviction rate, late-payment / NSF rate, and stable-employment percentage? A property-management company in the area should have these aggregated.
- How much new for-sale + rental construction is in the pipeline within 1–3 miles? Heavy new supply typically softens prices + rents 12–24 months out; constrained supply supports both.
Investment metrics
- 1% rule
- 1.08% ✓
- Cap rate
- 9.29%
- Cash-on-cash
- 10.71%
- DSCR
- 1.48
- GRM
- 7.7
CMA / ARV
- ARV (on-the-fly)
- $101,764
- Comps found
- 8
Show comp detail 8 sales within ~0.75 mi
| Address | Dist | Beds/Ba | Sqft | Sold | Price | $/sf | Match |
|---|---|---|---|---|---|---|---|
| 326 W Greenwich Rd | 0.14mi | 3/1.0 | 989 (+0%) | 2mo | $86,000 | $87 | 91 |
| 313 W Essex Rd | 0.12mi | 3/1.0 | 1,014 (+3%) | 19mo | $162,000 | $160 | 74 |
| 187 W Jamestown Rd | 0.27mi | 3/2.0 | 1,040 (+5%) | 4mo | $190,000 | $183 | 72 |
| 402 W Greenwich Rd | 0.34mi | 3/1.0 | 961 (-3%) | 15mo | $85,000 | $88 | 67 |
| 413 W Jamestown Rd | 0.46mi | 3/1.0 | 900 (-9%) | 1mo | $81,500 | $91 | 63 |
| 610 S York Dr | 0.27mi | 3/2.0 | 1,112 (+13%) | 3mo | $115,000 | $103 | 60 |
| 334 W Essex Rd | 0.24mi | 3/2.0 | 1,121 (+14%) | 19mo | $97,000 | $87 | 47 |
| 333 W Essex Rd | 0.21mi | 3/2.0 | 1,120 (+13%) | 20mo | $169,000 | $151 | 47 |
Match score weights: distance 35% · size 25% · config 20% · recency 20%. Top-matched comps best support the ARV.
Projected returns pro-forma
10.0% appreciation · 3.0% rent growth · sell at horizon
- IRR
- 32.1%
- Equity multiple
- 3.51×
- Total profit
- $104,814
- Equity at exit
- $134,231
- IRR
- 27.7%
- Equity multiple
- 7.95×
- Total profit
- $289,901
- Equity at exit
- $289,474
Cash invested: $41,720 (down + closing). Projections, not guarantees.
Landlord ↔ Tenant lean methodology
- Overall (STATE)
- 87 Strongly Landlord-Friendly
- State Arizona
- 87 Strongly Landlord-Friendly · R+3
- County
- — inherits STATE
- City
- — inherits STATE
ZIP-level market 85137
- Home prices YoY
- 22.6%
- Active inventory
- 16
- Price-to-rent
- 7.7×
Monthly cashflow live
- Estimated rent
- $1,613 medium interval (Pro) →
- Mortgage (P&I)
- −$781
- Tax from tax record
- −$59 /mo · $704/yr
- Insurance
- −$62
- HOA
- −$0
- Vacancy / Maint / Mgmt
- −$339
- Net cashflow
- $372
Break-even live
Sensitivity live
| Price | -10% $457 | -5% $415 | +0% $372 | +5% $330 | +10% $288 |
|---|---|---|---|---|---|
| Rent | -10% $245 | -5% $309 | +0% $372 | +5% $436 | +10% $500 |
| Rate | -1.0pp $447 | -0.5pp $410 | base $372 | +0.5pp $334 | +1.0pp $295 |
UW: 25.0% down · 7.5% · 30yr · 1.5% tax · 5.0% vac · 8.0% maint · 8.0% mgmt
Financing live
Cash to close
- Down payment
- $37,250
- Closing costs
- $4,470
- Reserves months
- —
- Total cash needed
- —
Loan-product check · same deal, 3 products live
Conventional
25% down · 7.5% · 30yr
- Down + closing
- —
- Monthly P&I
- —
- Monthly cashflow
- —
- DSCR
- —
- Eligible?
- —
Personal DTI + credit; lowest rate.
DSCR
20% down · 8.5% · 30yr
- Down + closing
- —
- Monthly P&I
- —
- Monthly cashflow
- —
- DSCR
- —
- Eligible?
- —
No personal income docs; deal must DSCR.
Hard money
10% down · 12.0% · 12mo
- Down + closing
- —
- Monthly P&I
- —
- Monthly cashflow
- —
- DSCR
- —
- Eligible?
- —
Short-term bridge; refi at stabilization.
Listing history 42 events
-
2026-06-21days on market $149,000 Active 26 DOM
-
2026-06-18days on market $149,000 Active 23 DOM
-
2026-06-17days on market $149,000 Active 22 DOM
-
2026-06-16days on market $149,000 Active 21 DOM
-
2026-06-15days on market $149,000 Active 20 DOM
-
2026-06-13days on market $149,000 Active 18 DOM
-
2026-06-13days on market $149,000 Active 17 DOM
-
2026-06-09days on market $149,000 Active 14 DOM
-
2026-06-08days on market $149,000 Active 13 DOM
-
2026-06-07days on market $149,000 Active 12 DOM
-
2026-06-04days on market $149,000 Active 9 DOM
-
2026-06-03days on market $149,000 Active 8 DOM
-
2026-06-02days on market $149,000 Active 7 DOM
-
2026-06-01days on market $149,000 Active 6 DOM
-
2026-05-31days on market $149,000 Active 5 DOM
-
2026-05-26$149,000 Active
-
2026-05-01historical
-
2025-12-10$175,000 Active
-
2021-03-17soldstatus $60,000
-
2021-03-01historical
-
2021-02-18status Active
-
2021-02-11historical
-
2021-01-27price $79,900
-
2021-01-11price $89,900
-
2020-12-17price $99,900
-
2020-10-30$109,900 Active
-
2010-12-21soldstatus $40,000 Closed
-
2010-09-15$45,000 Active
-
2010-09-05historical
-
2010-07-31price $49,000
-
2010-07-02price $65,000
-
2010-06-05$68,000 Active
-
2008-05-22historical
-
2008-01-16$74,900
-
2006-11-28soldstatus $90,000
-
2006-11-28soldstatus $90,000
-
2006-10-18historical
-
2006-09-06$98,000
-
2003-01-03historical
-
2001-09-01$37,000
-
1999-04-19soldstatus $10,000
-
1998-04-24soldstatus $10,000
ⓘ Source: listings_history table (triggers on properties + properties_extension) + one-shot
backfill from property_details.listing_events for pre-trigger history.
Tax reassessment forecast AZ · Resets to sale price
- Current annual tax
- $704 · $59/mo
- Projected year-2 tax
- $983 · $82/mo
- Expected delta
- +$279/yr (+$23/mo · 39.7%)
ⓘ Screening estimate from a state-policy table — verify with the county assessor before closing.
Climate risk First Street
- Flood 5/10 Major FEMA zone X (unshaded) · 65% chance over 30 yrs
- Wildfire 5/10 Major
- Heat 8/10 Severe 7 d/yr ≥109°F today · 19 d/yr by 30 yrs out
- Wind 1/10 Low
- Air quality 1/10 Low 0 unhealthy d/yr today · 0 by 30 yrs out
Nearby sold comps map
Loading sold comps map…
Walkable amenities ~0.75 mi
Loading nearby amenities…
Taxation est. · year 1
- Rental income
- $19,360
- − Mortgage interest
- −$8,346
- − Property taxes
- −$704
- − Insurance
- −$745
- − Repairs & maintenance
- −$1,549
- − Management
- −$1,549
- − Depreciation
- −$4,335
- Taxable income
- $2,133
- Est. tax owed @ 24.0%
- −$512
- After-tax cash flow
- $3,957/yr
For passive investors: Depreciation is non-cash, so a rental often shows a tax loss while cash-flowing — sheltering income. Rental losses are passive: they offset passive income freely, and up to $25,000/yr can offset ordinary (W-2) income if you actively participate and your MAGI is under $100k (phasing out to $0 by $150k); unused losses carry forward. On sale, claimed depreciation is recaptured at up to 25%, and gains may owe capital-gains tax (a 1031 exchange can defer both). Figures are a year-1 estimate at your 24.0% rate — not tax advice; consult a CPA.
Schools (NCES district)
- District
- Ray Unified District (4438)
- NCES district ID
- 0406850
- Math proficiency
- 22% ▼ -5.00%
- Reading proficiency
- 30% ▼ -3.00%
- Median HH income
- $45,632
- Composite
- 25.45/100
- National rank
- #12864
- State rank
- #318 of 501 in AZ
Livability — Kearny
- Score
- 74/100
- State rank
- #20
- US rank
- #4875
Category grades
Schools grade is shown separately in the Schools card above.
Census & demographics
- Census place
- Kearny, AZ
- Population (ZIP)
- 2,533
Population outlook (Pinal County) Hauer SSP2
- Today (2025)
- 437,574 people
- By 2030
- 446,903 · +2.1%
- By 2040
- 452,589 · +3.4%
- By 2050
- 444,126 · +1.5%
- By 2075
- 430,300 · -1.7%
- By 2100
- 393,536 · -10.1%
Race, ethnicity, and origin ACS 2023
- Neighborhood character
- Majority White (61%)
- Race & ethnicity
- White 61% Hispanic / Latino 38% Two or more races 15% Native American 1%
- Hispanic origin (detail)
- Mexican 35%
- Common ancestry
- Slovak 7% Italian 1% Lithuanian 1%
- Foreign-born
- 4% · Canada
- Languages at home
- 83% English-only · Spanish 16% German/W. Germanic 1%
Political lean MEDSL · Pinal
- 2024 margin
- Strong R (+22.1) · D 38.5% · R 60.6%
- 2008→2024 swing
- -7.6pp toward R · 2008: -14.5pp · 2024: -22.1pp
- All cycles
- 2024: R+22.1 2020: R+17.3 2016: R+19.3 2012: R+17.1 2008: R+14.5
Not yet ingested
- Civics
- —
Market trends
- HPI YoY
- ▲ 22.16%
- Current HPI
- 120.15
- Rent YoY
- —
- Metro
- —
- State GDP YoY
- ▲ 4.54%
- F500 in state
- 20
Industry mix (Fortune 500 HQ in AZ)
| Industry | F500 HQs | Revenue |
|---|---|---|
| Technology | 2 | $13B |
|
||
| Mining / Metals | 1 | $23B |
|
||
| Environmental Services | 1 | $16B |
|
||
| Metals / Steel | 1 | $14B |
|
||
| Technology Distribution | 1 | $9B |
|
||
| Homebuilding | 1 | $8B |
|
||
Price history
+1390.0% since first listed27 events — show timeline
- 2026-05-26 Listed $149,000 ARMLS
- 2026-05-01 Listing Removed — MLSSAZ
- 2025-12-10 Listed $175,000 MLSSAZ
- 2021-03-17 Sold (Public Records) $60,000 Public Records
- 2021-03-01 Listing Removed — ARMLS
- 2021-02-18 Relisted — ARMLS
- 2021-02-11 Listing Removed — ARMLS
- 2021-01-27 Price Changed $79,900 ARMLS
- 2021-01-11 Price Changed $89,900 ARMLS
- 2020-12-17 Price Changed $99,900 ARMLS
- 2020-10-30 Listed $109,900 ARMLS
- 2010-12-21 Sold (MLS) $40,000 ARMLS
- 2010-09-15 Listed $45,000 ARMLS
- 2010-09-05 Listing Removed — ARMLS
- 2010-07-31 Price Changed $49,000 ARMLS
- 2010-07-02 Price Changed $65,000 ARMLS
- 2010-06-05 Listed $68,000 ARMLS
- 2008-05-22 Listing Removed — ARMLS
- 2008-01-16 Listed $74,900 ARMLS
- 2006-11-28 Sold (Public Records) $90,000 Public Records
- 2006-11-28 Sold (MLS) $90,000 ARMLS
- 2006-10-18 Listing Removed — ARMLS
- 2006-09-06 Listed $98,000 ARMLS
- 2003-01-03 Listing Removed — MLSSAZ
- 2001-09-01 Listed $37,000 MLSSAZ
- 1999-04-19 Sold (Public Records) $10,000 Public Records
- 1998-04-24 Sold (Public Records) $10,000 Public Records
Property tax history
+1.1%/yrLatest (2025): $704 · +7.6% YoY. Source: county tax records.
Cash-flow waterfall
monthlySold comps — $/sqft
last 12 mo · ≤1 miLoading sold comps…