6637 Grosse Point Ct · Citrus Heights, CA
Flood risk 1/10 · Minimal
- FEMA flood zone
- X (unshaded)
- Chance of flooding over 30 yrs
- 0.0%
- Est. flood insurance / yr
- $507 – $1,088
Fire risk 1/10 · Minimal
- Est. fire insurance / yr
- $659 – $1,223
Heat risk 7/10 · Major
- Hot days now (above 102°F)
- 7 days/yr
- Hot days in 30 yrs
- 16 days/yr
Wind risk 1/10 · Minimal
- Chance of severe wind over 30 yrs
- —
Air-quality risk 10/10 · Severe
- Unhealthy air days now
- 34 days/yr
- Unhealthy air days in 30 yrs
- 36 days/yr
Risk factors via First Street. Map © Google.
Why this score? — see what drove the B+ grade
The composite is a weighted blend of 9 inputs, each scored 0–100. Each bar is that input's sub-score; the figure is the points it added to the 100-point composite (weight × sub-score).
- Cash flow +30.0/30.0
- ARV discount +15.0/15.0
- 1% rule +10.0/10.0
- DSCR +10.0/10.0
- Schools +4.4/10.0
- Condition / age +3.8/5.0
- Rent growth +3.0/5.0
- Livability +3.0/5.0
- Appreciation +0.0/10.0
$119,000
🖨 Deal sheet 📄 Offer letter ✓ Due diligence
Listing remarks
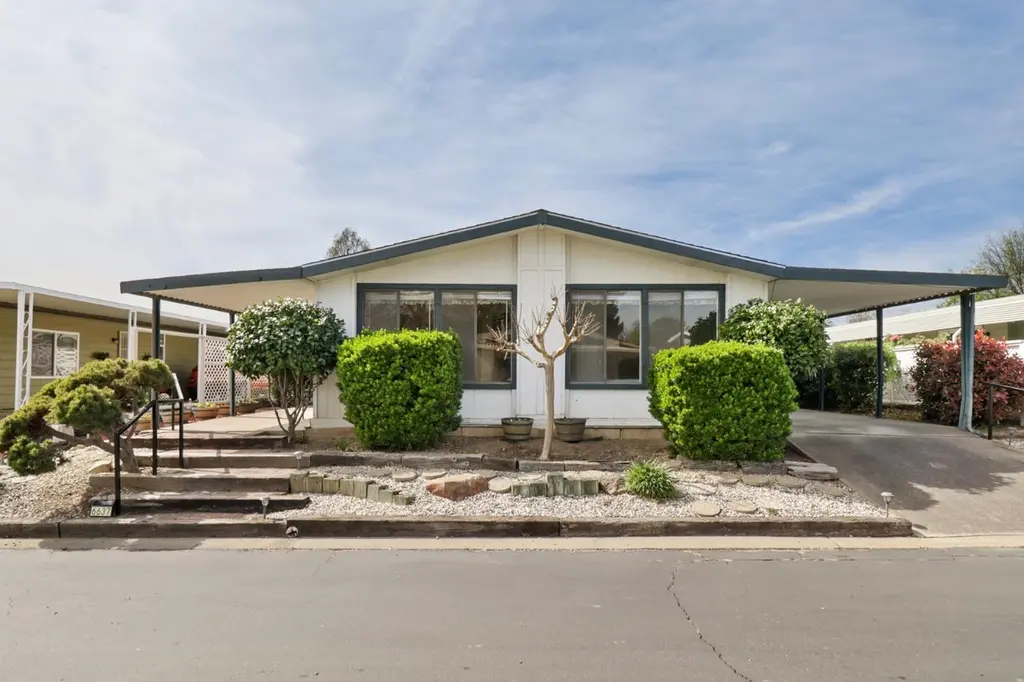
Welcome to 6637 Grosse Point Court, a well-maintained residence located within a desirable 55+ community in Citrus Heights, offering comfort, convenience, and easy living. This three-bedroom, two-bath home features a thoughtfully designed open floor plan that creates a natural flow between the kitchen, living room, and family room ideal for both everyday living and hosting guests. The interiors feel bright and inviting, with a layout that balances functionality and comfort. The kitchen is centrally positioned, allowing for effortless connection to the main living spaces, while the additional family room provides flexibility for relaxation, hobbies, or entertaining. Outdoors, the low-mainte
Key facts
- Open floor plan
- Low maintenance yard
- Covered carport
Tags
Neighborhood map
What this means for you Summary
Snapshot
- This is a 3-bed/2.0-bath manufactured listed at $119k. Condition is rated good.
Deal economics
- At list price, monthly cash flow is $1k ($14k/yr) — positive.
- The deal already cash-flows at list — no discount required.
- Meets the 1% rule at list price ($3k rent vs $119k).
- Recommended offer: $117k (1.5% below list) — sets the bar for market timing.
- Cap rate 18.0% vs local median 3.4% in Citrus Heights — top-decile yield for the area; either an underpriced asset or a hidden risk that comps aren't pricing in. Stress-test before assuming the spread holds.
Location & tenants
- Location reads 60/100 on livability (#614 in CA) — a middle-class / working-renter tenant base. Strengths: housing A+; Watch: schools D, crime D-, amenities F.
- San Juan Unified (suburban): math 40% / reading 62% proficiency, ranked #138 of 517 in CA (top 27%) — acceptable for families but not a draw, mixed tenant base, ~2y average lease.
- Market conditions: Rents rising (+1.9%/yr); 210 active listings in the ZIP; 24 comparable units currently listed for rent nearby; rentals at typical pace (median 24d on market — plan ~3-4 weeks tenant-placement turnaround); solid renter incomes; 6,825 units permitted in Sacramento County in 2024 (1,752 in 5+ unit buildings).
- This rent runs 37% of the median local income ($81k/yr) — at the standard rent-burdened threshold; future hikes will face affordability resistance.
Forward outlook
- Local home prices are declining (-3.0%/yr); year-one equity from $823 of loan paydown is wiped out by about $4k of value loss. Plan a longer hold.
- Sacramento County population projected at +17% by 2050 — long-run rental-demand tailwind backs the buy-and-hold thesis.
- At projected returns (-3.0% appreciation + 1.9% rent growth), your $33k cash investment doubles in ~3 years — after that, you're playing with house money.
Negotiation context
- It's been on market 18 days — a 2% lower offer ($117k) is reasonable based on typical stale-listing flexibility.
Risks & watch-outs
- Climate carrying-cost: extreme-heat days projected 7→16/yr by 2055 (HVAC capex compounding) — expect insurance premiums to compound above CPI over the hold.
Questions for the listing agent
- Is there a deadline driving the sale (1031 exchange, divorce, estate, relocation)? That informs how much negotiation room exists.
- Schools are D-rated, which usually means shorter tenancies and higher turnover. Who's the typical renter profile here, and what's been the actual vacancy rate?
- Crime grade is D in this area — have there been break-ins, vandalism, or insurance claims at this property in the last 3 years? What carrier currently insures it and at what premium?
- What's the average days-on-market for RENTAL listings here right now (not sales)? A rising rental-DOM trend means longer vacancies and softer asking-rent achievability than the comps imply.
- What's the recent tenant-quality profile in this submarket — average credit score on applications, eviction rate, late-payment / NSF rate, and stable-employment percentage? A property-management company in the area should have these aggregated.
- How much new for-sale + rental construction is in the pipeline within 1–3 miles? Heavy new supply typically softens prices + rents 12–24 months out; constrained supply supports both.
Investment metrics
- 1% rule
- 2.11% ✓
- Cap rate
- 17.98%
- Cash-on-cash
- 41.75%
- DSCR
- 2.86
- GRM
- 4.0
CMA / ARV
- ARV (on-the-fly)
- $159,744
- Comps found
- 12
Show comp detail 12 sales within ~0.75 mi
| Address | Dist | Beds/Ba | Sqft | Sold | Price | $/sf | Match |
|---|---|---|---|---|---|---|---|
| 6637 Grosse Point Ct | 0.00mi | 3/2.0 | 1,536 (0%) | 1mo | $95,000 | $62 | 100 |
| 6641 Grosse Point Ct | 0.01mi | 2/2.0 (-1) | 1,464 (-5%) | 3mo | $175,000 | $120 | 84 |
| 6845 Caywood Ct | 0.29mi | 2/2.0 (-1) | 1,536 (0%) | 2mo | $150,000 | $98 | 80 |
| 6116 Mame Ct | 0.06mi | 2/2.0 (-1) | 1,440 (-6%) | 3mo | $179,000 | $124 | 80 |
| 6105 Meiggs Ct #1015 | 0.04mi | 2/2.0 (-1) | 1,645 (+7%) | 4mo | $160,000 | $97 | 78 |
| 6206 Plymouth Rock Ln #110 | 0.61mi | 3/2.0 | 1,536 (0%) | 1mo | $159,000 | $104 | 70 |
| 6923 Daisy Ln | 0.35mi | 2/2.0 (-1) | 1,488 (-3%) | 7mo | $155,000 | $104 | 68 |
| 6113 Summerset Ln | 0.19mi | 2/2.0 (-1) | 1,344 (-12%) | 1mo | $169,000 | $126 | 64 |
| 6937 Grand Tree Ln | 0.45mi | 2/2.0 (-1) | 1,495 (-3%) | 6mo | $169,500 | $113 | 64 |
| 6912 Daisy Ln | 0.32mi | 2/2.0 (-1) | 1,707 (+11%) | 3mo | $239,500 | $140 | 59 |
| 6941 Radiance Cir | 0.36mi | 3/2.0 | 1,753 (+14%) | 7mo | $167,000 | $95 | 54 |
| 6203 Freedom Ln | 0.66mi | 3/2.0 | 1,680 (+9%) | 3mo | $160,000 | $95 | 51 |
Match score weights: distance 35% · size 25% · config 20% · recency 20%. Top-matched comps best support the ARV.
Projected returns pro-forma
-3.0% appreciation · 1.9% rent growth · sell at horizon
- IRR
- 37.1%
- Equity multiple
- 2.56×
- Total profit
- $51,837
- Equity at exit
- $17,743
- IRR
- 43.2%
- Equity multiple
- 4.88×
- Total profit
- $129,338
- Equity at exit
- $10,289
Cash invested: $33,320 (down + closing). Projections, not guarantees.
Landlord ↔ Tenant lean methodology
- Overall (STATE)
- 18 Strongly Tenant-Friendly
- State California
- 18 Strongly Tenant-Friendly · D+13
- County
- — inherits STATE
- City
- — inherits STATE
ZIP-level market 95621
- Rents YoY
- 1.9%
- Active inventory
- 210
- Price-to-rent
- 4.0×
Monthly cashflow live
- Estimated rent
- $2,508 high interval (Pro) →
- Mortgage (P&I)
- −$624
- Tax est. 1.5%
- −$149 /mo · $1,785/yr
- Insurance
- −$50
- HOA
- −$0
- Vacancy / Maint / Mgmt
- −$527
- Net cashflow
- $1,159
Break-even live
UW: 25.0% down · 7.5% · 30yr · 1.5% tax · 5.0% vac · 8.0% maint · 8.0% mgmt
Financing live
Cash to close
- Down payment
- $29,750
- Closing costs
- $3,570
- Reserves months
- —
- Total cash needed
- —
Loan-product check · same deal, 3 products live
Conventional
25% down · 7.5% · 30yr
- Down + closing
- —
- Monthly P&I
- —
- Monthly cashflow
- —
- DSCR
- —
- Eligible?
- —
Personal DTI + credit; lowest rate.
DSCR
20% down · 8.5% · 30yr
- Down + closing
- —
- Monthly P&I
- —
- Monthly cashflow
- —
- DSCR
- —
- Eligible?
- —
No personal income docs; deal must DSCR.
Hard money
10% down · 12.0% · 12mo
- Down + closing
- —
- Monthly P&I
- —
- Monthly cashflow
- —
- DSCR
- —
- Eligible?
- —
Short-term bridge; refi at stabilization.
Rent comps 24 comps
| Address | Beds | Baths | Sqft | Rent | $/sqft | DOM | Units | Dist |
|---|---|---|---|---|---|---|---|---|
| 6219 Oak Valley Ln Citrus Heights, CA | 3.0 | 2.5 | 1304 | $2,295 | $1.76 | 43d | 1 | 0.39mi |
| 6219 Oak Valley Ln Citrus Heights, CA | 3.0 | 3.0 | 1304 | $2,295 | $1.76 | 17d | 1 | 0.39mi |
| 6319 Misty Wood Way Citrus Heights, CA | 3.0 | 2.0 | 1454 | $2,500 | $1.72 | 43d | 1 | 0.49mi |
| 6203 Ackland Ct Citrus Heights, CA | 3.0 | 1.5 | 1322 | $2,500 | $1.89 | 23d | 1 | 0.61mi |
| 6948 Sunburst Way Citrus Heights, CA | 4.0 | 2.5 | 1673 | $3,000 | $1.79 | 43d | 1 | 0.68mi |
| 6940 Trailride Way Citrus Heights, CA | 3.0 | 2.0 | 1527 | $2,695 | $1.76 | 43d | 1 | 0.72mi |
| 6948 Trailride Way Citrus Heights, CA | 4.0 | 3.0 | 1980 | $2,850 | $1.44 | 17d | 1 | 0.73mi |
| 6805 Castillo Ct Citrus Heights, CA | 4.0 | 3.0 | 1948 | $2,795 | $1.43 | 23d | 1 | 0.86mi |
| 6687 Greenback Ln Citrus Heights, CA | 3.0 | 2.0 | 1323 | $2,495 | $1.89 | 17d | 1 | 0.87mi |
| 6104 Rockport Ln Citrus Heights, CA | 3.0 | 2.5 | 1150 | $2,295 | $2.00 | 21d | 1 | 0.88mi |
| 7120 Van Maren Ln Citrus Heights, CA | 3.0 | 2.0 | 1292 | $2,495 | $1.93 | 17d | 1 | 0.90mi |
| 6025 Dewey Dr Citrus Heights, CA | 3.0 | 2.0 | 1847 | $2,500 | $1.35 | 23d | 1 | 0.93mi |
| 6558 Meadowcreek Way Citrus Heights, CA | 3.0 | 2.0 | 1304 | $2,500 | $1.92 | 43d | 1 | 1.01mi |
| 6034 Centurion Cir Citrus Heights, CA | 4.0 | 2.0 | 1726 | $3,100 | $1.80 | 43d | 1 | 1.01mi |
| 7135 Cobalt Way Citrus Heights, CA | 3.0 | 1.0 | 1200 | $1,995 | $1.66 | 4d | 1 | 1.01mi |
| 6913 Gold Run Ave Sacramento, CA | 4.0 | 2.0 | 1474 | $2,800 | $1.90 | 20d | 1 | 1.12mi |
| 7024 San Altos Cir Citrus Heights, CA | 2.0 | 2.0 | 1120 | $2,800 | $2.50 | 43d | 1 | 1.16mi |
| 7139 Baranga Dr Citrus Heights, CA | 3.0 | 1.5 | 1162 | $2,500 | $2.15 | 2d | 1 | 1.17mi |
| 6333 Aslin Way Carmichael, CA | 4.0 | 2.0 | 1257 | $2,750 | $2.19 | 43d | 1 | 1.19mi |
| 6000 Coyle Ave Carmichael, CA | 4.0 | 2.0 | 1120 | $2,295 | $2.05 | 23d | 1 | 1.34mi |
| 5233 Calistoga Way Sacramento, CA | 3.0 | 2.0 | 1200 | $2,495 | $2.08 | 1d | 1 | 1.39mi |
| 7632 Van Maren Ln Unit 1 Citrus Heights, CA | 4.0 | 2.0 | 1300 | $2,495 | $1.92 | 14d | 1 | 1.40mi |
| 6600 Hillsdale Blvd Sacramento, CA | 3.0 | 3.0 | 1686 | $2,600 | $1.54 | 16d | 1 | 1.46mi |
| 7323 Chivalry Way Citrus Heights, CA | 2.0 | 2.0 | 1121 | $2,095 | $1.87 | 10d | 1 | 1.46mi |
Climate risk First Street
- Flood 1/10 Low FEMA zone X (unshaded) · 0% chance over 30 yrs
- Wildfire 1/10 Low
- Heat 7/10 Severe 7 d/yr ≥102°F today · 16 d/yr by 30 yrs out
- Wind 1/10 Low
- Air quality 10/10 Extreme 34 unhealthy d/yr today · 36 by 30 yrs out
Nearby sold comps map
Loading sold comps map…
Walkable amenities ~0.75 mi
Loading nearby amenities…
Taxation est. · year 1
- Rental income
- $30,100
- − Mortgage interest
- −$6,666
- − Property taxes
- −$1,785
- − Insurance
- −$595
- − Repairs & maintenance
- −$2,408
- − Management
- −$2,408
- − Depreciation
- −$3,462
- Taxable income
- $12,776
- Est. tax owed @ 24.0%
- −$3,066
- After-tax cash flow
- $10,844/yr
For passive investors: Depreciation is non-cash, so a rental often shows a tax loss while cash-flowing — sheltering income. Rental losses are passive: they offset passive income freely, and up to $25,000/yr can offset ordinary (W-2) income if you actively participate and your MAGI is under $100k (phasing out to $0 by $150k); unused losses carry forward. On sale, claimed depreciation is recaptured at up to 25%, and gains may owe capital-gains tax (a 1031 exchange can defer both). Figures are a year-1 estimate at your 24.0% rate — not tax advice; consult a CPA.
Condition & rehab AI · 1 photo
This well-maintained mobile home in a desirable community is ready for a fresh coat of paint and some landscaping to further enhance its curb appeal and value.
Value-add opportunities
- Both Painting the exterior — Enhances curb appeal and can increase both resale and rental value
- Both Landscaping improvements — Enhances curb appeal and can increase both resale and rental value
Renovation cost estimate screening
Value-add ROI direction
- Both Painting the exterior — Enhances curb appeal and can increase both resale and rental value ↑
- Both Landscaping improvements — Enhances curb appeal and can increase both resale and rental value ↑
ⓘ Cost ranges are severity-bucket heuristics (US national rule-of-thumb). Get contractor quotes + a written scope before underwriting a rehab budget.
Schools (NCES district)
- District
- San Juan Unified
- NCES district ID
- 0634620
- Math proficiency
- 40% ▲ 3.00%
- Reading proficiency
- 62% ▲ 16.00%
- Median HH income
- $55,655
- Composite
- 44.07/100
- National rank
- #2878
- State rank
- #138 of 517 in CA
Livability — Citrus Heights
- Score
- 60/100
- State rank
- #614
- US rank
- #19580
Category grades
Schools grade is shown separately in the Schools card above.
Census & demographics
- Census place
- Citrus Heights, CA
- County
- Sacramento County · 1,539,646 people
- City population
- 89,370
- Metro
- Sacramento-Roseville-Folsom, CA
- Population (ZIP)
- 42,442
- Household income
- $80,901
- Rent vs Own
- Severe rent burden
- 1854.0
Population outlook (Sacramento County) Hauer SSP2
- Today (2025)
- 1,660,763 people
- By 2030
- 1,732,990 · +4.3%
- By 2040
- 1,855,755 · +11.7%
- By 2050
- 1,941,335 · +16.9%
- By 2075
- 2,046,162 · +23.2%
- By 2100
- 1,961,444 · +18.1%
Race, ethnicity, and origin ACS 2023
- Neighborhood character
- Predominantly White (66%)
- Race & ethnicity
- White 66% Hispanic / Latino 19% Two or more races 11% Asian 6% Black 2%
- Hispanic origin (detail)
- Mexican 16%
- Common ancestry
- Subsaharan African 3% Lithuanian 3% Scotch-Irish 2%
- Foreign-born
- 15% · Canada, Vietnam
- Languages at home
- 78% English-only · Spanish 10% Russian/Polish/Slavic 6% Other Indo-European 3%
Political lean MEDSL · Sacramento
- 2024 margin
- D (+19.7) · D 58.1% · R 38.4% · Other 3.5%
- 2008→2024 swing
- +0.7pp no change · 2008: 19.0pp · 2024: 19.7pp
- All cycles
- 2024: D+19.7 2020: D+25.3 2016: D+23.7 2012: D+16.3 2008: D+19.0
Not yet ingested
- Civics
- —
Market trends
- HPI YoY
- ▼ -408.14%
- Current HPI
- 351.9333
- Rent YoY
- ▲ 1.90%
- Metro
- Sacramento-Roseville-Folsom, CA
- State GDP YoY
- ▲ 3.21%
- F500 in state
- 116
Industry mix (Fortune 500 HQ in CA)
| Industry | F500 HQs | Revenue |
|---|---|---|
| Technology | 27 | $1,492B |
|
||
| Financial Services | 3 | $174B |
|
||
| Retail | 3 | $44B |
|
||
| Insurance | 3 | $26B |
|
||
| Media / Entertainment | 2 | $115B |
|
||
| Pharmaceuticals / Biotech | 2 | $62B |
|
||
Cash-flow waterfall
monthlySold comps — $/sqft
last 12 mo · ≤1 miLoading sold comps…