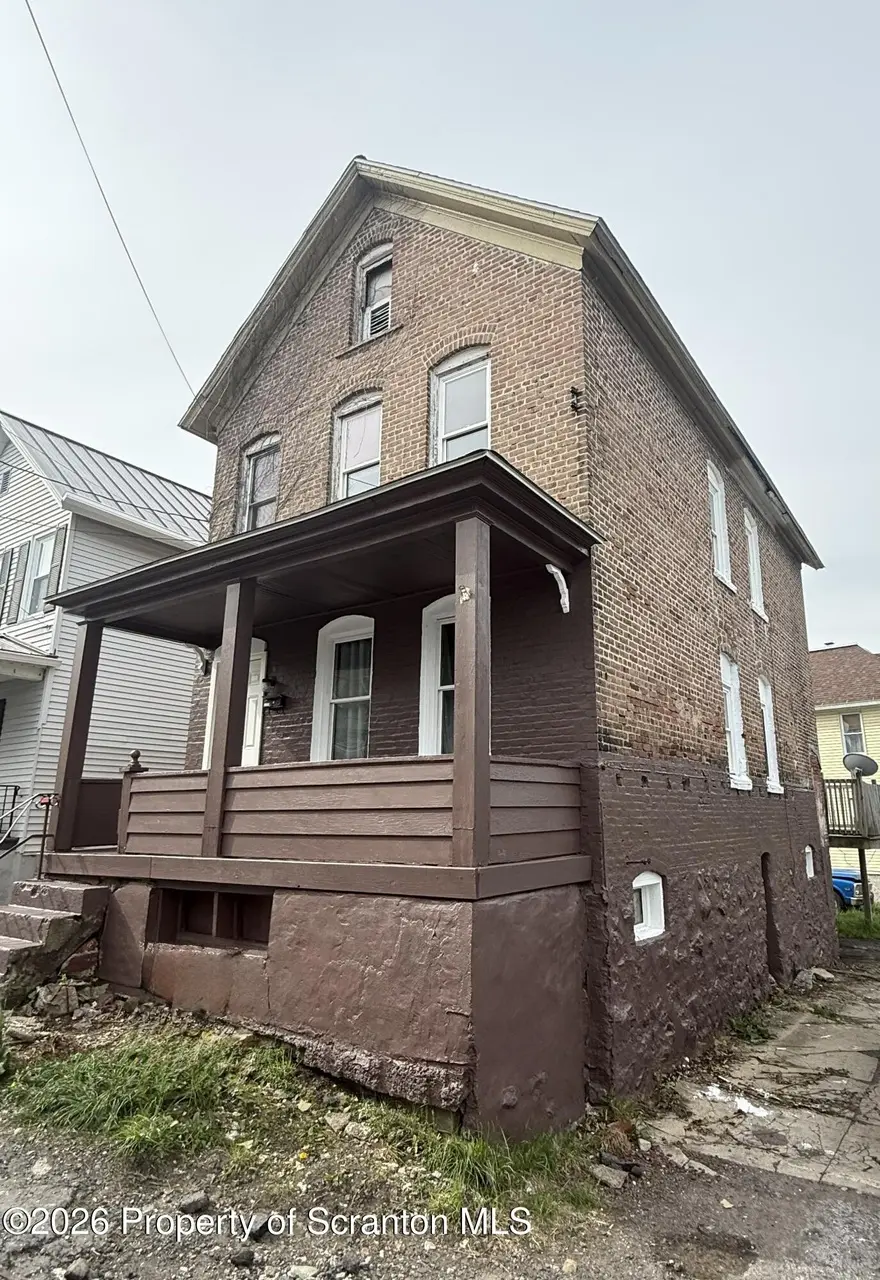
2 Ferguson Pl · Dunmore, PA
Flood risk 1/10 · Minimal
- FEMA flood zone
- X (unshaded)
- Chance of flooding over 30 yrs
- 0.0%
- Est. flood insurance / yr
- $473 – $860
Fire risk 1/10 · Minimal
- Est. fire insurance / yr
- $511 – $949
Heat risk 3/10 · Minor
- Hot days now (above 95°F)
- 7 days/yr
- Hot days in 30 yrs
- 15 days/yr
Wind risk 3/10 · Minor
- Chance of severe wind over 30 yrs
- 4.0%
Air-quality risk 2/10 · Minimal
- Unhealthy air days now
- 1 days/yr
- Unhealthy air days in 30 yrs
- 2 days/yr
Risk factors via First Street. Map © Google.
Why this score? — see what drove the B- grade
The composite is a weighted blend of 9 inputs, each scored 0–100. Each bar is that input's sub-score; the figure is the points it added to the 100-point composite (weight × sub-score).
- Cash flow +23.3/30.0
- ARV discount +15.0/15.0
- DSCR +7.5/10.0
- 1% rule +6.1/10.0
- Rent growth +4.3/5.0
- Livability +3.7/5.0
- Schools +3.6/10.0
- Condition / age +2.5/5.0
- Appreciation +0.0/10.0
$129,900
🖨 Deal sheet 📄 Offer letter ✓ Due diligence
Listing remarks MLS
Come see this brick home in the heart of Dunmore! Cleaned up and Freshly painted the front porch and brick around the house. Offering over 1,200 sq ft of living space, this 3-bedroom home is located in a quiet neighborhood with excellent schools. Enjoy a walk-out basement, rear parking, and a spacious deck ideal for gatherings or outdoor relaxation. A great opportunity to own in one of the area's most desirable communities. All information & measurements are not warranted or guaranteed
Key facts
- Rear parking
- Excellent schools
- Spacious deck
Tags
Neighborhood map
What this means for you Summary
Snapshot
- This is a 3-bed/1.0-bath single-family listed at $130k.
Deal economics
- At list price, monthly cash flow is $238 ($3k/yr) — positive.
- The deal already cash-flows at list — no discount required.
- Meets the 1% rule at list price ($1k rent vs $130k).
- Recommended offer: $118k (9.0% below list) — sets the bar for market timing.
- Cap rate 8.5% vs local median 4.4% in Dunmore — top-decile yield for the area; either an underpriced asset or a hidden risk that comps aren't pricing in. Stress-test before assuming the spread holds.
Location & tenants
- Location reads 73/100 on livability (#558 in PA) — a middle-class / working-renter tenant base. Strengths: cost of living A+, housing A+, crime B; Watch: amenities F, commute F, health & safety F.
- Dunmore SD (suburban): math 30% / reading 54% proficiency, ranked #324 of 539 in PA (top 60%) — families likely to look elsewhere, expect single-tenant / working-renter base with shorter leases.
- Market conditions: Rents rising fast (+7.1%/yr); 10 active listings in the ZIP; 17 comparable units currently listed for rent nearby; rentals at typical pace (median 21d on market — plan ~3-4 weeks tenant-placement turnaround); 251 units permitted in Lackawanna County in 2024 (0 in 5+ unit buildings).
- This rent runs 34% of the median local income ($51k/yr) — at the standard rent-burdened threshold; future hikes will face affordability resistance.
Forward outlook
- Local home prices are declining (-3.0%/yr); year-one equity from $898 of loan paydown is wiped out by about $4k of value loss. Plan a longer hold.
- Lackawanna County population projected to shrink 4% by 2050 — rents likely to lag national; underwrite the cash flow, not the appreciation.
- At projected returns (-3.0% appreciation + 7.1% rent growth), your $36k cash investment doubles in ~9 years — after that, you're playing with house money.
Negotiation context
- It's been on market 119 days — a 9% lower offer ($118k) is reasonable based on typical stale-listing flexibility.
- 2 sale attempts since 4y ago; this cycle's ask has dropped $10k (7%) from the opening price — seller is motivated, your offer sets the floor, not the list.
Risks & watch-outs
- Watch-outs: built in 1940 — expect roof / HVAC / electrical / plumbing capex.
Questions for the listing agent
- It's been on market 119 days. Have you received any prior offers? Is the seller open to a 9% concession, seller financing, or rate buy-down credit?
- Built in 1940 — when were the roof, HVAC, electrical panel, plumbing, and water heater last replaced?
- Why hasn't it sold? Are there any deal-killer items the seller is aware of (foundation, flood, title, zoning, code violations)?
- Is there a deadline driving the sale (1031 exchange, divorce, estate, relocation)? That informs how much negotiation room exists.
- Schools are B-rated — typically a magnet for longer-tenancy family renters. What's the average tenant stay here, and is there a school-zone premium baked into asking?
- What's the average days-on-market for RENTAL listings here right now (not sales)? A rising rental-DOM trend means longer vacancies and softer asking-rent achievability than the comps imply.
- What's the recent tenant-quality profile in this submarket — average credit score on applications, eviction rate, late-payment / NSF rate, and stable-employment percentage? A property-management company in the area should have these aggregated.
- How much new for-sale + rental construction is in the pipeline within 1–3 miles? Heavy new supply typically softens prices + rents 12–24 months out; constrained supply supports both.
Investment metrics
- 1% rule
- 1.11% ✓
- Cap rate
- 8.49%
- Cash-on-cash
- 7.85%
- DSCR
- 1.35
- GRM
- 7.5
CMA / ARV
- ARV (median comp)
- $182,296
- List price
- $129,900
- Delta
- -28.74%
- Verdict
- UNDERPRICED
- Comps
- 20 within 1.0 mi
Show comp detail 12 sales within ~0.75 mi
| Address | Dist | Beds/Ba | Sqft | Sold | Price | $/sf | Match |
|---|---|---|---|---|---|---|---|
| 1308 Adams Ave | 0.11mi | 2/1.5 (-1) | 1,251 (-4%) | 7mo | $188,500 | $151 | 76 |
| 1308 Monroe Ave | 0.28mi | 3/1.0 | 1,352 (+4%) | 18mo | $140,000 | $104 | 65 |
| 1611 Adams Ave | 0.38mi | 2/1.0 (-1) | 1,267 (-2%) | 20mo | $289,000 | $228 | 57 |
| 1506 Green Ridge St | 0.36mi | 3/1.0 | 1,200 (-7%) | 22mo | $225,000 | $188 | 53 |
| 1505 Clay Ave | 0.42mi | 3/1.0 | 1,426 (+10%) | 19mo | $170,000 | $119 | 48 |
| 110 E Grove | 0.54mi | 2/1.5 (-1) | 1,213 (-6%) | 11mo | $168,041 | $139 | 48 |
| 1109 N Irving Ave | 0.65mi | 3/1.5 | 1,200 (-7%) | 9mo | $60,000 | $50 | 48 |
| 1706 Electric St | 0.69mi | 3/1.5 | 1,350 (+4%) | 13mo | $215,000 | $159 | 48 |
| 1513 N Webster Ave | 0.49mi | 3/1.0 | 1,184 (-9%) | 20mo | $215,000 | $182 | 46 |
| 1534 Quincy Ave | 0.44mi | 3/2.0 | 1,488 (+15%) | 15mo | $242,000 | $163 | 38 |
| 114 E Pine St | 0.73mi | 2/1.0 (-1) | 1,202 (-7%) | 14mo | $177,000 | $147 | 37 |
| 2020 Rigg St Unit L 13 | 0.69mi | 3/1.5 | 1,464 (+13%) | 10mo | $275,000 | $188 | 36 |
Match score weights: distance 35% · size 25% · config 20% · recency 20%. Top-matched comps best support the ARV.
Projected returns pro-forma
-3.0% appreciation · 7.12% rent growth · sell at horizon
- IRR
- 0.2%
- Equity multiple
- 1.01×
- Total profit
- $325
- Equity at exit
- $19,369
- IRR
- 13.7%
- Equity multiple
- 2.31×
- Total profit
- $47,599
- Equity at exit
- $11,231
Cash invested: $36,372 (down + closing). Projections, not guarantees.
Landlord ↔ Tenant lean methodology
- Overall (STATE)
- 62 Landlord-Friendly
- State Pennsylvania
- 62 Landlord-Friendly · EVEN
- County
- — inherits STATE
- City
- — inherits STATE
ZIP-level market 18509
- Home prices YoY
- -33.5%
- Rents YoY
- 7.1%
- Active inventory
- 10
- Price-to-rent
- 7.5×
Monthly cashflow live
- Estimated rent
- $1,437 high interval (Pro) →
- Mortgage (P&I)
- −$681
- Tax est. 1.5%
- −$162 /mo · $1,948/yr
- Insurance
- −$54
- HOA
- −$0
- Vacancy / Maint / Mgmt
- −$302
- Net cashflow
- $238
Break-even live
UW: 25.0% down · 7.5% · 30yr · 1.5% tax · 5.0% vac · 8.0% maint · 8.0% mgmt
Financing live
Cash to close
- Down payment
- $32,475
- Closing costs
- $3,897
- Reserves months
- —
- Total cash needed
- —
Loan-product check · same deal, 3 products live
Conventional
25% down · 7.5% · 30yr
- Down + closing
- —
- Monthly P&I
- —
- Monthly cashflow
- —
- DSCR
- —
- Eligible?
- —
Personal DTI + credit; lowest rate.
DSCR
20% down · 8.5% · 30yr
- Down + closing
- —
- Monthly P&I
- —
- Monthly cashflow
- —
- DSCR
- —
- Eligible?
- —
No personal income docs; deal must DSCR.
Hard money
10% down · 12.0% · 12mo
- Down + closing
- —
- Monthly P&I
- —
- Monthly cashflow
- —
- DSCR
- —
- Eligible?
- —
Short-term bridge; refi at stabilization.
Rent comps 17 comps
| Address | Beds | Baths | Sqft | Rent | $/sqft | DOM | Units | Dist |
|---|---|---|---|---|---|---|---|---|
| 621 New York St Dunmore, PA | 4.0 | 1.0 | 1500 | $1,350 | $0.90 | 20d | 1 | 0.12mi |
| 1719 Madison Ave Scranton, PA | 3.0 | 1.0 | 1600 | $1,450 | $0.91 | 43d | 1 | 0.51mi |
| 1807 Green Ridge St Dunmore, PA | 2.0 | 1.0 | 1000 | $1,050 | $1.05 | 20d | 1 | 0.51mi |
| 1112 Ridge Ave #1114 Scranton, PA | 3.0 | 1.0 | 1000 | $1,350 | $1.35 | 43d | 1 | 0.79mi |
| 516 4th St Dunmore, PA | 3.0 | 1.0 | 1160 | $1,375 | $1.19 | 43d | 1 | 0.84mi |
| 945 Woodlawn St Scranton, PA | 3.0 | 1.0 | 1500 | $1,450 | $0.97 | 20d | 1 | 0.90mi |
| 200 Chestnut St Dunmore, PA | 3.0 | 1.0 | 1300 | $1,600 | $1.23 | 13d | 1 | 0.91mi |
| 1044 John Ave Scranton, PA | 3.0 | 1.0 | 976 | $1,500 | $1.54 | 20d | 1 | 1.00mi |
| 607 Mill St Apt 2 Dunmore, PA | 2.0 | 1.0 | 900 | $1,200 | $1.33 | 13d | 1 | 1.03mi |
| 122 Willow St Dunmore, PA | 2.0 | 1.0 | 900 | $1,150 | $1.28 | 43d | 1 | 1.06mi |
| 130 Willow St Dunmore, PA | 2.0 | 1.0 | 1050 | $1,050 | $1.00 | 13d | 1 | 1.08mi |
| 715 Mill St Dunmore, PA | 2.0 | 1.0 | 900 | $1,250 | $1.39 | 43d | 1 | 1.12mi |
| 717 Mill St Dunmore, PA | 3.0 | 1.0 | 975 | $1,200 | $1.23 | 43d | 1 | 1.12mi |
| 1116 Fairfield St Scranton, PA | 3.0 | 1.0 | 1100 | $1,700 | $1.55 | 20d | 1 | 1.16mi |
| 410 Boyle St Dunmore, PA | 2.0 | 1.0 | 1000 | $1,450 | $1.45 | 20d | 1 | 1.21mi |
| 800 James Ave Scranton, PA | 2.0 | 1.0–2.0 | 845 | $1,826 | $2.16 | 13d | 7 | 1.30mi |
| 140 Sand St Scranton, PA | 2.0 | 1.0 | 964 | $1,500 | $1.56 | 13d | 1 | 1.48mi |
Listing history 6 events
-
2026-04-28price $129,900 496-char remark
Show marketing remark (496 chars)
Come see this brick home in the heart of Dunmore! Cleaned up and Freshly painted the front porch and brick around the house. Offering over 1,200 sq ft of living space, this 3-bedroom home is located in a quiet neighborhood with excellent schools. Enjoy a walk-out basement, rear parking, and a spacious deck ideal for gatherings or outdoor relaxation. A great opportunity to own in one of the area's most desirable communities. All information & measurements are not warranted or guaranteed
-
2026-04-15price $130,000 496-char remark
Show marketing remark (496 chars)
Come see this brick home in the heart of Dunmore! Cleaned up and Freshly painted the front porch and brick around the house. Offering over 1,200 sq ft of living space, this 3-bedroom home is located in a quiet neighborhood with excellent schools. Enjoy a walk-out basement, rear parking, and a spacious deck ideal for gatherings or outdoor relaxation. A great opportunity to own in one of the area's most desirable communities. All information & measurements are not warranted or guaranteed
-
2026-02-20price $139,500 496-char remark
Show marketing remark (496 chars)
Come see this brick home in the heart of Dunmore! Cleaned up and Freshly painted the front porch and brick around the house. Offering over 1,200 sq ft of living space, this 3-bedroom home is located in a quiet neighborhood with excellent schools. Enjoy a walk-out basement, rear parking, and a spacious deck ideal for gatherings or outdoor relaxation. A great opportunity to own in one of the area's most desirable communities. All information & measurements are not warranted or guaranteed
-
2026-01-22$140,000 Active 496-char remark
Show marketing remark (496 chars)
Come see this brick home in the heart of Dunmore! Cleaned up and Freshly painted the front porch and brick around the house. Offering over 1,200 sq ft of living space, this 3-bedroom home is located in a quiet neighborhood with excellent schools. Enjoy a walk-out basement, rear parking, and a spacious deck ideal for gatherings or outdoor relaxation. A great opportunity to own in one of the area's most desirable communities. All information & measurements are not warranted or guaranteed
-
2023-01-03historical
-
2022-09-12$133,000 Active
ⓘ Source: listings_history table (triggers on properties + properties_extension) + one-shot
backfill from property_details.listing_events for pre-trigger history.
Climate risk First Street
- Flood 1/10 Low FEMA zone X (unshaded) · 0% chance over 30 yrs
- Wildfire 1/10 Low
- Heat 3/10 Moderate 7 d/yr ≥95°F today · 15 d/yr by 30 yrs out
- Wind 3/10 Moderate 4% chance of damaging wind over 30 yrs
- Air quality 2/10 Low 1 unhealthy d/yr today · 2 by 30 yrs out
Nearby sold comps map
Loading sold comps map…
Walkable amenities ~0.75 mi
Loading nearby amenities…
Taxation est. · year 1
- Rental income
- $17,249
- − Mortgage interest
- −$7,276
- − Property taxes
- −$1,948
- − Insurance
- −$650
- − Repairs & maintenance
- −$1,380
- − Management
- −$1,380
- − Depreciation
- −$3,779
- Taxable income
- $835
- Est. tax owed @ 24.0%
- −$201
- After-tax cash flow
- $2,653/yr
For passive investors: Depreciation is non-cash, so a rental often shows a tax loss while cash-flowing — sheltering income. Rental losses are passive: they offset passive income freely, and up to $25,000/yr can offset ordinary (W-2) income if you actively participate and your MAGI is under $100k (phasing out to $0 by $150k); unused losses carry forward. On sale, claimed depreciation is recaptured at up to 25%, and gains may owe capital-gains tax (a 1031 exchange can defer both). Figures are a year-1 estimate at your 24.0% rate — not tax advice; consult a CPA.
Schools (NCES district)
- District
- Dunmore SD
- NCES district ID
- 4207980
- Math proficiency
- 30% ▼ -16.00%
- Reading proficiency
- 54% ▼ -13.00%
- Median HH income
- $48,540
- Composite
- 35.92/100
- National rank
- #4806
- State rank
- #324 of 539 in PA
Livability — Dunmore
- Score
- 73/100
- State rank
- #558
- US rank
- #5204
Category grades
Schools grade is shown separately in the Schools card above.
Census & demographics
- Census place
- Dunmore, PA
- County
- Lackawanna County · 134,448 people
- City population
- 12,714
- Metro
- Scranton--Wilkes-Barre, PA
- Population (ZIP)
- 13,055
- Household income
- $51,062
- Rent vs Own
- Severe rent burden
- 715.0
Population outlook (Lackawanna County) Hauer SSP2
- Today (2025)
- 210,652 people
- By 2030
- 208,623 · -1.0%
- By 2040
- 203,980 · -3.2%
- By 2050
- 201,069 · -4.5%
- By 2075
- 205,026 · -2.7%
- By 2100
- 210,851 · +0.1%
Race, ethnicity, and origin ACS 2023
- Neighborhood character
- Predominantly White (77%)
- Race & ethnicity
- White 77% Hispanic / Latino 10% Black 8% Two or more races 5% Asian 1%
- Hispanic origin (detail)
- Mexican 2% Puerto Rican 4%
- Common ancestry
- Romanian 10% Scotch-Irish 2% Subsaharan African 1%
- Foreign-born
- 7% · Canada, China
- Languages at home
- 89% English-only · Spanish 7% Russian/Polish/Slavic 1% Chinese 1%
Political lean MEDSL · Lackawanna
- 2024 margin
- Toss-up / Even · D 51.0% · R 48.3%
- 2008→2024 swing
- -23.2pp toward R · 2008: 26.0pp · 2024: 2.8pp
- All cycles
- 2024: D+2.8 2020: D+8.4 2016: D+3.4 2012: D+27.4 2008: D+26.0
Not yet ingested
- Civics
- —
Market trends
- HPI YoY
- ▼ -106.59%
- Current HPI
- 211.5558
- Rent YoY
- ▲ 7.12%
- Metro
- Scranton--Wilkes-Barre, PA
- State GDP YoY
- ▲ 1.68%
- F500 in state
- 34
Industry mix (Fortune 500 HQ in PA)
| Industry | F500 HQs | Revenue |
|---|---|---|
| Healthcare | 2 | $309B |
|
||
| Insurance | 2 | $27B |
|
||
| Telecommunications / Media | 1 | $124B |
|
||
| Industrial Distribution | 1 | $22B |
|
||
| Financial Services | 1 | $20B |
|
||
| Chemicals / Materials | 1 | $18B |
|
||
Price history
-2.3% since first listed6 events — show timeline
- 2026-04-28 Price Changed $129,900 GSBR as distributed by MLS GRID
- 2026-04-15 Price Changed $130,000 GSBR as distributed by MLS GRID
- 2026-02-20 Price Changed $139,500 GSBR as distributed by MLS GRID
- 2026-01-22 Listed $140,000 GSBR as distributed by MLS GRID
- 2023-01-03 Delisted — GSBR as distributed by MLS GRID
- 2022-09-12 Listed $133,000 GSBR as distributed by MLS GRID
Property tax history
+41.3%/yrLatest (2026): $55,122 · +3227.1% YoY. Source: county tax records.
Cash-flow waterfall
monthlySold comps — $/sqft
last 12 mo · ≤1 miLoading sold comps…