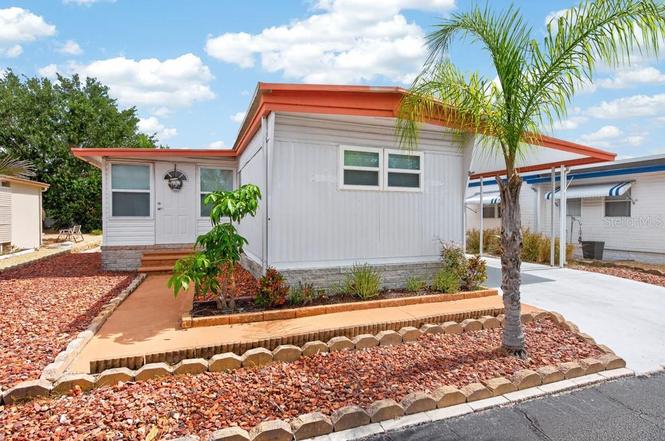
3527 Tiki Dr · Holiday, FL
Flood risk 3/10 · Minor
- FEMA flood zone
- X (unshaded)
- Chance of flooding over 30 yrs
- 0.1%
- Est. flood insurance / yr
- $507 – $1,088
Fire risk 3/10 · Minor
- Est. fire insurance / yr
- $947 – $1,759
Heat risk 10/10 · Severe
- Hot days now (above 109°F)
- 7 days/yr
- Hot days in 30 yrs
- 26 days/yr
Wind risk 10/10 · Severe
- Chance of severe wind over 30 yrs
- 99.0%
Air-quality risk 3/10 · Minor
- Unhealthy air days now
- 3 days/yr
- Unhealthy air days in 30 yrs
- 3 days/yr
Risk factors via First Street. Map © Google.
Why this score? — see what drove the C+ grade
The composite is a weighted blend of 9 inputs, each scored 0–100. Each bar is that input's sub-score; the figure is the points it added to the 100-point composite (weight × sub-score).
- Cash flow +30.0/30.0
- DSCR +10.0/10.0
- 1% rule +8.7/10.0
- Schools +4.3/10.0
- Livability +3.3/5.0
- Rent growth +3.0/5.0
- Condition / age +2.5/5.0
- ARV discount +0.0/15.0
- Appreciation +0.0/10.0
$105,000
🖨 Deal sheet (PDF) 📄 Offer letter ✓ Due diligence
Listing remarks
No lot rent here—you own the land! Nestled within a gated 55+ community with a low HOA fee of just $400 per year, this completely remodeled 2-bedroom, 2-bath home with a 13' x 9' versatile bonus room offers the perfect blend of comfort, style, and affordability. Extensively updated from top to bottom, the home features all-new PVC plumbing, updated electrical outlets, new flooring, fresh drywall, and interior paint throughout. The beautifully redesigned kitchen serves as the heart of the home, showcasing custom cabinetry with soft-close, dovetail drawers, granite countertops, a tiled backsplash, and a charming farmhouse sink. Both bathrooms have been thoughtfully renovated with modern
Key facts
- Gated community
- Custom cabinetry
- Farmhouse sink
Tags
Property features AI
Finance
- Other: Total acreage: less than 1/4 acre; Lot features: near golf course, near marina, near public transit, street dead-end; Paved road access
- Financial info: Lease restrictions apply
- HOA & community: Part of TIKI VILLAGE community; HOA required with annual fee ($400) — approximately $33.33/month; Community features include deed restrictions and street lights; Senior community; Pets allowed (maximum ~40 lbs)
Exterior
- Parking: Covered parking; 1-car carport
- Security: Gated community
- Utilities: Public water; Public sewer; Sewer connected
- Home design: Residential double-wide mobile home; Single-story; Faces southwest
- Construction: Metal frame construction; Metal roof
- Exterior features: Rain gutters; Storage shed
Interior
- Kitchen: Dishwasher; Microwave; Electric water heater
- Bedrooms: 2 bedrooms
- Flooring: Vinyl
- Bathrooms: 2 full bathrooms
- Heating & cooling: Central heating; Central air conditioning
- Interior features: Built-in features; Ceiling fans; Open floorplan with living/dining combo; Solid surface counters; Solid wood cabinets; Stone counters; Window treatments
- Laundry & utility: Laundry area (Other)
Neighborhood map
What this means for you Summary
Snapshot
- This is a 2-bed/2.0-bath manufactured listed at $105k.
Deal economics
- At list price, monthly cash flow is $485 ($6k/yr) — positive.
- The deal already cash-flows at list — no discount required.
- Meets the 1% rule at list price ($1k rent vs $105k).
- Cap rate 11.8% vs local median 4.5% in Holiday — top-decile yield for the area; either an underpriced asset or a hidden risk that comps aren't pricing in. Stress-test before assuming the spread holds.
Location & tenants
- Location reads 66/100 on livability (#623 in FL) — a middle-class / working-renter tenant base. Strengths: cost of living A+, housing A+, health & safety B; Watch: crime D+, amenities F, commute F.
- Pasco (suburban): math 50% / reading 52% proficiency, ranked #32 of 73 in FL (top 44%) — acceptable for families but not a draw, mixed tenant base, ~2y average lease.
- Zoned schools: Gulf Trace Elementary School (math 39% / reading 38%, grade F, #1,575 of 2,144 statewide, top 74%, 611 students, 84% FRL); Anclote High School (math 28% / reading 38%, grade F, #406 of 667 statewide, top 61%, 1,205 students, 77% FRL) — zoned schools average 81% FRL vs 48% district-wide (32 pts higher); higher-poverty schools than district average — tighter screening recommended.
- Zoned-school proficiency averages 36% at this address vs 51% district-wide (-15 pts) — the specific schools serving this property underperform the Pasco average; the district grade overstates school quality for this exact location.
- Market conditions: Rents rising (+2.0%/yr); 328 active listings in the ZIP; 9 comparable units currently listed for rent nearby; rentals at typical pace (median 16d on market — plan ~3-4 weeks tenant-placement turnaround); 6,765 units permitted in Pasco County in 2024 (1,250 in 5+ unit buildings).
- This rent runs 34% of the median local income ($50k/yr) — at the standard rent-burdened threshold; future hikes will face affordability resistance.
Forward outlook
- Local home prices are declining (-3.0%/yr); year-one equity from $726 of loan paydown is wiped out by about $3k of value loss. Plan a longer hold.
- Pasco County population projected at +29% by 2050 — long-run rental-demand tailwind backs the buy-and-hold thesis.
- At projected returns (-3.0% appreciation + 2.0% rent growth), your $29k cash investment doubles in ~7 years — after that, you're playing with house money.
Negotiation context
- Only 6 days on market — expect competitive offers; lowballing is unlikely to land.
- 3 sale attempts since 17y ago with the ask held roughly flat each time — persistent listings suggest the price (not the market) is what's stuck; bring a comps-based counter.
Risks & watch-outs
- Climate carrying-cost: severe wind risk, 99% chance of damaging wind over 30y; extreme-heat days projected 7→26/yr by 2055 (HVAC capex compounding) — expect insurance premiums to compound above CPI over the hold.
Questions for the listing agent
- Built in 1973 — when were the roof, HVAC, electrical panel, plumbing, and water heater last replaced?
- What does the HOA fee cover, when was the last increase, and are there any pending special assessments or reserve-fund shortfalls?
- Is there a deadline driving the sale (1031 exchange, divorce, estate, relocation)? That informs how much negotiation room exists.
- Schools are D-rated, which usually means shorter tenancies and higher turnover. Who's the typical renter profile here, and what's been the actual vacancy rate?
- Crime grade is D in this area — have there been break-ins, vandalism, or insurance claims at this property in the last 3 years? What carrier currently insures it and at what premium?
- What's the average days-on-market for RENTAL listings here right now (not sales)? A rising rental-DOM trend means longer vacancies and softer asking-rent achievability than the comps imply.
- What's the recent tenant-quality profile in this submarket — average credit score on applications, eviction rate, late-payment / NSF rate, and stable-employment percentage? A property-management company in the area should have these aggregated.
- How much new for-sale + rental construction is in the pipeline within 1–3 miles? Heavy new supply typically softens prices + rents 12–24 months out; constrained supply supports both.
Investment metrics
- 1% rule
- 1.37% ✓
- Cap rate
- 11.84%
- Cash-on-cash
- 19.81%
- DSCR
- 1.88
- GRM
- 6.1
CMA / ARV
- ARV (on-the-fly)
- $73,440
- Comps found
- 1
Show comp detail 1 sale within ~0.75 mi
| Address | Dist | Beds/Ba | Sqft | Sold | Price | $/sf | Match |
|---|---|---|---|---|---|---|---|
| 3707 Tiki Dr | 0.16mi | 2/1.0 | 784 (+9%) | 2mo | $80,000 | $102 | 72 |
Match score weights: distance 35% · size 25% · config 20% · recency 20%. Top-matched comps best support the ARV.
Projected returns pro-forma
-3.0% appreciation · 2.05% rent growth · sell at horizon
- IRR
- 10.9%
- Equity multiple
- 1.43×
- Total profit
- $12,518
- Equity at exit
- $15,656
- IRR
- 19.2%
- Equity multiple
- 2.54×
- Total profit
- $45,132
- Equity at exit
- $9,078
Cash invested: $29,400 (down + closing). Projections, not guarantees.
Landlord ↔ Tenant lean methodology
- Overall (STATE)
- 87 Strongly Landlord-Friendly
- State Florida
- 87 Strongly Landlord-Friendly · R+3
- County
- — inherits STATE
- City
- — inherits STATE
ZIP-level market 34691
- Home prices YoY
- -23.9%
- Rents YoY
- 2.0%
- Active inventory
- 328
- Price-to-rent
- 6.1×
Monthly cashflow live
- Estimated rent
- $1,438 high interval (Pro) →
- Mortgage (P&I)
- −$551
- Tax from tax record
- −$24 /mo · $283/yr
- Insurance
- −$44
- HOA
- −$33
- Vacancy / Maint / Mgmt
- −$302
- Net cashflow
- $485
Break-even live
Sensitivity live
| Price | -10% $545 | -5% $515 | +0% $485 | +5% $456 | +10% $426 |
|---|---|---|---|---|---|
| Rent | -10% $372 | -5% $429 | +0% $485 | +5% $542 | +10% $599 |
| Rate | -1.0pp $538 | -0.5pp $512 | base $485 | +0.5pp $458 | +1.0pp $431 |
UW: 25.0% down · 7.5% · 30yr · 1.5% tax · 5.0% vac · 8.0% maint · 8.0% mgmt
Financing live
Cash to close
- Down payment
- $26,250
- Closing costs
- $3,150
- Reserves months
- —
- Total cash needed
- —
Loan-product check · same deal, 3 products live
Conventional
25% down · 7.5% · 30yr
- Down + closing
- —
- Monthly P&I
- —
- Monthly cashflow
- —
- DSCR
- —
- Eligible?
- —
Personal DTI + credit; lowest rate.
DSCR
20% down · 8.5% · 30yr
- Down + closing
- —
- Monthly P&I
- —
- Monthly cashflow
- —
- DSCR
- —
- Eligible?
- —
No personal income docs; deal must DSCR.
Hard money
10% down · 12.0% · 12mo
- Down + closing
- —
- Monthly P&I
- —
- Monthly cashflow
- —
- DSCR
- —
- Eligible?
- —
Short-term bridge; refi at stabilization.
Rent comps 9 comps
| Address | Beds | Baths | Sqft | Rent | $/sqft | DOM | Units | Dist |
|---|---|---|---|---|---|---|---|---|
| 4205 Jordana Way Holiday, FL | 1.0–3.0 | 1.0–2.0 | 1027 | $1,404 | $1.37 | 3d | 13 | 0.71mi |
| 4348 Plaza Dr Holiday, FL | 1.0–2.0 | 1.0–2.0 | 860 | $1,499 | $1.74 | 0d | 7 | 0.77mi |
| 4318 Tahitian Gardens Cir Unit B Holiday, FL | 1.0 | 1.0 | 576 | $1,200 | $2.08 | 25d | 1 | 0.81mi |
| 2051 Pleasure Dr Holiday, FL | 2.0 | 1.0 | 720 | $1,200 | $1.67 | 25d | 1 | 0.82mi |
| 4358 Tahitian Gardens Cir Unit G Holiday, FL | 1.0 | 1.0 | 600 | $1,350 | $2.25 | 25d | 1 | 0.82mi |
| 4358 Tahitian Gardens Cir Holiday, FL | 1.0 | 1.0 | 600 | $1,350 | $2.25 | 15d | 1 | 0.82mi |
| 2133 Melody Dr Holiday, FL | 2.0 | 1.0 | 510 | $1,078 | $2.11 | 15d | 1 | 0.90mi |
| 2117 Calusa Trl Unit B Holiday, FL | 1.0 | 1.0 | 708 | $1,200 | $1.69 | 5d | 1 | 1.16mi |
| 2122 Ranchita Trl Holiday, FL | 2.0 | 1.0 | 648 | $1,399 | $2.16 | 25d | 1 | 1.21mi |
HOA detail
- Monthly dues
- $33 · $396/yr
- Likely covers
- electricsecurity
Listing history 5 events
-
2026-06-21days on market $105,000 Active 6 DOM
-
2026-06-18days on market $105,000 Active 3 DOM
-
2026-06-17days on market $105,000 Active 2 DOM
-
2026-06-16remarks 693-char remark
-
2026-06-16$105,000 Active 1 DOM
ⓘ Source: listings_history table (triggers on properties + properties_extension) + one-shot
backfill from property_details.listing_events for pre-trigger history.
Tax reassessment forecast FL · Resets to sale price
- Current annual tax
- $283 · $24/mo
- Projected year-2 tax
- $872 · $73/mo
- Expected delta
- +$589/yr (+$49/mo · 208.3%)
ⓘ Screening estimate from a state-policy table — verify with the county assessor before closing.
Climate risk First Street
- Flood 3/10 Moderate FEMA zone X (unshaded) · 10% chance over 30 yrs
- Wildfire 3/10 Moderate
- Heat 10/10 Extreme 7 d/yr ≥109°F today · 26 d/yr by 30 yrs out
- Wind 10/10 Extreme 99% chance of damaging wind over 30 yrs
- Air quality 3/10 Moderate 3 unhealthy d/yr today · 3 by 30 yrs out
Nearby sold comps map
Loading sold comps map…
Walkable amenities ~0.75 mi
Loading nearby amenities…
Taxation est. · year 1
- Rental income
- $17,262
- − Mortgage interest
- −$5,882
- − Property taxes
- −$283
- − Insurance
- −$525
- − Repairs & maintenance
- −$1,381
- − Management
- −$1,381
- − HOA
- −$396
- − Depreciation
- −$3,055
- Taxable income
- $4,360
- Est. tax owed @ 24.0%
- −$1,046
- After-tax cash flow
- $4,779/yr
For passive investors: Depreciation is non-cash, so a rental often shows a tax loss while cash-flowing — sheltering income. Rental losses are passive: they offset passive income freely, and up to $25,000/yr can offset ordinary (W-2) income if you actively participate and your MAGI is under $100k (phasing out to $0 by $150k); unused losses carry forward. On sale, claimed depreciation is recaptured at up to 25%, and gains may owe capital-gains tax (a 1031 exchange can defer both). Figures are a year-1 estimate at your 24.0% rate — not tax advice; consult a CPA.
Schools (NCES district)
- District
- Pasco
- NCES district ID
- 1201530
- Math proficiency
- 50% ▼ -10.00%
- Reading proficiency
- 52% ▼ -5.00%
- Median HH income
- $45,039
- Composite
- 43.14/100
- National rank
- #3074
- State rank
- #32 of 73 in FL
Livability — Holiday
- Score
- 66/100
- State rank
- #623
- US rank
- #12124
Category grades
Schools grade is shown separately in the Schools card above.
Census & demographics
- Census place
- Holiday, FL
- County
- Pasco County · 524,098 people
- City population
- 33,730
- Metro
- Tampa-St. Petersburg-Clearwater, FL
- Population (ZIP)
- 21,232
- Household income
- $50,288
- Rent vs Own
- Severe rent burden
- 1031.0
Population outlook (Pasco County) Hauer SSP2
- Today (2025)
- 570,045 people
- By 2030
- 605,844 · +6.3%
- By 2040
- 674,806 · +18.4%
- By 2050
- 736,022 · +29.1%
- By 2075
- 862,900 · +51.4%
- By 2100
- 906,364 · +59.0%
Race, ethnicity, and origin ACS 2023
- Neighborhood character
- Predominantly White (73%)
- Race & ethnicity
- White 73% Hispanic / Latino 15% Two or more races 11% Black 7% Asian 2%
- Hispanic origin (detail)
- Mexican 2% Puerto Rican 6% Cuban 2% Dominican 2%
- Common ancestry
- Romanian 3% Iranian 2% Lithuanian 2%
- Foreign-born
- 10% · Canada, Vietnam
- Languages at home
- 82% English-only · Spanish 8% Other Indo-European 5% Other Asian/Pacific 1%
Political lean MEDSL · Pasco
- 2024 margin
- Strong R (+25.2) · D 36.9% · R 62.1% · Other 1.0%
- 2008→2024 swing
- -21.6pp toward R · 2008: -3.6pp · 2024: -25.2pp
- All cycles
- 2024: R+25.2 2020: R+20.1 2016: R+21.6 2012: R+6.7 2008: R+3.6
Not yet ingested
- Civics
- —
Market trends
- HPI YoY
- ▼ -102.84%
- Current HPI
- 326.9843
- Rent YoY
- ▲ 2.05%
- Metro
- Tampa-St. Petersburg-Clearwater, FL
- State GDP YoY
- ▲ 3.28%
- F500 in state
- 36
Industry mix (Fortune 500 HQ in FL)
| Industry | F500 HQs | Revenue |
|---|---|---|
| Industrial Technology | 2 | $29B |
|
||
| Insurance | 2 | $17B |
|
||
| Retail | 1 | $60B |
|
||
| Technology Distribution | 1 | $58B |
|
||
| Homebuilding | 1 | $35B |
|
||
| Technology Manufacturing | 1 | $35B |
|
||
Price history
+337.5% since first listed7 events — show timeline
- 2026-06-15 Listed $105,000 Stellar MLS as Distributed by MLS Grid
- 2023-04-19 Sold (Public Records) $114,000 Public Records
- 2022-06-09 Sold (Public Records) $120,000 Public Records
- 2010-12-07 Listed $19,500 Stellar MLS as Distributed by MLS Grid
- 2010-08-19 Listing Removed — Stellar MLS as Distributed by MLS Grid
- 2009-12-22 Listed $49,900 Stellar MLS as Distributed by MLS Grid
- 1994-04-04 Sold (Public Records) $24,000 Public Records
Property tax history
-1.1%/yrLatest (2025): $283 · +7.8% YoY. Source: county tax records.
Cash-flow waterfall
monthlySold comps — $/sqft
last 12 mo · ≤1 miLoading sold comps…