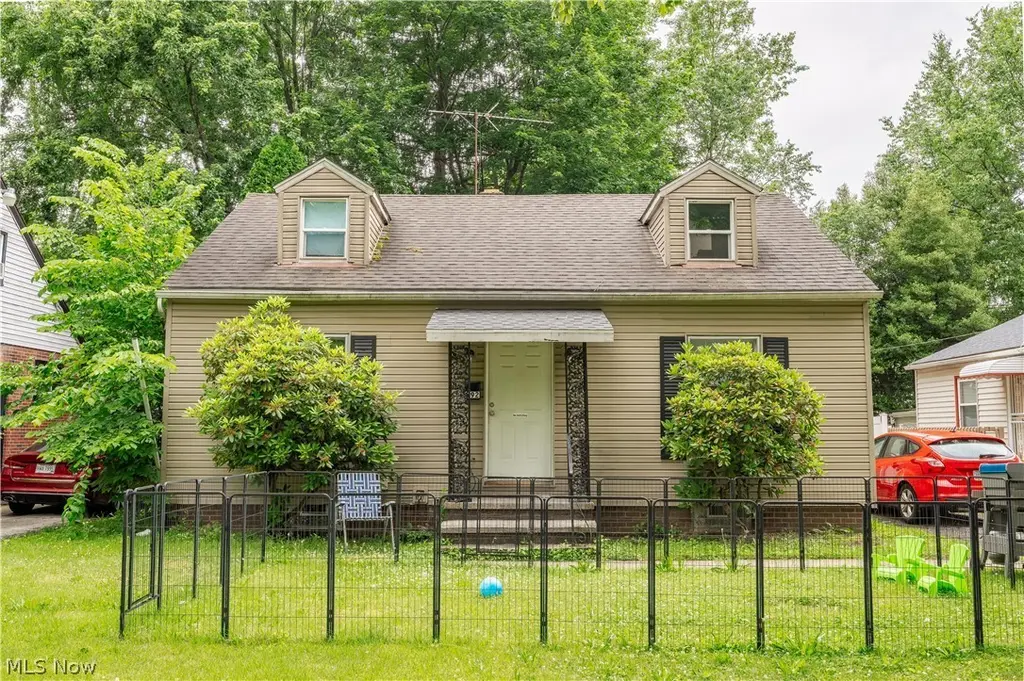
892 Hayden Ave · Akron, OH
Flood risk 1/10 · Minimal
- FEMA flood zone
- X (unshaded)
- Chance of flooding over 30 yrs
- 0.0%
- Est. flood insurance / yr
- $473 – $860
Fire risk 1/10 · Minimal
- Est. fire insurance / yr
- $713 – $1,323
Heat risk 3/10 · Minor
- Hot days now (above 97°F)
- 7 days/yr
- Hot days in 30 yrs
- 17 days/yr
Wind risk 1/10 · Minimal
- Chance of severe wind over 30 yrs
- —
Air-quality risk 2/10 · Minimal
- Unhealthy air days now
- 1 days/yr
- Unhealthy air days in 30 yrs
- 2 days/yr
Risk factors via First Street. Map © Google.
Why this score? — see what drove the D- grade
The composite is a weighted blend of 9 inputs, each scored 0–100. Each bar is that input's sub-score; the figure is the points it added to the 100-point composite (weight × sub-score).
- Cash flow +14.8/30.0
- DSCR +4.5/10.0
- 1% rule +4.1/10.0
- Livability +4.0/5.0
- ARV discount +3.3/15.0
- Rent growth +2.9/5.0
- Condition / age +2.5/5.0
- Schools +2.1/10.0
- Appreciation +0.0/10.0
$129,900
🖨 Deal sheet (PDF) 📄 Offer letter ✓ Due diligence
Listing remarks MLS
Opportunity is knocking for the wanna be home owner or flipper looking to make a fast buck. Cape cod design in established residential neighborhood. Close to all city conveniences and good freeway access. Needs some work and updating, neighborhood values should support cost of improvements.
Key facts
- 5,449 sq ft lot
- Garage
- Built 1949
Property features AI
Finance
- Financial info: $2,004 annual tax (2025)
Exterior
- Parking: Detached garage; Driveway; 1 garage space
- Utilities: Public water; Public sewer
- Home design: 2 stories; Vinyl siding
- Construction: Built (year per public records); Asphalt/fiberglass roof
- Exterior features: Lot dimensions approximately 50 x 109
Interior
- Kitchen: Range; Refrigerator
- Bedrooms: 2 main-level bedrooms
- Bathrooms: 1 full bathroom; 1 half bathroom; 1 main-level bathroom
- Heating & cooling: Forced air gas heating; Central air conditioning
- Interior features: Full, partially finished basement; 5 total rooms
- Laundry & utility: Laundry in basement; Humidifier
Neighborhood map
What this means for you Summary
Snapshot
- This is a 3-bed/1.5-bath single-family listed at $130k.
Deal economics
- At list price, monthly cash flow is $35 ($421/yr) — positive.
- The deal already cash-flows at list — no discount required.
- To meet the 1% rule (rent ≥ 1% of price), the offer needs to be $119k (8.7% below list).
- Recommended offer: $119k (8.7% below list) — sets the bar for 1% rule.
Location & tenants
- Location reads 81/100 on livability (#104 in OH, #1,591 nationally) — a professional / high-income tenant draw. Strengths: amenities A+, commute A+, cost of living A+; Watch: crime F, employment F.
- Akron City (urban): math 22% / reading 30% proficiency, ranked #602 of 656 in OH (top 92%) — low school quality limits family demand, transient renter base, plan for 1-2y turnover; 66% free/reduced lunch — lower-income household profile, screen leases tightly.
- Zoned schools: Schumacher Community Learning Center (math 17% / reading 17%, grade F, #1,337 of 1,584 statewide, top 86%, 337 students, 0% FRL); National Inventors Hall of Fame School Center For Stem (math 45% / reading 56%, grade C, #413 of 654 statewide, top 63%, 406 students, 0% FRL); Akron Early College High School (math 62% / reading 98%, grade A, #34 of 781 statewide, top 4%, 377 students, 0% FRL) — zoned schools average 0% FRL vs 66% district-wide (66 pts lower); this property's tenant base skews higher-income than the district average.
- Zoned-school proficiency averages 49% at this address vs 26% district-wide (+23 pts) — the actual schools serving this property are materially stronger than the Akron City average implies; a family-tenant draw the district grade alone would hide.
- Market conditions: Rents rising (+1.6%/yr); 106 active listings in the ZIP; 34 comparable units currently listed for rent nearby; rentals lingering (median 46d on market — plan ~5-8 weeks vacancy on turnover, expect pricing pressure); 50% of comp listings sitting > 30 days — soft ceiling on asking rent; lower-income renter base — watch delinquency; 1,114 units permitted in Summit County in 2024 (397 in 5+ unit buildings).
- This rent runs 35% of the median local income ($41k/yr) — at the standard rent-burdened threshold; future hikes will face affordability resistance.
Forward outlook
- Local home prices are declining (-3.0%/yr); year-one equity from $898 of loan paydown is wiped out by about $4k of value loss. Plan a longer hold.
- Summit County population projected to shrink 6% by 2050 — rents likely to lag national; underwrite the cash flow, not the appreciation.
Negotiation context
- Only 8 days on market — expect competitive offers; lowballing is unlikely to land.
- 2 sale attempts since 5y ago with the ask held roughly flat each time — persistent listings suggest the price (not the market) is what's stuck; bring a comps-based counter.
- Current owner paid $44k; list at $130k implies a 192% gain — meaningful room to come down on a strong offer.
Risks & watch-outs
- Watch-outs: built in 1949 — expect roof / HVAC / electrical / plumbing capex.
Questions for the listing agent
- Built in 1949 — when were the roof, HVAC, electrical panel, plumbing, and water heater last replaced?
- Is there a deadline driving the sale (1031 exchange, divorce, estate, relocation)? That informs how much negotiation room exists.
- Crime grade is F in this area — have there been break-ins, vandalism, or insurance claims at this property in the last 3 years? What carrier currently insures it and at what premium?
- The area grade is low — what's the realistic commute time and amenity access for the typical tenant pool here? Any planned neighborhood developments (good or bad) we should know about?
- What's the average days-on-market for RENTAL listings here right now (not sales)? A rising rental-DOM trend means longer vacancies and softer asking-rent achievability than the comps imply.
- What's the recent tenant-quality profile in this submarket — average credit score on applications, eviction rate, late-payment / NSF rate, and stable-employment percentage? A property-management company in the area should have these aggregated.
- How much new for-sale + rental construction is in the pipeline within 1–3 miles? Heavy new supply typically softens prices + rents 12–24 months out; constrained supply supports both.
Investment metrics
- 1% rule
- 0.91% ✗
- Cap rate
- 6.62%
- Cash-on-cash
- 1.16%
- DSCR
- 1.05
- GRM
- 9.1
CMA / ARV
- ARV (on-the-fly)
- $118,830
- Comps found
- 12
Show comp detail 12 sales within ~0.75 mi
| Address | Dist | Beds/Ba | Sqft | Sold | Price | $/sf | Match |
|---|---|---|---|---|---|---|---|
| 734 Frederick Blvd | 0.30mi | 3/1.0 | 1,092 (-6%) | 4mo | $170,000 | $156 | 71 |
| 763 Cordova Ave | 0.28mi | 3/1.0 | 1,236 (+6%) | 7mo | $128,000 | $104 | 69 |
| 808 S Hawkins Ave | 0.22mi | 2/1.0 (-1) | 1,223 (+5%) | 7mo | $117,875 | $96 | 69 |
| 1024 Roslyn Ave | 0.42mi | 3/1.5 | 1,100 (-6%) | 6mo | $152,000 | $138 | 66 |
| 782 Frederick Blvd | 0.22mi | 3/1.5 | 1,332 (+14%) | 2mo | $122,500 | $92 | 64 |
| 761 Glendora Ave | 0.60mi | 3/1.0 | 1,210 (+4%) | 3mo | $60,000 | $50 | 61 |
| 1682 Wakefield Dr | 0.38mi | 3/1.0 | 1,040 (-11%) | 2mo | $123,000 | $118 | 61 |
| 687 Crestview Ave | 0.48mi | 3/1.5 | 1,303 (+12%) | 3mo | $205,000 | $157 | 55 |
| 1037 Hardesty Blvd | 0.74mi | 3/1.0 | 1,109 (-5%) | 2mo | $98,000 | $88 | 54 |
| 1116 Frederick Blvd | 0.42mi | 3/1.0 | 1,008 (-14%) | 5mo | $103,000 | $102 | 52 |
| 1222 Seward Ave | 0.62mi | 3/1.0 | 1,040 (-11%) | 6mo | $68,000 | $65 | 46 |
| 1859 Delia Ave | 0.75mi | 3/1.0 | 1,040 (-11%) | 6mo | $65,000 | $63 | 40 |
Match score weights: distance 35% · size 25% · config 20% · recency 20%. Top-matched comps best support the ARV.
Projected returns pro-forma
-3.0% appreciation · 1.65% rent growth · sell at horizon
- IRR
- -16.0%
- Equity multiple
- 0.44×
- Total profit
- $-20,387
- Equity at exit
- $19,369
- IRR
- -10.1%
- Equity multiple
- 0.42×
- Total profit
- $-21,145
- Equity at exit
- $11,231
Cash invested: $36,372 (down + closing). Projections, not guarantees.
Landlord ↔ Tenant lean methodology
- Overall (STATE)
- 73 Landlord-Friendly
- State Ohio
- 73 Landlord-Friendly · R+6
- County
- — inherits STATE
- City
- — inherits STATE
ZIP-level market 44320
- Rents YoY
- 1.6%
- Active inventory
- 106
- Price-to-rent
- 9.1×
Monthly cashflow live
- Estimated rent
- $1,187 high interval (Pro) →
- Mortgage (P&I)
- −$681
- Tax from tax record
- −$167 /mo · $2,004/yr
- Insurance
- −$54
- HOA
- −$0
- Vacancy / Maint / Mgmt
- −$249
- Net cashflow
- $35
Break-even live
Sensitivity live
| Price | -10% $109 | -5% $72 | +0% $35 | +5% $-2 | +10% $-38 |
|---|---|---|---|---|---|
| Rent | -10% $-59 | -5% $-12 | +0% $35 | +5% $82 | +10% $129 |
| Rate | -1.0pp $100 | -0.5pp $68 | base $35 | +0.5pp $1 | +1.0pp $-33 |
UW: 25.0% down · 7.5% · 30yr · 1.5% tax · 5.0% vac · 8.0% maint · 8.0% mgmt
Financing live
Cash to close
- Down payment
- $32,475
- Closing costs
- $3,897
- Reserves months
- —
- Total cash needed
- —
Loan-product check · same deal, 3 products live
Conventional
25% down · 7.5% · 30yr
- Down + closing
- —
- Monthly P&I
- —
- Monthly cashflow
- —
- DSCR
- —
- Eligible?
- —
Personal DTI + credit; lowest rate.
DSCR
20% down · 8.5% · 30yr
- Down + closing
- —
- Monthly P&I
- —
- Monthly cashflow
- —
- DSCR
- —
- Eligible?
- —
No personal income docs; deal must DSCR.
Hard money
10% down · 12.0% · 12mo
- Down + closing
- —
- Monthly P&I
- —
- Monthly cashflow
- —
- DSCR
- —
- Eligible?
- —
Short-term bridge; refi at stabilization.
Rent comps 34 comps
| Address | Beds | Baths | Sqft | Rent | $/sqft | DOM | Units | Dist |
|---|---|---|---|---|---|---|---|---|
| 1047 Yukon Ave Akron, OH | 3.0 | 1.0 | 966 | $995 | $1.03 | 23d | 1 | 0.36mi |
| 1128 Cordova Ave Akron, OH | 2.0 | 1.0 | 840 | $795 | $0.95 | 16d | 1 | 0.46mi |
| 1161 Seward Ave Akron, OH | 3.0 | 1.5 | 1000 | $1,200 | $1.20 | 16d | 1 | 0.51mi |
| 1335 Thurston St Unit 1335 Akron, OH | 2.0 | 1.0 | 700 | $825 | $1.18 | 16d | 1 | 0.67mi |
| 1331 Thurston St Unit 1326 Akron, OH | 3.0 | 1.0 | 900 | $925 | $1.03 | 45d | 1 | 0.67mi |
| 1339 Thurston St Unit 1339 Akron, OH | 2.0 | 1.0 | 700 | $825 | $1.18 | 45d | 1 | 0.68mi |
| 601 Glendora Ave Akron, OH | 3.0 | 1.0 | 1310 | $1,200 | $0.92 | 45d | 1 | 0.69mi |
| 1090 Hartford Ave Akron, OH | 4.0 | 1.0 | 1328 | $1,125 | $0.85 | 45d | 1 | 0.69mi |
| 1326 Thurston St Unit 1326 Akron, OH | 3.0 | 1.0 | 900 | $925 | $1.03 | 25d | 1 | 0.71mi |
| 1328 Thurston St Unit 1328 Akron, OH | 3.0 | 1.0 | 900 | $925 | $1.03 | 25d | 1 | 0.71mi |
| 515 Nome Ave Akron, OH | 2.0 | 1.0 | 800 | $950 | $1.19 | 23d | 2 | 0.71mi |
| 1859 Delia Ave Akron, OH | 3.0 | 1.0 | 1040 | $1,395 | $1.34 | 23d | 1 | 0.74mi |
| 1310 Bellevue Ave Unit Right Akron, OH | 2.0 | 1.0 | 800 | $990 | $1.24 | 45d | 1 | 0.83mi |
| 637 Storer Ave Akron, OH | 3.0 | 1.5 | 1322 | $1,250 | $0.95 | 16d | 1 | 0.88mi |
| 405 Noah Ave Akron, OH | 2.0 | 1.0 | 1000 | $1,050 | $1.05 | 23d | 1 | 0.95mi |
| 961 Lawton St Akron, OH | 3.0 | 1.0 | 1144 | $1,450 | $1.27 | 16d | 1 | 0.98mi |
| 575 Noble Ave Akron, OH | 3.0 | 1.0 | 1300 | $1,350 | $1.04 | 16d | 1 | 1.03mi |
| 1092 Peerless Ave Akron, OH | 3.0 | 1.0 | 998 | $1,200 | $1.20 | 45d | 1 | 1.05mi |
| 1040 Mercer Ave Akron, OH | 3.0 | 1.0 | 850 | $1,400 | $1.65 | 23d | 1 | 1.05mi |
| 295 Noble Ave Akron, OH | 3.0 | 2.5 | 1488 | $1,600 | $1.08 | 45d | 1 | 1.06mi |
| 730 Noble Ave Akron, OH | 3.0 | 1.0 | 1092 | $1,200 | $1.10 | 25d | 1 | 1.10mi |
| 465 Grace Ave Akron, OH | 2.0 | 1.0 | 850 | $850 | $1.00 | 45d | 1 | 1.13mi |
| 321 Grace Ave Akron, OH | 3.0 | 2.0 | 1484 | $1,175 | $0.79 | 16d | 1 | 1.16mi |
| 1494 Diagonal Rd Akron, OH | 3.0 | 1.0 | 1064 | $1,495 | $1.41 | 45d | 1 | 1.19mi |
| 844 Lawton St Akron, OH | 4.0 | 2.0 | 1240 | $1,175 | $0.95 | 45d | 1 | 1.20mi |
| 915 Mull Ave Akron, OH | 2.0 | 1.0–2.0 | 662 | $1,110 | $1.68 | 14d | 1 | 1.22mi |
| 1142 Jefferson Ave Unit 2 Akron, OH | 3.0 | 1.0 | 1200 | $1,150 | $0.96 | 45d | 1 | 1.22mi |
| 916 Peckham St Akron, OH | 2.0 | 1.0 | 936 | $850 | $0.91 | 45d | 1 | 1.23mi |
| 924 Hamlin St Akron, OH | 3.0 | 1.0 | 1106 | $1,300 | $1.18 | 45d | 1 | 1.23mi |
| 918 Bye St Akron, OH | 3.0 | 1.0 | 1248 | $1,200 | $0.96 | 45d | 1 | 1.25mi |
| 783 Leonard St Akron, OH | 3.0 | 1.0 | 1040 | $1,250 | $1.20 | 45d | 1 | 1.41mi |
| 1069 Fess Ave Akron, OH | 2.0 | 1.0 | 940 | $1,095 | $1.16 | 45d | 1 | 1.41mi |
| 991 Diana Ave Akron, OH | 3.0 | 2.0 | 1264 | $1,325 | $1.05 | 45d | 1 | 1.44mi |
| 677 Crossings Ln Akron, OH | 3.0 | 2.5 | 1440 | $1,950 | $1.35 | 25d | 1 | 1.47mi |
Listing history 7 events
-
2026-06-21days on market $129,900 Active 8 DOM
-
2026-06-18days on market $129,900 Active 5 DOM
-
2026-06-17days on market $129,900 Active 4 DOM
-
2026-06-16days on market $129,900 Active 3 DOM
-
2026-06-15days on market $129,900 Active 2 DOM
-
2026-06-14remarks 687-char remark
-
2026-06-14$129,900 Active 1 DOM
ⓘ Source: listings_history table (triggers on properties + properties_extension) + one-shot
backfill from property_details.listing_events for pre-trigger history.
Tax reassessment forecast OH · Partial reset (capped growth)
- Current annual tax
- $2,004 · $167/mo
- Projected year-2 tax
- $2,015 · $168/mo
- Expected delta
- +$11/yr (+$1/mo · 0.6%)
ⓘ Screening estimate from a state-policy table — verify with the county assessor before closing.
Climate risk First Street
- Flood 1/10 Low FEMA zone X (unshaded) · 0% chance over 30 yrs
- Wildfire 1/10 Low
- Heat 3/10 Moderate 7 d/yr ≥97°F today · 17 d/yr by 30 yrs out
- Wind 1/10 Low
- Air quality 2/10 Low 1 unhealthy d/yr today · 2 by 30 yrs out
Nearby sold comps map
Loading sold comps map…
Walkable amenities ~0.75 mi
Loading nearby amenities…
Taxation est. · year 1
- Rental income
- $14,239
- − Mortgage interest
- −$7,276
- − Property taxes
- −$2,004
- − Insurance
- −$650
- − Repairs & maintenance
- −$1,139
- − Management
- −$1,139
- − Depreciation
- −$3,779
- Taxable loss
- −$1,748
- Est. tax savings @ 24.0%
- +$420
- After-tax cash flow
- $840/yr
For passive investors: Depreciation is non-cash, so a rental often shows a tax loss while cash-flowing — sheltering income. Rental losses are passive: they offset passive income freely, and up to $25,000/yr can offset ordinary (W-2) income if you actively participate and your MAGI is under $100k (phasing out to $0 by $150k); unused losses carry forward. On sale, claimed depreciation is recaptured at up to 25%, and gains may owe capital-gains tax (a 1031 exchange can defer both). Figures are a year-1 estimate at your 24.0% rate — not tax advice; consult a CPA.
Schools (NCES district)
- District
- Akron City
- NCES district ID
- 3904348
- Math proficiency
- 22% ▼ -17.00%
- Reading proficiency
- 30% ▼ -12.00%
- Median HH income
- $33,811
- Composite
- 21.31/100
- National rank
- #8383
- State rank
- #602 of 656 in OH
Livability — Akron
- Score
- 81/100
- State rank
- #104
- US rank
- #1591
Category grades
Schools grade is shown separately in the Schools card above.
Census & demographics
- Census place
- Akron, OH
- County
- Summit County · 440,783 people
- City population
- 174,375
- Metro
- Akron, OH
- Population (ZIP)
- 17,690
- Household income
- $41,241
- Rent vs Own
- Severe rent burden
- 1316.0
Population outlook (Summit County) Hauer SSP2
- Today (2025)
- 546,583 people
- By 2030
- 544,028 · -0.5%
- By 2040
- 531,363 · -2.8%
- By 2050
- 514,923 · -5.8%
- By 2075
- 481,765 · -11.9%
- By 2100
- 432,265 · -20.9%
Race, ethnicity, and origin ACS 2023
- Neighborhood character
- Majority Black (63%)
- Race & ethnicity
- Black 63% White 27% Two or more races 7% Hispanic / Latino 4%
- Common ancestry
- Romanian 2% Italian 1% Scotch-Irish 1%
- Foreign-born
- 2% · Canada
- Languages at home
- 97% English-only · Spanish 1% Other Indo-European 1%
Political lean MEDSL · Summit
- 2024 margin
- Lean D (+7.0) · D 53.0% · R 46.0%
- 2008→2024 swing
- -9.6pp toward R · 2008: 16.6pp · 2024: 7.0pp
- All cycles
- 2024: D+7.0 2020: D+9.6 2016: D+8.2 2012: D+14.8 2008: D+16.6
Not yet ingested
- Civics
- —
Market trends
- HPI YoY
- ▼ -117.69%
- Current HPI
- 122.9888
- Rent YoY
- ▲ 1.65%
- Metro
- Akron, OH
- State GDP YoY
- ▲ 1.98%
- F500 in state
- 48
Industry mix (Fortune 500 HQ in OH)
| Industry | F500 HQs | Revenue |
|---|---|---|
| Insurance | 3 | $145B |
|
||
| Industrial Machinery | 3 | $49B |
|
||
| Financial Services | 3 | $24B |
|
||
| Consumer Goods | 2 | $93B |
|
||
| Aerospace / Defense | 2 | $47B |
|
||
| Utilities | 2 | $33B |
|
||
Price history
+411.4% since first listed7 events — show timeline
- 2026-06-13 Listed $129,900 MLSNOW
- 2021-09-07 Sold (MLS) $44,500 MLSNOW
- 2021-08-24 Pending — MLSNOW
- 2021-08-21 Contingent — MLSNOW
- 2021-08-02 Listed $42,000 MLSNOW
- 2002-11-04 Sold (Public Records) $50,000 Public Records
- 1994-11-17 Sold (Public Records) $25,400 Public Records
Property tax history
+22.6%/yrLatest (2025): $2,004 · -6.2% YoY. Source: county tax records.
Cash-flow waterfall
monthlySold comps — $/sqft
last 12 mo · ≤1 miLoading sold comps…