 6-Plex
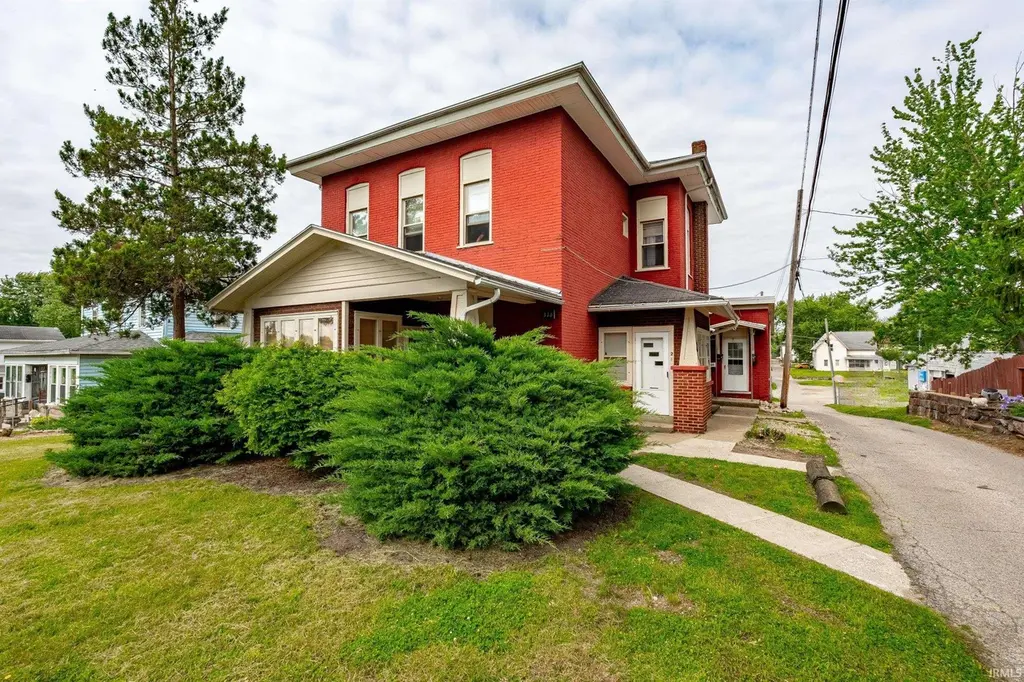
316 S Washington St · Warsaw, IN
Flood risk 1/10 · Minimal
- FEMA flood zone
- X (unshaded)
- Chance of flooding over 30 yrs
- 0.0%
- Est. flood insurance / yr
- $473 – $860
Fire risk 1/10 · Minimal
- Est. fire insurance / yr
- $717 – $1,331
Heat risk 3/10 · Minor
- Hot days now (above 99°F)
- 7 days/yr
- Hot days in 30 yrs
- 16 days/yr
Wind risk 2/10 · Minimal
- Chance of severe wind over 30 yrs
- —
Air-quality risk 3/10 · Minor
- Unhealthy air days now
- 1 days/yr
- Unhealthy air days in 30 yrs
- 3 days/yr
Risk factors via First Street. Map © Google.
Why this score? — see what drove the B- grade
The composite is a weighted blend of 9 inputs, each scored 0–100. Each bar is that input's sub-score; the figure is the points it added to the 100-point composite (weight × sub-score).
- Cash flow +30.0/30.0
- DSCR +10.0/10.0
- 1% rule +8.6/10.0
- ARV discount +7.5/15.0
- Schools +4.1/10.0
- Livability +3.9/5.0
- Rent growth +2.5/5.0
- Condition / age +2.5/5.0
- Appreciation +0.0/10.0
$360,000
🖨 Deal sheet 📄 Offer letter ✓ Due diligence
Multi-family units
County records classify this as Multi-Family (2-4 Unit). Listing-text estimate: 6 units. estimate disagrees with records
Listing remarks MLS
For questions please contact the listing agent.
Key facts
- Recent updates
- Updated paint
- Lvp flooring
Tags
Property features AI
Finance
- Other: Pets allowed with breed restrictions
- Financial info: Annual tax amount listed (not included in feature summary)
Exterior
- Parking: Six open parking spaces
- Utilities: Public water; Public sewer
- Home design: Residential income property (multi-family sixplex); Two stories
- Construction: Brick construction
- Exterior features: Corner lot; Lot dimensions approximately 66 x 132
Interior
- Kitchen: Range; Refrigerator
- Flooring: Carpet; Vinyl
- Bathrooms: Six full bathrooms (all on the main level)
- Heating & cooling: Central air conditioning; Forced air heating (natural gas)
- Interior features: Eat-in kitchen; Has basement (partial, crawl space)
Neighborhood map
What this means for you Summary
Snapshot
- This is a 6 × 1-bed/1-bath units multifamily listed at $360k.
Deal economics
- At list price, monthly cash flow is $1k ($17k/yr) — positive. Per door: $240/mo.
- The deal already cash-flows at list — no discount required.
- Meets the 1% rule at list price ($5k rent vs $360k).
- Recommended offer: $355k (1.5% below list) — sets the bar for market timing.
- Cap rate 11.1% vs local median 3.2% in Warsaw — top-decile yield for the area; either an underpriced asset or a hidden risk that comps aren't pricing in. Stress-test before assuming the spread holds.
Location & tenants
- Location reads 77/100 on livability (#42 in IN, #3,114 nationally) — a middle-class / working-renter tenant base. Strengths: cost of living A+, housing A+, health & safety A; Watch: employment C-, crime D+, amenities F.
- Warsaw Community Schools (town): math 45% / reading 49% proficiency, ranked #78 of 301 in IN (top 26%) — families likely to look elsewhere, expect single-tenant / working-renter base with shorter leases.
- Zoned schools: Washington Elementary School (math 47% / reading 45%, grade D-, #357 of 994 statewide, top 37%, 504 students, 48% FRL); Edgewood Middle School (math 41% / reading 51%, grade D+, #76 of 330 statewide, top 23%, 537 students, 45% FRL); Warsaw Community High School (math 37% / reading 68%, grade C-, #102 of 369 statewide, top 28%, 2,104 students, 43% FRL) — zoned schools at 45% FRL track the district average.
- Market conditions: 102 active listings in the ZIP; 261 units permitted in Kosciusko County in 2024 (10 in 5+ unit buildings).
- At $4,903/mo this rent would consume 82% of the median local household income ($72k/yr) (locally 374% of renters already pay >50% of income on rent) — very limited rent-growth headroom before tenants either downsize or default.
Forward outlook
- Local home prices are declining (-3.0%/yr); year-one equity from $2k of loan paydown is wiped out by about $11k of value loss. Plan a longer hold.
- Kosciusko County population projected at +3% by 2050 — modest demand growth; plan on rents tracking national, not racing it.
- At projected returns (-3.0% appreciation + 3.0% rent growth), your $101k cash investment doubles in ~7 years — after that, you're playing with house money.
Negotiation context
- It's been on market 25 days — a 2% lower offer ($355k) is reasonable based on typical stale-listing flexibility.
- 2 sale attempts since 2y ago with the ask held roughly flat each time — persistent listings suggest the price (not the market) is what's stuck; bring a comps-based counter.
- Current owner paid $220k; list at $360k implies a 64% gain — meaningful room to come down on a strong offer.
Risks & watch-outs
- Watch-outs: built in 1873 — expect roof / HVAC / electrical / plumbing capex.
Questions for the listing agent
- Can we see the unit-by-unit rent roll, current vacancy, and any below-market leases? What's the average tenancy length?
- What capital expenditures (roof, boiler, parking lot, exteriors) have been made in the last 5 years, and what's planned in the next 2?
- Built in 1873 — when were the roof, HVAC, electrical panel, plumbing, and water heater last replaced?
- Is there a deadline driving the sale (1031 exchange, divorce, estate, relocation)? That informs how much negotiation room exists.
- Schools are D-rated, which usually means shorter tenancies and higher turnover. Who's the typical renter profile here, and what's been the actual vacancy rate?
- Crime grade is D in this area — have there been break-ins, vandalism, or insurance claims at this property in the last 3 years? What carrier currently insures it and at what premium?
- What's the average days-on-market for RENTAL listings here right now (not sales)? A rising rental-DOM trend means longer vacancies and softer asking-rent achievability than the comps imply.
- What's the recent tenant-quality profile in this submarket — average credit score on applications, eviction rate, late-payment / NSF rate, and stable-employment percentage? A property-management company in the area should have these aggregated.
- How much new apartment / multifamily construction is in the pipeline within 1–3 miles? Heavy new supply (>2% of stock underway) typically softens rents 12–24 months out; light construction supports rent growth.
Investment metrics
- 1% rule
- 1.36% ✓
- Cap rate
- 11.09%
- Cash-on-cash
- 17.12%
- DSCR
- 1.76
- GRM
- 6.1
CMA / ARV
- ARV (on-the-fly)
- $238,224
- Comps found
- 1
Show comp detail 1 sale within ~0.75 mi
| Address | Dist | Beds/Ba | Sqft | Sold | Price | $/sf | Match |
|---|---|---|---|---|---|---|---|
| 221 N Fort Wayne Ave | 0.51mi | 5/3.5 | 2,710 (-4%) | 7mo | $227,000 | $84 | 53 |
Match score weights: distance 35% · size 25% · config 20% · recency 20%. Top-matched comps best support the ARV.
Projected returns pro-forma
-3.0% appreciation · 3.0% rent growth · sell at horizon
- IRR
- 8.4%
- Equity multiple
- 1.33×
- Total profit
- $33,297
- Equity at exit
- $53,677
- IRR
- 17.7%
- Equity multiple
- 2.46×
- Total profit
- $147,101
- Equity at exit
- $31,126
Cash invested: $100,800 (down + closing). Projections, not guarantees.
Landlord ↔ Tenant lean methodology
- Overall (STATE)
- 90 Strongly Landlord-Friendly
- State Indiana
- 90 Strongly Landlord-Friendly · R+11
- County
- — inherits STATE
- City
- — inherits STATE
ZIP-level market 46580
- Home prices YoY
- -19.2%
- Active inventory
- 102
- Price-to-rent
- 36.7×
Monthly cashflow live
- Estimated rent
- $4,903 medium interval (Pro) →
- Mortgage (P&I)
- −$1,888
- Tax from tax record
- −$397 /mo · $4,769/yr
- Insurance
- −$150
- HOA
- −$0
- Vacancy / Maint / Mgmt
- −$1,030
- Net cashflow
- $1,438
Break-even live
6-unit breakdown (identical units grouped — click to expand)
| Units | Beds | Baths | Est. rent |
|---|---|---|---|
| 6× units | 1 | 1 | $4,902 |
| #1 | 1 | 1 | $817 |
| #2 | 1 | 1 | $817 |
| #3 | 1 | 1 | $817 |
| #4 | 1 | 1 | $817 |
| #5 | 1 | 1 | $817 |
| #6 | 1 | 1 | $817 |
| Total (6 units) | $4,903 | ||
UW: 25.0% down · 7.5% · 30yr · 1.5% tax · 5.0% vac · 8.0% maint · 8.0% mgmt
Financing live
Cash to close
- Down payment
- $90,000
- Closing costs
- $10,800
- Reserves months
- —
- Total cash needed
- —
Loan-product check · same deal, 3 products live
Conventional
25% down · 7.5% · 30yr
- Down + closing
- —
- Monthly P&I
- —
- Monthly cashflow
- —
- DSCR
- —
- Eligible?
- —
Personal DTI + credit; lowest rate.
DSCR
20% down · 8.5% · 30yr
- Down + closing
- —
- Monthly P&I
- —
- Monthly cashflow
- —
- DSCR
- —
- Eligible?
- —
No personal income docs; deal must DSCR.
Hard money
10% down · 12.0% · 12mo
- Down + closing
- —
- Monthly P&I
- —
- Monthly cashflow
- —
- DSCR
- —
- Eligible?
- —
Short-term bridge; refi at stabilization.
Listing history 17 events
-
2026-06-19days on market $360,000 Active 25 DOM
-
2026-06-18days on market $360,000 Active 24 DOM
-
2026-06-17days on market $360,000 Active 23 DOM
-
2026-06-16days on market $360,000 Active 22 DOM
-
2026-06-15days on market $360,000 Active 21 DOM
-
2026-06-14days on market $360,000 Active 19 DOM
-
2026-06-12days on market $360,000 Active 18 DOM
-
2026-06-09days on market $360,000 Active 15 DOM
-
2026-06-08days on market $360,000 Active 14 DOM
-
2026-06-07days on market $360,000 Active 13 DOM
-
2026-06-02days on market $360,000 Active 8 DOM
-
2026-06-01days on market $360,000 Active 7 DOM
-
2026-05-31days on market $360,000 Active 6 DOM
-
2026-05-30days on market $360,000 Active 5 DOM
-
2026-05-25$360,000 Active
-
2024-05-29soldstatus $220,000 47-char remark
Show marketing remark (47 chars)
For questions please contact the listing agent.
-
2024-02-09$240,000 47-char remark
Show marketing remark (47 chars)
For questions please contact the listing agent.
ⓘ Source: listings_history table (triggers on properties + properties_extension) + one-shot
backfill from property_details.listing_events for pre-trigger history.
Tax reassessment forecast IN · Partial reset (capped growth)
- Current annual tax
- $4,769 · $397/mo
- Projected year-2 tax
- $4,769 · $397/mo
- Expected delta
- $0/yr ($0/mo · 0.0%)
ⓘ Screening estimate from a state-policy table — verify with the county assessor before closing.
Climate risk First Street
- Flood 1/10 Low FEMA zone X (unshaded) · 0% chance over 30 yrs
- Wildfire 1/10 Low
- Heat 3/10 Moderate 7 d/yr ≥99°F today · 16 d/yr by 30 yrs out
- Wind 2/10 Low
- Air quality 3/10 Moderate 1 unhealthy d/yr today · 3 by 30 yrs out
Nearby sold comps map
Loading sold comps map…
Walkable amenities ~0.75 mi
Loading nearby amenities…
Taxation est. · year 1
- Rental income
- $58,836
- − Mortgage interest
- −$20,166
- − Property taxes
- −$4,769
- − Insurance
- −$1,800
- − Repairs & maintenance
- −$4,707
- − Management
- −$4,707
- − Depreciation
- −$10,473
- Taxable income
- $12,215
- Est. tax owed @ 24.0%
- −$2,932
- After-tax cash flow
- $14,325/yr
For passive investors: Depreciation is non-cash, so a rental often shows a tax loss while cash-flowing — sheltering income. Rental losses are passive: they offset passive income freely, and up to $25,000/yr can offset ordinary (W-2) income if you actively participate and your MAGI is under $100k (phasing out to $0 by $150k); unused losses carry forward. On sale, claimed depreciation is recaptured at up to 25%, and gains may owe capital-gains tax (a 1031 exchange can defer both). Figures are a year-1 estimate at your 24.0% rate — not tax advice; consult a CPA.
Schools (NCES district)
- District
- Warsaw Community Schools
- NCES district ID
- 1812420
- Math proficiency
- 45% ▼ -4.00%
- Reading proficiency
- 49% ▬ 0.00%
- Median HH income
- $52,461
- Composite
- 40.53/100
- National rank
- #3705
- State rank
- #78 of 301 in IN
Livability — Warsaw
- Score
- 77/100
- State rank
- #42
- US rank
- #3114
Category grades
Schools grade is shown separately in the Schools card above.
Census & demographics
- Census place
- Warsaw, IN
- County
- Kosciusko County · 36,398 people
- City population
- 36,398
- Metro
- Warsaw, IN
- Population (ZIP)
- 21,794
- Household income
- $71,687
- Rent vs Own
- Severe rent burden
- 374.0
Population outlook (Kosciusko County) Hauer SSP2
- Today (2025)
- 81,747 people
- By 2030
- 82,878 · +1.4%
- By 2040
- 84,270 · +3.1%
- By 2050
- 84,191 · +3.0%
- By 2075
- 82,918 · +1.4%
- By 2100
- 74,808 · -8.5%
Race, ethnicity, and origin ACS 2023
- Neighborhood character
- Predominantly White (83%)
- Race & ethnicity
- White 83% Hispanic / Latino 13% Two or more races 8%
- Hispanic origin (detail)
- Mexican 10% Puerto Rican 1%
- Common ancestry
- Italian 2% Iranian 1% Portuguese 1%
- Foreign-born
- 6% · Canada
- Languages at home
- 90% English-only · Spanish 9%
Political lean MEDSL · Kosciusko
- 2024 margin
- Solid R (+52.3) · D 22.9% · R 75.2% · Other 1.9%
- 2008→2024 swing
- -14.9pp toward R · 2008: -37.3pp · 2024: -52.3pp
- All cycles
- 2024: R+52.3 2020: R+50.7 2016: R+55.1 2012: R+52.2 2008: R+37.3
Not yet ingested
- Civics
- —
Market trends
- HPI YoY
- ▼ -67.41%
- Current HPI
- 283.1513
- Rent YoY
- —
- Metro
- Warsaw, IN
- State GDP YoY
- ▲ 2.90%
- F500 in state
- 18
Industry mix (Fortune 500 HQ in IN)
| Industry | F500 HQs | Revenue |
|---|---|---|
| Industrial Machinery | 2 | $37B |
|
||
| Healthcare | 1 | $177B |
|
||
| Pharmaceuticals | 1 | $45B |
|
||
| Metals / Steel | 1 | $18B |
|
||
| Agriculture | 1 | $17B |
|
||
| Packaging | 1 | $12B |
|
||
Price history
+50.0% since first listed3 events — show timeline
- 2026-05-25 Listed $360,000 IRMLS
- 2024-05-29 Sold (MLS) $220,000 IRMLS
- 2024-02-09 Listed $240,000 IRMLS
Property tax history
+4.9%/yrLatest (2024): $4,769 · +3.3% YoY. Source: county tax records.
Cash-flow waterfall
monthlySold comps — $/sqft
last 12 mo · ≤1 miLoading sold comps…