1684 Us-9 · Schroon Lake, NY
Flood risk 1/10 · Minimal
- FEMA flood zone
- X
- Chance of flooding over 30 yrs
- 0.0%
- Est. flood insurance / yr
- $473 – $860
Fire risk 1/10 · Minimal
- Est. fire insurance / yr
- $691 – $1,283
Heat risk 2/10 · Minimal
- Hot days now (above 92°F)
- 8 days/yr
- Hot days in 30 yrs
- 17 days/yr
Wind risk 2/10 · Minimal
- Chance of severe wind over 30 yrs
- 1.0%
Air-quality risk 1/10 · Minimal
- Unhealthy air days now
- 0 days/yr
- Unhealthy air days in 30 yrs
- 0 days/yr
Risk factors via First Street. Map © Google.
Why this score? — see what drove the D grade
The composite is a weighted blend of 9 inputs, each scored 0–100. Each bar is that input's sub-score; the figure is the points it added to the 100-point composite (weight × sub-score).
- Appreciation +9.1/10.0
- Cash flow +8.5/30.0
- ARV discount +7.5/15.0
- Schools +4.4/10.0
- Livability +3.6/5.0
- Rent growth +2.5/5.0
- Condition / age +2.5/5.0
- 1% rule +2.3/10.0
- DSCR +2.3/10.0
$195,000
🖨 Deal sheet (PDF) 📄 Offer letter ✓ Due diligence
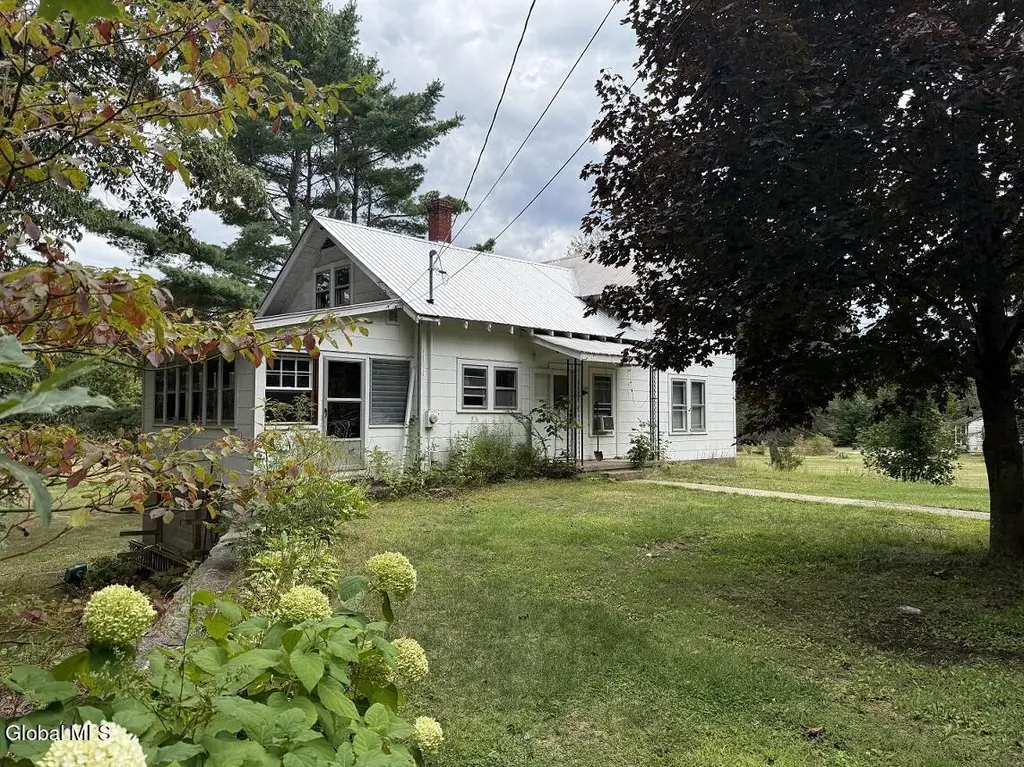
Listing remarks
1930's 2 story home on 2.7 mostly cleared & level acres approximately 3 miles from Schroon Lake Village. Needs TLC. 3 bedrooms, bath, living room, dining area, 2nd floor bonus room, porch. Basement with workshop and had 1 car garage. Acreage is ideal for huge garden or other ideas!
Key facts
- Level acres
- 2.7 acres
- 2 story home
Tags
Neighborhood map
What this means for you Summary
Snapshot
- This is a 3-bed/1.0-bath single-family listed at $195k.
Deal economics
- At list price, monthly cash flow is $-172 ($-2k/yr) — negative.
- To cash-flow at today's rent, offer at most $165k (15.6% below list).
- To meet the 1% rule (rent ≥ 1% of price), the offer needs to be $142k (27.2% below list).
- Recommended offer: $142k (27.2% below list) — sets the bar for 1% rule.
- Cap rate 5.2% vs local median 0.7% in Schroon Lake — top-decile yield for the area; either an underpriced asset or a hidden risk that comps aren't pricing in. Stress-test before assuming the spread holds.
Location & tenants
- Location reads 71/100 on livability (#406 in NY) — a middle-class / working-renter tenant base. Strengths: cost of living A, housing A-, schools B; Watch: amenities C-, crime F, commute F.
- Schroon Lake Central School District (rural): math 45% / reading 55% proficiency, ranked #473 of 755 in NY (top 63%) — acceptable for families but not a draw, mixed tenant base, ~2y average lease.
- Market conditions: 34 active listings in the ZIP; 218 units permitted in Essex County in 2024 (63 in 5+ unit buildings).
Forward outlook
- In year one you build about $18k of equity ($1k loan paydown + $16k appreciation (8.3% local appreciation)).
- Essex County population projected at -20% by 2050 — secular population decline; favor cash flow + early exit over multi-decade hold.
- By year 3, paydown + projected appreciation supports a ~$44k cash-out refi (75% LTV) — recoverable capital for the next deal without selling this one.
Negotiation context
- Only 10 days on market — expect competitive offers; lowballing is unlikely to land.
- 2 sale attempts since 4y ago with the ask held roughly flat each time — persistent listings suggest the price (not the market) is what's stuck; bring a comps-based counter.
- Current owner paid $128k; list at $195k implies a 52% gain — meaningful room to come down on a strong offer.
Risks & watch-outs
- Watch-outs: built in 1935 — expect roof / HVAC / electrical / plumbing capex.
Questions for the listing agent
- What do current leases actually rent for vs. the listed asking? Can we see a recent rent roll and the last 12 months of T-12 income?
- Built in 1935 — when were the roof, HVAC, electrical panel, plumbing, and water heater last replaced?
- Is there a deadline driving the sale (1031 exchange, divorce, estate, relocation)? That informs how much negotiation room exists.
- Schools are B-rated — typically a magnet for longer-tenancy family renters. What's the average tenant stay here, and is there a school-zone premium baked into asking?
- Crime grade is F in this area — have there been break-ins, vandalism, or insurance claims at this property in the last 3 years? What carrier currently insures it and at what premium?
- The area grade is low — what's the realistic commute time and amenity access for the typical tenant pool here? Any planned neighborhood developments (good or bad) we should know about?
- What's the average days-on-market for RENTAL listings here right now (not sales)? A rising rental-DOM trend means longer vacancies and softer asking-rent achievability than the comps imply.
- What's the recent tenant-quality profile in this submarket — average credit score on applications, eviction rate, late-payment / NSF rate, and stable-employment percentage? A property-management company in the area should have these aggregated.
- How much new for-sale + rental construction is in the pipeline within 1–3 miles? Heavy new supply typically softens prices + rents 12–24 months out; constrained supply supports both.
Investment metrics
- 1% rule
- 0.73% ✗
- Cap rate
- 5.23%
- Cash-on-cash
- -3.78%
- DSCR
- 0.83
- GRM
- 11.5
CMA / ARV
No comps found within radius.
Projected returns pro-forma
8.29% appreciation · 3.0% rent growth · sell at horizon
- IRR
- 17.8%
- Equity multiple
- 2.34×
- Total profit
- $73,007
- Equity at exit
- $152,033
- IRR
- 16.8%
- Equity multiple
- 5.03×
- Total profit
- $220,146
- Equity at exit
- $305,567
Cash invested: $54,600 (down + closing). Projections, not guarantees.
Landlord ↔ Tenant lean methodology
- Overall (STATE)
- 15 Strongly Tenant-Friendly
- State New York
- 15 Strongly Tenant-Friendly · D+10
- County
- — inherits STATE
- City
- — inherits STATE
ZIP-level market 12870
- Home prices YoY
- 2.3%
- Active inventory
- 34
- Price-to-rent
- 11.5×
Monthly cashflow live
- Estimated rent
- $1,419 medium interval (Pro) →
- Mortgage (P&I)
- −$1,023
- Tax from tax record
- −$189 /mo · $2,268/yr
- Insurance
- −$81
- HOA
- −$0
- Vacancy / Maint / Mgmt
- −$298
- Net cashflow
- $-172
Break-even live
Sensitivity live
| Price | -10% $-62 | -5% $-117 | +0% $-172 | +5% $-227 | +10% $-283 |
|---|---|---|---|---|---|
| Rent | -10% $-284 | -5% $-228 | +0% $-172 | +5% $-116 | +10% $-60 |
| Rate | -1.0pp $-74 | -0.5pp $-123 | base $-172 | +0.5pp $-223 | +1.0pp $-274 |
UW: 25.0% down · 7.5% · 30yr · 1.5% tax · 5.0% vac · 8.0% maint · 8.0% mgmt
Financing live
Cash to close
- Down payment
- $48,750
- Closing costs
- $5,850
- Reserves months
- —
- Total cash needed
- —
Loan-product check · same deal, 3 products live
Conventional
25% down · 7.5% · 30yr
- Down + closing
- —
- Monthly P&I
- —
- Monthly cashflow
- —
- DSCR
- —
- Eligible?
- —
Personal DTI + credit; lowest rate.
DSCR
20% down · 8.5% · 30yr
- Down + closing
- —
- Monthly P&I
- —
- Monthly cashflow
- —
- DSCR
- —
- Eligible?
- —
No personal income docs; deal must DSCR.
Hard money
10% down · 12.0% · 12mo
- Down + closing
- —
- Monthly P&I
- —
- Monthly cashflow
- —
- DSCR
- —
- Eligible?
- —
Short-term bridge; refi at stabilization.
Listing history 6 events
-
2026-03-24status Pending
-
2026-03-14$195,000 Active
-
2023-06-25historical
-
2023-04-03price $172,000
-
2022-07-31$185,000 Active
-
2009-01-07soldstatus $128,000
ⓘ Source: listings_history table (triggers on properties + properties_extension) + one-shot
backfill from property_details.listing_events for pre-trigger history.
Tax reassessment forecast NY · Partial reset (capped growth)
- Current annual tax
- $2,268 · $189/mo
- Projected year-2 tax
- $2,782 · $232/mo
- Expected delta
- +$514/yr (+$43/mo · 22.7%)
ⓘ Screening estimate from a state-policy table — verify with the county assessor before closing.
Climate risk First Street
- Flood 1/10 Low FEMA zone X · 0% chance over 30 yrs
- Wildfire 1/10 Low
- Heat 2/10 Low 8 d/yr ≥92°F today · 17 d/yr by 30 yrs out
- Wind 2/10 Low 100% chance of damaging wind over 30 yrs
- Air quality 1/10 Low 0 unhealthy d/yr today · 0 by 30 yrs out
Nearby sold comps map
Loading sold comps map…
Walkable amenities ~0.75 mi
Loading nearby amenities…
Taxation est. · year 1
- Rental income
- $17,024
- − Mortgage interest
- −$10,923
- − Property taxes
- −$2,268
- − Insurance
- −$975
- − Repairs & maintenance
- −$1,362
- − Management
- −$1,362
- − Depreciation
- −$5,673
- Taxable loss
- −$5,539
- Est. tax savings @ 24.0%
- +$1,329
- After-tax cash flow
- $-736/yr
For passive investors: Depreciation is non-cash, so a rental often shows a tax loss while cash-flowing — sheltering income. Rental losses are passive: they offset passive income freely, and up to $25,000/yr can offset ordinary (W-2) income if you actively participate and your MAGI is under $100k (phasing out to $0 by $150k); unused losses carry forward. On sale, claimed depreciation is recaptured at up to 25%, and gains may owe capital-gains tax (a 1031 exchange can defer both). Figures are a year-1 estimate at your 24.0% rate — not tax advice; consult a CPA.
Schools (NCES district)
- District
- Schroon Lake Central School District
- NCES district ID
- 3626130
- Math proficiency
- 45% ▲ 5.00%
- Reading proficiency
- 55% ▬ 0.00%
- Median HH income
- $44,428
- Composite
- 44.25/100
- National rank
- #6181
- State rank
- #473 of 755 in NY
Livability — Schroon Lake
- Score
- 71/100
- State rank
- #406
- US rank
- #6982
Category grades
Schools grade is shown separately in the Schools card above.
Census & demographics
- City population
- 1,770
- Population (ZIP)
- 1,770
Population outlook (Essex County) Hauer SSP2
- Today (2025)
- 36,758 people
- By 2030
- 35,697 · -2.9%
- By 2040
- 32,697 · -11.0%
- By 2050
- 29,248 · -20.4%
- By 2075
- 22,641 · -38.4%
- By 2100
- 16,602 · -54.8%
Race, ethnicity, and origin ACS 2023
- Neighborhood character
- Predominantly White (97%)
- Race & ethnicity
- White 97% Two or more races 2%
- Common ancestry
- Iranian 10% Romanian 9% Italian 9%
- Foreign-born
- 3% · Canada
- Languages at home
- 99% English-only · Other Indo-European 1%
Political lean MEDSL · Essex
- 2024 margin
- Toss-up / Even · D 50.2% · R 49.8%
- 2008→2024 swing
- -12.8pp toward R · 2008: 13.3pp · 2024: 0.5pp
- All cycles
- 2024: D+0.5 2020: D+5.0 2016: R+3.4 2012: D+15.0 2008: D+13.3
Not yet ingested
- Civics
- —
Market trends
- HPI YoY
- ▲ 8.29%
- Current HPI
- 372.7077
- Rent YoY
- —
- Metro
- —
- State GDP YoY
- ▲ 2.60%
- F500 in state
- 92
Industry mix (Fortune 500 HQ in NY)
| Industry | F500 HQs | Revenue |
|---|---|---|
| Financial Services | 10 | $950B |
|
||
| Consumer Goods | 9 | $162B |
|
||
| Insurance | 4 | $225B |
|
||
| Telecommunications | 2 | $144B |
|
||
| Pharmaceuticals | 2 | $112B |
|
||
| Media / Entertainment | 2 | $69B |
|
||
Price history
+52.3% since first listed6 events — show timeline
- 2026-03-24 Pending — Global MLS
- 2026-03-14 Listed $195,000 Global MLS
- 2023-06-25 Listing Removed — Global MLS
- 2023-04-03 Price Changed $172,000 Global MLS
- 2022-07-31 Listed $185,000 Global MLS
- 2009-01-07 Sold (Public Records) $128,000 Public Records
Property tax history
+4.0%/yrLatest (2025): $2,268 · +4.5% YoY. Source: county tax records.
Cash-flow waterfall
monthlySold comps — $/sqft
last 12 mo · ≤1 miLoading sold comps…