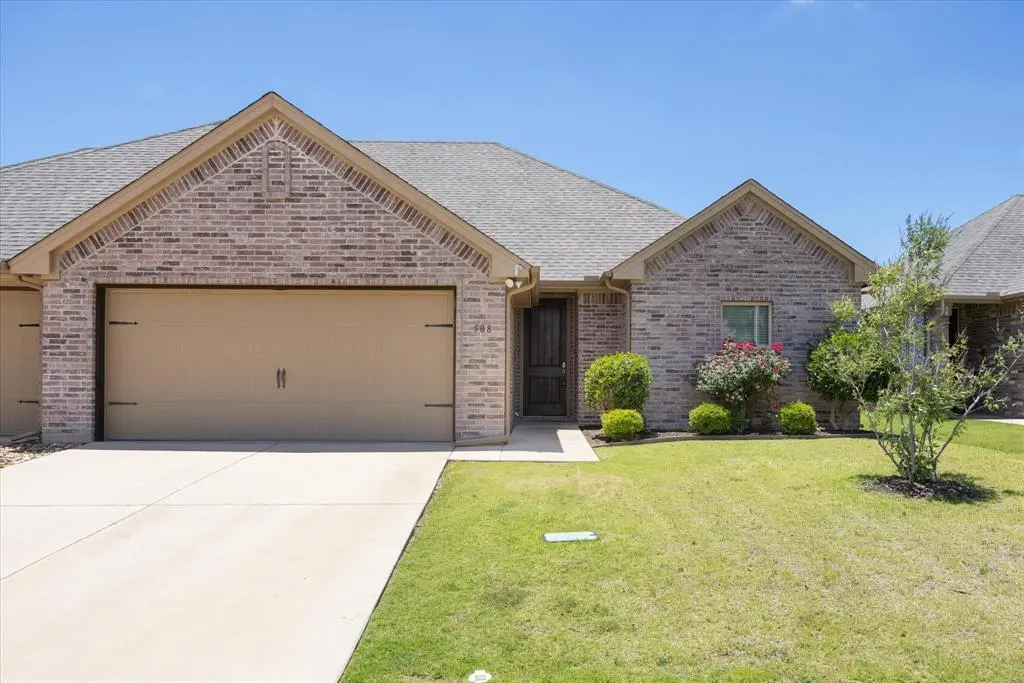
508 Landry Ct · Granbury, TX
Flood risk 1/10 · Minimal
- FEMA flood zone
- X (unshaded)
- Chance of flooding over 30 yrs
- 0.0%
- Est. flood insurance / yr
- $507 – $1,088
Fire risk 6/10 · Moderate
- Est. fire insurance / yr
- $1,222 – $2,270
Heat risk 7/10 · Major
- Hot days now (above 108°F)
- 7 days/yr
- Hot days in 30 yrs
- 25 days/yr
Wind risk 6/10 · Moderate
- Chance of severe wind over 30 yrs
- 27.0%
Air-quality risk 2/10 · Minimal
- Unhealthy air days now
- 1 days/yr
- Unhealthy air days in 30 yrs
- 2 days/yr
Risk factors via First Street. Map © Google.
Why this score? — see what drove the D grade
The composite is a weighted blend of 9 inputs, each scored 0–100. Each bar is that input's sub-score; the figure is the points it added to the 100-point composite (weight × sub-score).
- ARV discount +12.9/15.0
- Cash flow +11.3/30.0
- Schools +4.0/10.0
- Rent growth +3.8/5.0
- 1% rule +3.7/10.0
- DSCR +3.3/10.0
- Livability +3.3/5.0
- Condition / age +2.5/5.0
- Appreciation +0.0/10.0
$264,999
🖨 Deal sheet (PDF) 📄 Offer letter ✓ Due diligence
Listing remarks
Don't miss the opportunity to own this beautiful three-bedroom, two-bathroom townhome with a two-car garage, ideally situated at the end of a quiet cul-de-sac. Built in 2018, this well-designed home offers an open-concept floor plan, generous storage, and spacious rooms throughout. Enjoy a prime location just minutes from popular shopping destinations, including HEB and Kroger, less than 10 minutes from the charming Historic Town Square, and with convenient access to the DFW Metroplex. Interior features include granite countertops, wood flooring in the main living areas, carpeted bedrooms, decorative lighting, soaring ceilings, full-size washer and dryer connections, and a cozy fireplace pe
Key facts
- $25 HOA
- 2 garage spots
- Built 2018
Property features AI
Finance
- Other: Deed restrictions apply (including architectural and pet restrictions); Easements for utilities
- Financial info: Listing accepts Cash, Conventional, FHA and VA financing
- HOA & community: Mandatory HOA (Old Granbury Villa); Annual HOA fee of $300; Association fee covers full use of facilities and management fees
Exterior
- Parking: Covered driveway; Concrete surfaces; Attached 2-car garage with garage door opener (garage faces front); 2 covered parking spaces
- Security: No surveillance devices present
- Utilities: City water with individual water meter; City sewer; Electricity connected; Cable available; All-weather road access
- Home design: Townhouse (residential); One-story; Interior lot in Old Granbury Villa subdivision; No accessory unit; Preowned (built 2018)
- Construction: Brick construction; Composition roof; Slab foundation; Year built 2018
- Exterior features: Covered front porch and covered patio; Gutters; Exterior lighting; Landscaped yard with few trees; Large backyard with grass; Wood fenced backyard
Interior
- Kitchen: Granite countertops / natural stone; Breakfast bar; Built-in cabinets; Walk-in pantry; Water line to refrigerator; Dishwasher; Electric oven and electric range; Microwave
- Bedrooms: Primary bedroom on main level with ensuite bath, garden tub, separate shower, dual sinks and custom closet system; Two additional bedrooms on main level (split bedrooms)
- Flooring: Carpet; Ceramic tile
- Bathrooms: Two full bathrooms; Primary bathroom with garden tub, separate shower, dual sinks and natural stone/granite surfaces; Secondary bathroom with built-in cabinets and natural stone/granite surfaces
- Heating & cooling: Central heating (electric); Central air (electric); Ceiling fan(s)
- Interior features: Open floorplan; Decorative lighting; Flat screen wiring; Cable TV available; High speed internet available; Double vanity; Walk-in closet(s); Pantry; Kitchen island; Eat-in kitchen
- Laundry & utility: Full-size washer/dryer area on site; Washer hookup; Electric dryer hookup; Utility room / separate utility room with built-in cabinets
Neighborhood map
What this means for you Summary
Snapshot
- This is a 3-bed/2.0-bath townhouse listed at $265k.
Deal economics
- At list price, monthly cash flow is $-96 ($-1k/yr) — negative.
- To cash-flow at today's rent, offer at most $248k (6.4% below list).
- To meet the 1% rule (rent ≥ 1% of price), the offer needs to be $230k (13.3% below list).
- Recommended offer: $230k (13.3% below list) — sets the bar for 1% rule.
- Cap rate 5.9% vs local median 3.8% in Granbury — top-decile yield for the area; either an underpriced asset or a hidden risk that comps aren't pricing in. Stress-test before assuming the spread holds.
Location & tenants
- Location reads 66/100 on livability (#628 in TX) — a middle-class / working-renter tenant base. Strengths: cost of living A+, housing A+, health & safety A+; Watch: employment C-, crime D+, amenities F.
- Granbury ISD (town): math 46% / reading 46% proficiency, ranked #237 of 826 in TX (top 29%) — families likely to look elsewhere, expect single-tenant / working-renter base with shorter leases.
- Zoned schools: Acton El (math 52% / reading 46%, grade D, #926 of 4,322 statewide, top 22%, 814 students, 48% FRL); Acton Middle (math 52% / reading 48%, grade C, #347 of 1,662 statewide, top 21%, 981 students, 43% FRL); Granbury H S (math 38% / reading 51%, grade F, #652 of 1,632 statewide, top 43%, 2,202 students, 46% FRL) — zoned schools at 46% FRL track the district average.
- Market conditions: Rents rising fast (+5.2%/yr); 701 active listings in the ZIP; 24 comparable units currently listed for rent nearby; rentals lingering (median 46d on market — plan ~5-8 weeks vacancy on turnover, expect pricing pressure); 58% of comp listings sitting > 30 days — soft ceiling on asking rent; solid renter incomes; 125 units permitted in Hood County in 2024 (0 in 5+ unit buildings).
Forward outlook
- Local home prices are declining (-3.0%/yr); year-one equity from $2k of loan paydown is wiped out by about $8k of value loss. Plan a longer hold.
- Hood County population projected at +29% by 2050 — long-run rental-demand tailwind backs the buy-and-hold thesis.
Negotiation context
- It's been on market 17 days — a 2% lower offer ($261k) is reasonable based on typical stale-listing flexibility.
- 5 sale attempts since 8y ago with the ask held roughly flat each time — persistent listings suggest the price (not the market) is what's stuck; bring a comps-based counter.
Risks & watch-outs
- Climate carrying-cost: major wind risk, 27% chance of damaging wind over 30y; major wildfire risk; extreme-heat days projected 7→25/yr by 2055 (HVAC capex compounding) — expect insurance premiums to compound above CPI over the hold.
Questions for the listing agent
- What do current leases actually rent for vs. the listed asking? Can we see a recent rent roll and the last 12 months of T-12 income?
- What does the HOA fee cover, when was the last increase, and are there any pending special assessments or reserve-fund shortfalls?
- Is there a deadline driving the sale (1031 exchange, divorce, estate, relocation)? That informs how much negotiation room exists.
- Schools are D-rated, which usually means shorter tenancies and higher turnover. Who's the typical renter profile here, and what's been the actual vacancy rate?
- Crime grade is D in this area — have there been break-ins, vandalism, or insurance claims at this property in the last 3 years? What carrier currently insures it and at what premium?
- The area grade is low — what's the realistic commute time and amenity access for the typical tenant pool here? Any planned neighborhood developments (good or bad) we should know about?
- What's the average days-on-market for RENTAL listings here right now (not sales)? A rising rental-DOM trend means longer vacancies and softer asking-rent achievability than the comps imply.
- What's the recent tenant-quality profile in this submarket — average credit score on applications, eviction rate, late-payment / NSF rate, and stable-employment percentage? A property-management company in the area should have these aggregated.
- How much new for-sale + rental construction is in the pipeline within 1–3 miles? Heavy new supply typically softens prices + rents 12–24 months out; constrained supply supports both.
Investment metrics
- 1% rule
- 0.87% ✗
- Cap rate
- 5.86%
- Cash-on-cash
- -1.55%
- DSCR
- 0.93
- GRM
- 9.6
CMA / ARV
- ARV (on-the-fly)
- $301,257
- Comps found
- 6
Show comp detail 6 sales within ~0.75 mi
| Address | Dist | Beds/Ba | Sqft | Sold | Price | $/sf | Match |
|---|---|---|---|---|---|---|---|
| 521 Landry Ct | 0.04mi | 3/2.0 | 1,611 (0%) | 17mo | $299,000 | $186 | 84 |
| 517 Landry Ct | 0.04mi | 3/2.0 | 1,611 (0%) | 22mo | $309,000 | $192 | 80 |
| 544 Landry Ct | 0.08mi | 2/2.0 (-1) | 1,527 (-5%) | 14mo | $249,999 | $164 | 71 |
| 541 Landry Ct | 0.08mi | 2/2.0 (-1) | 1,527 (-5%) | 17mo | $285,000 | $187 | 69 |
| 525 Landry Ct | 0.05mi | 2/2.0 (-1) | 1,527 (-5%) | 18mo | $250,000 | $164 | 69 |
| 504 Landry Ct | 0.01mi | 2/2.0 (-1) | 1,527 (-5%) | 21mo | $285,000 | $187 | 69 |
Match score weights: distance 35% · size 25% · config 20% · recency 20%. Top-matched comps best support the ARV.
Projected returns pro-forma
-3.0% appreciation · 5.2% rent growth · sell at horizon
- IRR
- -16.3%
- Equity multiple
- 0.41×
- Total profit
- $-43,753
- Equity at exit
- $39,512
- IRR
- -4.3%
- Equity multiple
- 0.69×
- Total profit
- $-23,293
- Equity at exit
- $22,912
Cash invested: $74,200 (down + closing). Projections, not guarantees.
Landlord ↔ Tenant lean methodology
- Overall (STATE)
- 87 Strongly Landlord-Friendly
- State Texas
- 87 Strongly Landlord-Friendly · R+5
- County
- — inherits STATE
- City
- — inherits STATE
ZIP-level market 76049
- Home prices YoY
- -26.8%
- Rents YoY
- 5.2%
- Active inventory
- 701
- Price-to-rent
- 9.6×
Monthly cashflow live
- Estimated rent
- $2,298 high interval (Pro) →
- Mortgage (P&I)
- −$1,390
- Tax from tax record
- −$386 /mo · $4,631/yr
- Insurance
- −$110
- HOA
- −$25
- Vacancy / Maint / Mgmt
- −$483
- Net cashflow
- $-96
Break-even live
Sensitivity live
| Price | -10% $54 | -5% $-21 | +0% $-96 | +5% $-171 | +10% $-246 |
|---|---|---|---|---|---|
| Rent | -10% $-277 | -5% $-186 | +0% $-96 | +5% $-5 | +10% $86 |
| Rate | -1.0pp $38 | -0.5pp $-28 | base $-96 | +0.5pp $-164 | +1.0pp $-234 |
UW: 25.0% down · 7.5% · 30yr · 1.5% tax · 5.0% vac · 8.0% maint · 8.0% mgmt
Financing live
Cash to close
- Down payment
- $66,250
- Closing costs
- $7,950
- Reserves months
- —
- Total cash needed
- —
Loan-product check · same deal, 3 products live
Conventional
25% down · 7.5% · 30yr
- Down + closing
- —
- Monthly P&I
- —
- Monthly cashflow
- —
- DSCR
- —
- Eligible?
- —
Personal DTI + credit; lowest rate.
DSCR
20% down · 8.5% · 30yr
- Down + closing
- —
- Monthly P&I
- —
- Monthly cashflow
- —
- DSCR
- —
- Eligible?
- —
No personal income docs; deal must DSCR.
Hard money
10% down · 12.0% · 12mo
- Down + closing
- —
- Monthly P&I
- —
- Monthly cashflow
- —
- DSCR
- —
- Eligible?
- —
Short-term bridge; refi at stabilization.
Rent comps 24 comps
| Address | Beds | Baths | Sqft | Rent | $/sqft | DOM | Units | Dist |
|---|---|---|---|---|---|---|---|---|
| 107 Donna Cir Granbury, TX | 3.0 | 2.0 | 1735 | $2,400 | $1.38 | 45d | 1 | 0.05mi |
| 213 Dean Ct Granbury, TX | 3.0 | 2.0 | 1372 | $1,609 | $1.17 | 4d | 1 | 0.23mi |
| 4411 Bobbie Ann Dr Granbury, TX | 3.0 | 2.0 | 1645 | $1,650 | $1.00 | 45d | 1 | 0.27mi |
| 208 Bobbie Ann Ct Granbury, TX | 3.0 | 2.0 | 1645 | $1,675 | $1.02 | 45d | 1 | 0.34mi |
| 4606 Francis Ct Granbury, TX | 3.0 | 2.0 | 1300 | $2,100 | $1.62 | 45d | 1 | 0.55mi |
| 700 Rolling Terrace Cir Granbury, TX | 3.0 | 2.0 | 1612 | $1,774 | $1.10 | 9d | 1 | 0.61mi |
| 4000 Sapphire Ln Granbury, TX | 3.0 | 2.0 | 1635 | $1,789 | $1.09 | 4d | 1 | 0.72mi |
| 4700 Topaz Ln Granbury, TX | 4.0 | 2.0 | 2022 | $2,350 | $1.16 | 9d | 1 | 0.74mi |
| 316 Sardius Blvd Granbury, TX | 3.0 | 2.0 | 1686 | $1,950 | $1.16 | 9d | 1 | 0.82mi |
| 4720 Topaz Ln Granbury, TX | 4.0 | 2.0 | 1903 | $2,400 | $1.26 | 26d | 1 | 0.83mi |
| 801 Meadowlark Cir Granbury, TX | 3.0 | 1.5 | 1100 | $1,400 | $1.27 | 14d | 1 | 0.93mi |
| 4816 Sapphire Ln Granbury, TX | 4.0 | 2.0 | 1878 | $2,400 | $1.28 | 45d | 1 | 0.93mi |
| 905 Dart Ct Unit 905 Granbury, TX | 3.0 | 2.0 | 1544 | $1,650 | $1.07 | 0d | 1 | 1.00mi |
| 100 Cardinal Woods Ct Granbury, TX | 3.0 | 2.5 | 1980 | $3,850 | $1.94 | 45d | 1 | 1.03mi |
| 102 Cardinal Woods Ct Granbury, TX | 2.0 | 2.0 | 1620 | $3,650 | $2.25 | 45d | 1 | 1.03mi |
| 104 Cardinal Woods Ct Granbury, TX | 3.0 | 2.5 | 1890 | $3,850 | $2.04 | 45d | 1 | 1.04mi |
| 3009 Meandering Way Granbury, TX | 4.0 | 2.0 | 1750 | $2,200 | $1.26 | 19d | 1 | 1.04mi |
| 902 Twine St Granbury, TX | 3.0 | 2.0 | 1577 | $1,695 | $1.07 | 45d | 1 | 1.04mi |
| 106 Cardinal Woods Ct Granbury, TX | 2.0 | 2.0 | 1600 | $3,650 | $2.28 | 45d | 1 | 1.05mi |
| 108 Cardinal Woods Ct Granbury, TX | 2.0 | 2.5 | 2040 | $3,850 | $1.89 | 45d | 1 | 1.06mi |
| 110 Cardinal Woods Ct Granbury, TX | 3.0 | 2.5 | 1980 | $3,850 | $1.94 | 45d | 1 | 1.06mi |
| 112 Cardinal Woods Ct Granbury, TX | 3.0 | 2.5 | 1890 | $3,850 | $2.04 | 45d | 1 | 1.07mi |
| 211 S Cardinal Ct Granbury, TX | 3.0 | 2.5 | 1980 | $3,850 | $1.94 | 45d | 1 | 1.09mi |
| 3002 Promenade Dr Granbury, TX | 3.0 | 2.0 | 1858 | $2,400 | $1.29 | 9d | 1 | 1.20mi |
HOA detail
- Monthly dues
- $25 · $300/yr
Listing history 11 events
-
2026-06-21days on market $264,999 Active 17 DOM
-
2026-06-18days on market $264,999 Active 14 DOM
-
2026-06-17days on market $264,999 Active 13 DOM
-
2026-06-16days on market $264,999 Active 12 DOM
-
2026-06-15price $264,999 Active 11 DOM
-
2026-06-15days on market $275,000 Active 11 DOM
-
2026-06-13days on market $275,000 Active 9 DOM
-
2026-06-09days on market $275,000 Active 5 DOM
-
2026-06-08days on market $275,000 Active 4 DOM
-
2026-06-07remarks 699-char remark
-
2026-06-07$275,000 Active 3 DOM
ⓘ Source: listings_history table (triggers on properties + properties_extension) + one-shot
backfill from property_details.listing_events for pre-trigger history.
Tax reassessment forecast TX · Resets to sale price
- Current annual tax
- $4,631 · $386/mo
- Projected year-2 tax
- $4,849 · $404/mo
- Expected delta
- +$218/yr (+$18/mo · 4.7%)
ⓘ Screening estimate from a state-policy table — verify with the county assessor before closing.
Climate risk First Street
- Flood 1/10 Low FEMA zone X (unshaded) · 0% chance over 30 yrs
- Wildfire 6/10 Major
- Heat 7/10 Severe 7 d/yr ≥108°F today · 25 d/yr by 30 yrs out
- Wind 6/10 Major 27% chance of damaging wind over 30 yrs
- Air quality 2/10 Low 1 unhealthy d/yr today · 2 by 30 yrs out
Nearby sold comps map
Loading sold comps map…
Walkable amenities ~0.75 mi
Loading nearby amenities…
Taxation est. · year 1
- Rental income
- $27,575
- − Mortgage interest
- −$14,844
- − Property taxes
- −$4,631
- − Insurance
- −$1,325
- − Repairs & maintenance
- −$2,206
- − Management
- −$2,206
- − HOA
- −$300
- − Depreciation
- −$7,709
- Taxable loss
- −$5,646
- Est. tax savings @ 24.0%
- +$1,355
- After-tax cash flow
- $207/yr
For passive investors: Depreciation is non-cash, so a rental often shows a tax loss while cash-flowing — sheltering income. Rental losses are passive: they offset passive income freely, and up to $25,000/yr can offset ordinary (W-2) income if you actively participate and your MAGI is under $100k (phasing out to $0 by $150k); unused losses carry forward. On sale, claimed depreciation is recaptured at up to 25%, and gains may owe capital-gains tax (a 1031 exchange can defer both). Figures are a year-1 estimate at your 24.0% rate — not tax advice; consult a CPA.
Schools (NCES district)
- District
- Granbury ISD
- NCES district ID
- 4821390
- Math proficiency
- 46% ▬ 0.00%
- Reading proficiency
- 46% ▲ 4.00%
- Median HH income
- $55,856
- Composite
- 40.04/100
- National rank
- #3820
- State rank
- #237 of 826 in TX
Livability — Granbury
- Score
- 66/100
- State rank
- #628
- US rank
- #11998
Category grades
Schools grade is shown separately in the Schools card above.
Census & demographics
- Census place
- Granbury, TX
- County
- Hood County · 58,506 people
- City population
- 58,506
- Metro
- Granbury, TX
- Population (ZIP)
- 31,506
- Household income
- $104,967
- Rent vs Own
- Severe rent burden
- 235.0
Population outlook (Hood County) Hauer SSP2
- Today (2025)
- 63,502 people
- By 2030
- 67,459 · +6.2%
- By 2040
- 74,958 · +18.0%
- By 2050
- 81,922 · +29.0%
- By 2075
- 98,872 · +55.7%
- By 2100
- 107,796 · +69.8%
Race, ethnicity, and origin ACS 2023
- Neighborhood character
- Predominantly White (82%)
- Race & ethnicity
- White 82% Hispanic / Latino 14% Two or more races 9%
- Hispanic origin (detail)
- Mexican 11%
- Common ancestry
- Slovak 3% Serbian 2% Italian 2%
- Foreign-born
- 5% · Canada
- Languages at home
- 91% English-only · Spanish 8%
Political lean MEDSL · Hood
- 2024 margin
- Solid R (+66.0) · D 16.6% · R 82.6%
- 2008→2024 swing
- -11.9pp toward R · 2008: -54.0pp · 2024: -66.0pp
- All cycles
- 2024: R+66.0 2020: R+64.1 2016: R+66.5 2012: R+64.7 2008: R+54.0
Not yet ingested
- Civics
- —
Market trends
- HPI YoY
- ▼ -100.09%
- Current HPI
- 273.1293
- Rent YoY
- ▲ 5.20%
- Metro
- Granbury, TX
- State GDP YoY
- ▲ 3.95%
- F500 in state
- 110
Industry mix (Fortune 500 HQ in TX)
| Industry | F500 HQs | Revenue |
|---|---|---|
| Energy | 16 | $1,198B |
|
||
| Technology | 5 | $198B |
|
||
| Engineering / Construction | 4 | $72B |
|
||
| Energy Services | 3 | $60B |
|
||
| Utilities | 3 | $41B |
|
||
| Healthcare | 2 | $330B |
|
||
Price history
+22.3% since first listed11 events — show timeline
- 2026-06-04 Listed $275,000 NTREIS
- 2024-01-18 Rental Removed $1,700 NTREIS
- 2023-12-31 Listed for Rent $1,700 NTREIS
- 2023-12-06 Rental Removed $1,700 NTREIS
- 2023-12-05 Listed for Rent $1,700 NTREIS
- 2020-10-22 Sold (Public Records) — Public Records
- 2020-07-26 Listing Removed — NTREIS
- 2020-02-13 Listed $229,900 NTREIS
- 2019-04-04 Sold (Public Records) — Public Records
- 2018-08-23 Listing Removed — NTREIS
- 2018-06-19 Listed $224,900 NTREIS
Property tax history
+35.6%/yrLatest (2025): $4,631 · +0.9% YoY. Source: county tax records.
Cash-flow waterfall
monthlySold comps — $/sqft
last 12 mo · ≤1 miLoading sold comps…