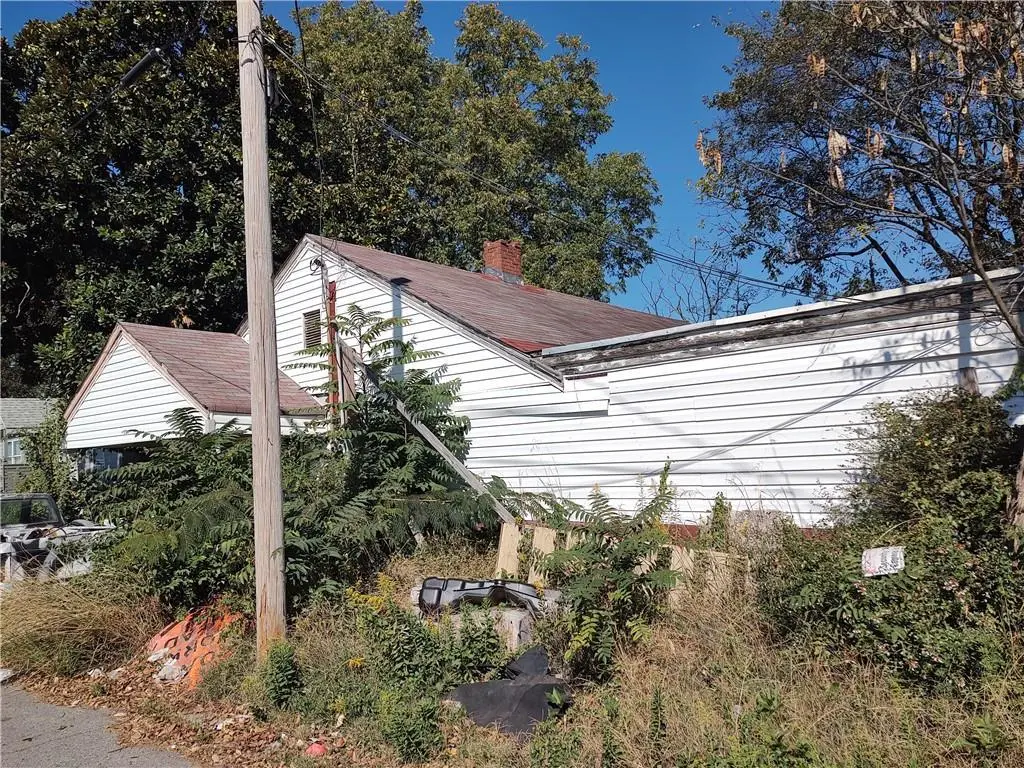
3159 Lakewood Ave SW · Atlanta, GA
Flood risk 1/10 · Minimal
- FEMA flood zone
- X (unshaded)
- Chance of flooding over 30 yrs
- 0.0%
- Est. flood insurance / yr
- $473 – $860
Fire risk 1/10 · Minimal
- Est. fire insurance / yr
- $963 – $1,789
Heat risk 5/10 · Moderate
- Hot days now (above 104°F)
- 7 days/yr
- Hot days in 30 yrs
- 18 days/yr
Wind risk 5/10 · Moderate
- Chance of severe wind over 30 yrs
- 26.0%
Air-quality risk 4/10 · Minor
- Unhealthy air days now
- 4 days/yr
- Unhealthy air days in 30 yrs
- 6 days/yr
Risk factors via First Street. Map © Google.
Why this score? — see what drove the B grade
The composite is a weighted blend of 9 inputs, each scored 0–100. Each bar is that input's sub-score; the figure is the points it added to the 100-point composite (weight × sub-score).
- Cash flow +30.0/30.0
- 1% rule +10.0/10.0
- DSCR +10.0/10.0
- ARV discount +7.5/15.0
- Livability +4.2/5.0
- Rent growth +3.2/5.0
- Schools +2.7/10.0
- Condition / age +2.5/5.0
- Appreciation +0.0/10.0
$84,900
🖨 Deal sheet 📄 Offer letter ✓ Due diligence
Listing remarks MLS
Traditional style home with partial basement! Includes endless possibilities with spacious lot. This single-family home is nestled in a vibrant and welcoming neighborhood, offering the perfect blend of city convenience and suburban charm. Easy access to shops, restaurants, and major highways for commuting. Convenient to downtown and the airport. Bring your builder or contractor and discover the amazing potential. Schedule a viewing today and make this gem your own!
Key facts
- Spacious lot
- Vibrant neighborhood
- Easy access to shops
Tags
Neighborhood map
What this means for you Summary
Snapshot
- This is a 3-bed/2.0-bath single-family listed at $85k.
Deal economics
- At list price, monthly cash flow is $1k ($14k/yr) — positive.
- The deal already cash-flows at list — no discount required.
- Meets the 1% rule at list price ($2k rent vs $85k).
- Recommended offer: $75k (12.0% below list) — sets the bar for market timing.
- Cap rate 22.3% vs local median 3.1% in Atlanta — top-decile yield for the area; either an underpriced asset or a hidden risk that comps aren't pricing in. Stress-test before assuming the spread holds.
Location & tenants
- Location reads 83/100 on livability (#6 in GA, #919 nationally) — a professional / high-income tenant draw. Strengths: amenities A+, commute A+, housing A+; Watch: schools C-, cost of living C-.
- Atlanta Public Schools (urban): math 28% / reading 35% proficiency, ranked #80 of 174 in GA (top 46%) — families likely to look elsewhere, expect single-tenant / working-renter base with shorter leases; 71% free/reduced lunch — lower-income household profile, screen leases tightly.
- Market conditions: Rents rising (+2.8%/yr); 452 active listings in the ZIP; 39 comparable units currently listed for rent nearby; rentals at typical pace (median 25d on market — plan ~3-4 weeks tenant-placement turnaround); 11,565 units permitted in Fulton County in 2024 (8,159 in 5+ unit buildings).
- At $2,176/mo this rent would consume 49% of the median local household income ($53k/yr) (locally 1676% of renters already pay >50% of income on rent) — very limited rent-growth headroom before tenants either downsize or default.
Forward outlook
- Local home prices are declining (-3.0%/yr); year-one equity from $587 of loan paydown is wiped out by about $3k of value loss. Plan a longer hold.
- Fulton County population projected at +38% by 2050 — long-run rental-demand tailwind backs the buy-and-hold thesis.
- At projected returns (-3.0% appreciation + 2.8% rent growth), your $24k cash investment doubles in ~2 years — after that, you're playing with house money.
Negotiation context
- It's been on market 195 days — a 12% lower offer ($75k) is reasonable based on typical stale-listing flexibility.
- 7 sale attempts since 17y ago; this cycle's ask has dropped $10k (11%) from the opening price — seller is motivated, your offer sets the floor, not the list.
- Current owner paid $6k; list at $85k implies a 1339% gain — meaningful room to come down on a strong offer.
Risks & watch-outs
- Watch-outs: built in 1940 — expect roof / HVAC / electrical / plumbing capex.
- Climate carrying-cost: moderate wind risk, 26% chance of damaging wind over 30y; extreme-heat days projected 7→18/yr by 2055 (HVAC capex compounding) — expect insurance premiums to compound above CPI over the hold.
Questions for the listing agent
- It's been on market 195 days. Have you received any prior offers? Is the seller open to a 12% concession, seller financing, or rate buy-down credit?
- Built in 1940 — when were the roof, HVAC, electrical panel, plumbing, and water heater last replaced?
- Why hasn't it sold? Are there any deal-killer items the seller is aware of (foundation, flood, title, zoning, code violations)?
- Is there a deadline driving the sale (1031 exchange, divorce, estate, relocation)? That informs how much negotiation room exists.
- What's the average days-on-market for RENTAL listings here right now (not sales)? A rising rental-DOM trend means longer vacancies and softer asking-rent achievability than the comps imply.
- What's the recent tenant-quality profile in this submarket — average credit score on applications, eviction rate, late-payment / NSF rate, and stable-employment percentage? A property-management company in the area should have these aggregated.
- How much new for-sale + rental construction is in the pipeline within 1–3 miles? Heavy new supply typically softens prices + rents 12–24 months out; constrained supply supports both.
Investment metrics
- 1% rule
- 2.56% ✓
- Cap rate
- 22.30%
- Cash-on-cash
- 57.16%
- DSCR
- 3.54
- GRM
- 3.3
CMA / ARV
- ARV (median comp)
- $329,789
- List price
- $84,900
- Delta
- -74.26%
- Verdict
- UNDERPRICED
- Comps
- 20 within 1.0 mi
Show comp detail 12 sales within ~0.75 mi
| Address | Dist | Beds/Ba | Sqft | Sold | Price | $/sf | Match |
|---|---|---|---|---|---|---|---|
| 992 Estes Dr SW | 0.07mi | 4/3.0 (+1) | 1,779 (-5%) | 7mo | $235,300 | $132 | 74 |
| 1005 Astor Ave SW | 0.30mi | 4/2.5 (+1) | 1,861 (-0%) | 6mo | $399,900 | $215 | 73 |
| 1783 Melrose Dr | 0.59mi | 3/2.0 | 1,802 (-4%) | 1mo | $420,000 | $233 | 65 |
| 1119 Victory Dr SW | 0.68mi | 3/2.5 | 1,880 (+0%) | 1mo | $398,500 | $212 | 65 |
| 1798 Evans Dr SW | 0.59mi | 3/2.0 | 1,806 (-4%) | 7mo | $387,500 | $215 | 61 |
| 1084 Regent St SW | 0.25mi | 3/2.0 | 1,640 (-12%) | 11mo | $329,000 | $201 | 59 |
| 1074 Astor Ave SW | 0.29mi | 3/3.0 | 1,600 (-14%) | 1mo | $369,900 | $231 | 58 |
| 1057 Regent St SW | 0.26mi | 3/2.5 | 1,602 (-14%) | 12mo | $329,900 | $206 | 52 |
| 1121 Birch St SW | 0.60mi | 3/2.5 | 2,016 (+8%) | 8mo | $430,000 | $213 | 50 |
| 2469 Jewel St | 0.72mi | 4/3.0 (+1) | 1,950 (+4%) | 1mo | $465,000 | $238 | 50 |
| 1791 Evans Dr SW | 0.60mi | 3/2.0 | 1,633 (-13%) | 3mo | $365,000 | $224 | 49 |
| 1111 Osborne St SW | 0.52mi | 3/2.0 | 1,600 (-14%) | 6mo | $205,000 | $128 | 46 |
Match score weights: distance 35% · size 25% · config 20% · recency 20%. Top-matched comps best support the ARV.
Projected returns pro-forma
-3.0% appreciation · 2.77% rent growth · sell at horizon
- IRR
- 55.4%
- Equity multiple
- 3.44×
- Total profit
- $57,898
- Equity at exit
- $12,659
- IRR
- 60.3%
- Equity multiple
- 6.95×
- Total profit
- $141,370
- Equity at exit
- $7,341
Cash invested: $23,772 (down + closing). Projections, not guarantees.
Landlord ↔ Tenant lean methodology
- Overall (STATE)
- 90 Strongly Landlord-Friendly
- State Georgia
- 90 Strongly Landlord-Friendly · R+3
- County
- — inherits STATE
- City
- — inherits STATE
ZIP-level market 30310
- Home prices YoY
- -32.8%
- Rents YoY
- 2.8%
- Active inventory
- 452
- Price-to-rent
- 3.3×
Monthly cashflow live
- Estimated rent
- $2,176 high interval (Pro) →
- Mortgage (P&I)
- −$445
- Tax est. 1.5%
- −$106 /mo · $1,274/yr
- Insurance
- −$35
- HOA
- −$0
- Vacancy / Maint / Mgmt
- −$457
- Net cashflow
- $1,132
Break-even live
UW: 25.0% down · 7.5% · 30yr · 1.5% tax · 5.0% vac · 8.0% maint · 8.0% mgmt
Financing live
Cash to close
- Down payment
- $21,225
- Closing costs
- $2,547
- Reserves months
- —
- Total cash needed
- —
Loan-product check · same deal, 3 products live
Conventional
25% down · 7.5% · 30yr
- Down + closing
- —
- Monthly P&I
- —
- Monthly cashflow
- —
- DSCR
- —
- Eligible?
- —
Personal DTI + credit; lowest rate.
DSCR
20% down · 8.5% · 30yr
- Down + closing
- —
- Monthly P&I
- —
- Monthly cashflow
- —
- DSCR
- —
- Eligible?
- —
No personal income docs; deal must DSCR.
Hard money
10% down · 12.0% · 12mo
- Down + closing
- —
- Monthly P&I
- —
- Monthly cashflow
- —
- DSCR
- —
- Eligible?
- —
Short-term bridge; refi at stabilization.
Rent comps 39 comps
| Address | Beds | Baths | Sqft | Rent | $/sqft | DOM | Units | Dist |
|---|---|---|---|---|---|---|---|---|
| 1060 Regent St SW Atlanta, GA | 3.0 | 2.0 | 1390 | $2,500 | $1.80 | 24d | 1 | 0.25mi |
| 2036 McPherson Dr Atlanta, GA | 2.0 | 1.0 | 1743 | $1,590 | $0.91 | 5d | 1 | 0.54mi |
| 1005 Birch St SW Atlanta, GA | 4.0 | 2.5 | 1740 | $3,000 | $1.72 | 18d | 1 | 0.60mi |
| 751 Yale Pl SW Atlanta, GA | 3.0 | 2.0 | 1230 | $1,499 | $1.22 | 24d | 1 | 0.62mi |
| 879 Sylvan Pl SW Atlanta, GA | 3.0 | 2.0 | 1533 | $2,050 | $1.34 | 19d | 1 | 0.62mi |
| 1352 Elizabeth Ln Atlanta, GA | 3.0 | 2.0 | 1654 | $1,745 | $1.06 | 10d | 1 | 0.66mi |
| 1361 McClelland Ave Atlanta, GA | 3.0 | 1.0 | 1468 | $1,500 | $1.02 | 24d | 1 | 0.67mi |
| 2533 Sylvan Rd Atlanta, GA | 3.0 | 2.0 | 1692 | $1,995 | $1.18 | 24d | 1 | 0.79mi |
| 1790 Brewer Blvd SW Atlanta, GA | 3.0 | 2.0 | 1301 | $2,000 | $1.54 | 22d | 1 | 0.80mi |
| 2000 Rambling Ln Atlanta, GA | 1.0–3.0 | 1.0–2.0 | 1082 | $1,514 | $1.40 | 1d | 8 | 0.90mi |
| 2340 Newnan St Atlanta, GA | 4.0 | 2.0 | 1598 | $775 | $0.48 | 44d | 1 | 0.92mi |
| 1029 Katherwood Dr SW Atlanta, GA | 3.0 | 2.0 | 1870 | $2,350 | $1.26 | 8d | 1 | 0.94mi |
| 2626 Blount St Atlanta, GA | 2.0 | 1.0 | 1314 | $1,460 | $1.11 | 24d | 1 | 0.94mi |
| 2636 Acadia St Atlanta, GA | 3.0 | 2.0 | 1300 | $1,800 | $1.38 | 24d | 1 | 0.96mi |
| 1369 Bryan Ave Atlanta, GA | 2.0 | 2.5 | 2000 | $3,250 | $1.62 | 44d | 1 | 0.97mi |
| 1455 Bryan Ave Unit B Atlanta, GA | 2.0 | 1.0 | 1482 | $1,300 | $0.88 | 24d | 1 | 1.06mi |
| 1344 Winburn Dr Atlanta, GA | 3.0 | 2.0 | 1388 | $2,100 | $1.51 | 24d | 1 | 1.12mi |
| 486 Pegg Rd SW Atlanta, GA | 4.0 | 1.5 | 1750 | $2,000 | $1.14 | 24d | 1 | 1.13mi |
| 1513 Melrose Dr SW Atlanta, GA | 3.0 | 2.0 | 1544 | $2,200 | $1.42 | 17d | 1 | 1.14mi |
| 2710 Winburn Ter Atlanta, GA | 3.0 | 2.0 | 1500 | $1,800 | $1.20 | 44d | 1 | 1.16mi |
| 1645 Metropolitan Pkwy SW Unit A Atlanta, GA | 3.0 | 1.0 | 1433 | $1,795 | $1.25 | 24d | 1 | 1.19mi |
| 1220 Hawthorne Trl East Point, GA | 3.0 | 2.5 | 1886 | $2,250 | $1.19 | 44d | 1 | 1.31mi |
| 2019 Pryor Rd SW Atlanta, GA | 2.0 | 2.5 | 1449 | $2,600 | $1.79 | 24d | 1 | 1.32mi |
| 309 Pickfair Way SW Atlanta, GA | 3.0 | 2.5 | 1824 | $2,423 | $1.33 | 24d | 1 | 1.37mi |
| 969 Arden Ave SW Atlanta, GA | 4.0 | 2.0 | 1380 | $1,850 | $1.34 | 24d | 1 | 1.40mi |
| 1006 Bayrose Cir Atlanta, GA | 2.0 | 2.5 | 1326 | $2,650 | $2.00 | 18d | 1 | 1.40mi |
| 1449 Beatie Ave SW Atlanta, GA | 3.0 | 2.0 | 1628 | $2,481 | $1.52 | 22d | 1 | 1.41mi |
| 9051 Bayrose Cir East Point, GA | 3.0 | 3.5 | 1620 | $2,300 | $1.42 | 44d | 1 | 1.42mi |
| 1412 Allene Ave SW Atlanta, GA | 3.0 | 2.0 | 1705 | $2,500 | $1.47 | 24d | 1 | 1.44mi |
| 6035 Bayrose Cir East Point, GA | 3.0 | 3.5 | 2100 | $2,500 | $1.19 | 24d | 1 | 1.44mi |
| 6035 Bayrose Cir East Point, GA | 3.0 | 3.5 | 2100 | $2,500 | $1.19 | 44d | 1 | 1.44mi |
| 1255 Campbellton Rd SW Atlanta, GA | 3.0 | 2.0 | 1305 | $2,095 | $1.61 | 24d | 1 | 1.44mi |
| 1932 Stanton Rd East Point, GA | 1.0–3.0 | 1.0–2.0 | 1045 | $1,599 | $1.53 | 44d | 1 | 1.45mi |
| 1010 Dill Ave SW Atlanta, GA | 4.0 | 3.0 | 2236 | $2,850 | $1.27 | 24d | 1 | 1.45mi |
| 3006 Bayrose Cir Unit 104B Atlanta, GA | 3.0 | 3.0 | 1564 | $2,300 | $1.47 | 44d | 1 | 1.49mi |
| 3004 Bayrose Cir Unit 102B Atlanta, GA | 3.0 | 3.0 | 1564 | $2,250 | $1.44 | 5d | 1 | 1.50mi |
| 3004 Bayrose Cir East Point, GA | 3.0 | 3.0 | 1564 | $2,350 | $1.50 | 44d | 1 | 1.50mi |
| 1443 Metropolitan Pkwy SW Atlanta, GA | 3.0 | 2.0 | 1518 | $2,200 | $1.45 | 24d | 1 | 1.50mi |
| 1493 Ashley Way Atlanta, GA | 3.0 | 2.5 | 1646 | $1,900 | $1.15 | 44d | 1 | 1.50mi |
Listing history 33 events
-
2026-06-18days on market $84,900 Active 195 DOM
-
2026-06-17days on market $84,900 Active 194 DOM
-
2026-06-16days on market $84,900 Active 193 DOM
-
2026-06-15days on market $84,900 Active 192 DOM
-
2026-06-13days on market $84,900 Active 190 DOM
-
2026-06-13days on market $84,900 Active 189 DOM
-
2026-06-09days on market $84,900 Active 186 DOM
-
2026-06-08days on market $84,900 Active 185 DOM
-
2026-06-07days on market $84,900 Active 184 DOM
-
2026-06-04days on market $84,900 Active 181 DOM
-
2026-06-03days on market $84,900 Active 180 DOM
-
2026-06-02days on market $84,900 Active 179 DOM
-
2026-06-01days on market $84,900 Active 178 DOM
-
2026-05-31days on market $84,900 Active 177 DOM
-
2026-02-24price $84,900 469-char remark
Show marketing remark (469 chars)
Traditional style home with partial basement! Includes endless possibilities with spacious lot. This single-family home is nestled in a vibrant and welcoming neighborhood, offering the perfect blend of city convenience and suburban charm. Easy access to shops, restaurants, and major highways for commuting. Convenient to downtown and the airport. Bring your builder or contractor and discover the amazing potential. Schedule a viewing today and make this gem your own!
-
2025-12-03$94,900 New 469-char remark
Show marketing remark (469 chars)
Traditional style home with partial basement! Includes endless possibilities with spacious lot. This single-family home is nestled in a vibrant and welcoming neighborhood, offering the perfect blend of city convenience and suburban charm. Easy access to shops, restaurants, and major highways for commuting. Convenient to downtown and the airport. Bring your builder or contractor and discover the amazing potential. Schedule a viewing today and make this gem your own!
-
2025-12-03$94,900 Active 469-char remark
Show marketing remark (469 chars)
Traditional style home with partial basement! Includes endless possibilities with spacious lot. This single-family home is nestled in a vibrant and welcoming neighborhood, offering the perfect blend of city convenience and suburban charm. Easy access to shops, restaurants, and major highways for commuting. Convenient to downtown and the airport. Bring your builder or contractor and discover the amazing potential. Schedule a viewing today and make this gem your own!
-
2018-10-26historical
-
2018-10-11price $87,000
-
2018-07-27$92,000 New
-
2018-06-01historical
-
2018-06-01historical
-
2018-01-12$90,100 Active
-
2018-01-12$90,100 New
-
2012-11-30historical
-
2012-10-24price $16,000
-
2012-10-19price $20,000 Reduced
-
2012-10-04$25,000 New
-
2009-10-23soldstatus $5,900
-
2009-07-24$5,900
-
2001-10-11soldstatus $70,000
-
2000-05-18soldstatus $50,000
ⓘ Source: listings_history table (triggers on properties + properties_extension) + one-shot
backfill from property_details.listing_events for pre-trigger history.
Climate risk First Street
- Flood 1/10 Low FEMA zone X (unshaded) · 0% chance over 30 yrs
- Wildfire 1/10 Low
- Heat 5/10 Major 7 d/yr ≥104°F today · 18 d/yr by 30 yrs out
- Wind 5/10 Major 26% chance of damaging wind over 30 yrs
- Air quality 4/10 Moderate 4 unhealthy d/yr today · 6 by 30 yrs out
Nearby sold comps map
Loading sold comps map…
Walkable amenities ~0.75 mi
Loading nearby amenities…
Taxation est. · year 1
- Rental income
- $26,114
- − Mortgage interest
- −$4,756
- − Property taxes
- −$1,274
- − Insurance
- −$424
- − Repairs & maintenance
- −$2,089
- − Management
- −$2,089
- − Depreciation
- −$2,470
- Taxable income
- $13,012
- Est. tax owed @ 24.0%
- −$3,123
- After-tax cash flow
- $10,466/yr
For passive investors: Depreciation is non-cash, so a rental often shows a tax loss while cash-flowing — sheltering income. Rental losses are passive: they offset passive income freely, and up to $25,000/yr can offset ordinary (W-2) income if you actively participate and your MAGI is under $100k (phasing out to $0 by $150k); unused losses carry forward. On sale, claimed depreciation is recaptured at up to 25%, and gains may owe capital-gains tax (a 1031 exchange can defer both). Figures are a year-1 estimate at your 24.0% rate — not tax advice; consult a CPA.
Schools (NCES district)
- District
- Atlanta Public Schools
- NCES district ID
- 1300120
- Math proficiency
- 28% ▼ -6.00%
- Reading proficiency
- 35% ▼ -2.00%
- Median HH income
- $48,306
- Composite
- 27.27/100
- National rank
- #7006
- State rank
- #80 of 174 in GA
Livability — Atlanta
- Score
- 83/100
- State rank
- #6
- US rank
- #919
Category grades
Schools grade is shown separately in the Schools card above.
Census & demographics
- Census place
- Atlanta, GA
- County
- Fulton County · 1,094,430 people
- City population
- 629,525
- Metro
- Atlanta-Sandy Springs-Alpharetta, GA
- Population (ZIP)
- 27,186
- Household income
- $53,037
- Rent vs Own
- Severe rent burden
- 1676.0
Population outlook (Fulton County) Hauer SSP2
- Today (2025)
- 1,203,707 people
- By 2030
- 1,299,706 · +8.0%
- By 2040
- 1,488,256 · +23.6%
- By 2050
- 1,664,580 · +38.3%
- By 2075
- 2,036,072 · +69.2%
- By 2100
- 2,222,402 · +84.6%
Race, ethnicity, and origin ACS 2023
- Neighborhood character
- Predominantly Black (76%)
- Race & ethnicity
- Black 76% White 14% Two or more races 4% Hispanic / Latino 4% Asian 2%
- Common ancestry
- Lithuanian 1% Slovak 1% Serbian 0%
- Foreign-born
- 5% · Canada, South Korea, Vietnam
- Languages at home
- 92% English-only · Spanish 4% French/Haitian/Cajun 1% Other Indo-European 1%
Political lean MEDSL · Fulton
- 2024 margin
- Solid D (+44.9) · D 71.9% · R 27.0% · Other 1.1%
- 2008→2024 swing
- +9.8pp toward D · 2008: 35.0pp · 2024: 44.9pp
- All cycles
- 2024: D+44.9 2020: D+46.4 2016: D+42.1 2012: D+29.6 2008: D+35.0
Not yet ingested
- Civics
- —
Market trends
- HPI YoY
- ▼ -204.00%
- Current HPI
- 418.7297
- Rent YoY
- ▲ 2.77%
- Metro
- Atlanta-Sandy Springs-Alpharetta, GA
- State GDP YoY
- ▲ 2.66%
- F500 in state
- 28
Industry mix (Fortune 500 HQ in GA)
| Industry | F500 HQs | Revenue |
|---|---|---|
| Paper / Packaging | 2 | $29B |
|
||
| Retail | 1 | $160B |
|
||
| Transportation / Logistics | 1 | $91B |
|
||
| Airlines | 1 | $62B |
|
||
| Consumer Goods | 1 | $47B |
|
||
| Utilities | 1 | $25B |
|
||
Price history
+69.8% since first listed19 events — show timeline
- 2026-02-24 Price Changed $84,900 FMLS
- 2026-02-24 Price Changed $84,900 GAMLS
- 2025-12-03 Listed $94,900 FMLS
- 2025-12-03 Listed $94,900 GAMLS
- 2018-10-26 Listing Removed — GAMLS
- 2018-10-11 Price Changed $87,000 GAMLS
- 2018-07-27 Listed $92,000 GAMLS
- 2018-06-01 Listing Removed — GAMLS
- 2018-06-01 Listing Removed — FMLS
- 2018-01-12 Listed $90,100 GAMLS
- 2018-01-12 Listed $90,100 FMLS
- 2012-11-30 Listing Removed — GAMLS
- 2012-10-24 Price Changed $16,000 GAMLS
- 2012-10-19 Price Changed $20,000 GAMLS
- 2012-10-04 Listed $25,000 GAMLS
- 2009-10-23 Sold (MLS) $5,900 FMLS
- 2009-07-24 Listed $5,900 FMLS
- 2001-10-11 Sold (Public Records) $70,000 Public Records
- 2000-05-18 Sold (Public Records) $50,000 Public Records
Property tax history
+4.0%/yrLatest (2025): $4,741 · -26.6% YoY. Source: county tax records.
Cash-flow waterfall
monthlySold comps — $/sqft
last 12 mo · ≤1 miLoading sold comps…