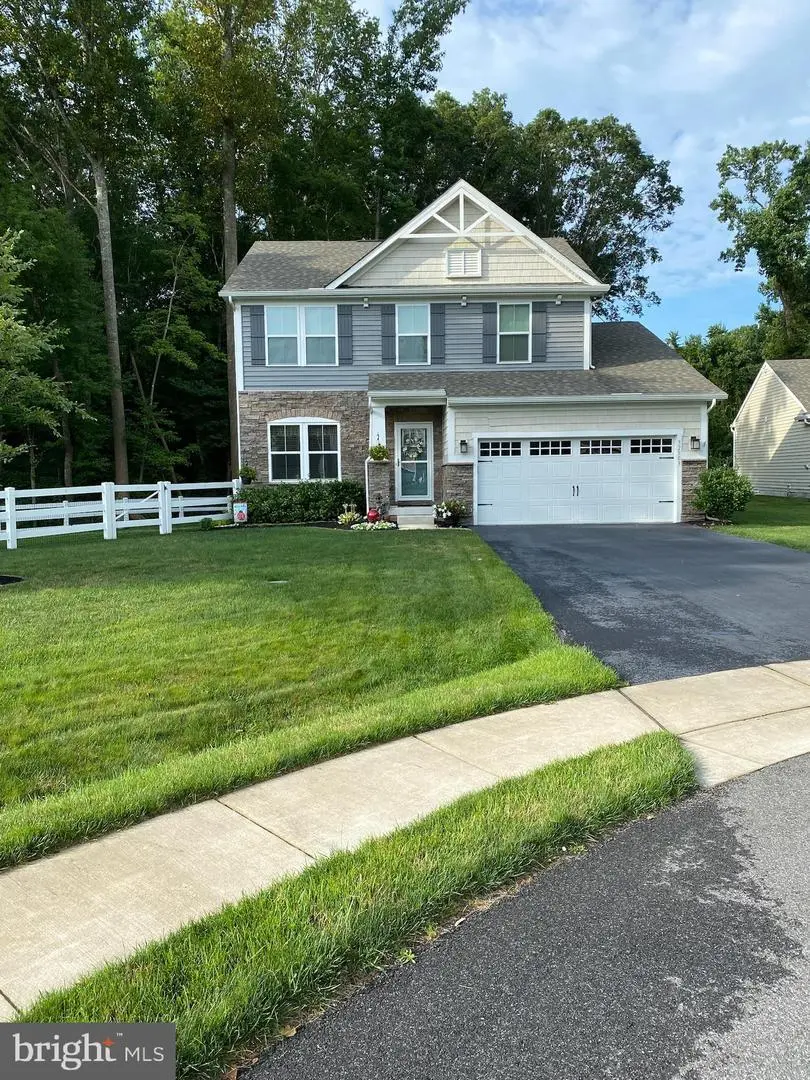
32503 W Haven Wood Dr · Frankford, DE
Flood risk 1/10 · Minimal
- FEMA flood zone
- X (unshaded)
- Chance of flooding over 30 yrs
- 0.0%
- Est. flood insurance / yr
- $473 – $860
Fire risk 3/10 · Minor
- Est. fire insurance / yr
- $476 – $884
Heat risk 8/10 · Major
- Hot days now (above 102°F)
- 7 days/yr
- Hot days in 30 yrs
- 17 days/yr
Wind risk 8/10 · Major
- Chance of severe wind over 30 yrs
- 80.0%
Air-quality risk 2/10 · Minimal
- Unhealthy air days now
- 0 days/yr
- Unhealthy air days in 30 yrs
- 1 days/yr
Risk factors via First Street. Map © Google.
Why this score? — see what drove the F grade
The composite is a weighted blend of 9 inputs, each scored 0–100. Each bar is that input's sub-score; the figure is the points it added to the 100-point composite (weight × sub-score).
- Appreciation +10.0/10.0
- ARV discount +9.4/15.0
- Livability +3.2/5.0
- Schools +2.9/10.0
- Rent growth +2.5/5.0
- Condition / age +2.5/5.0
- Cash flow +0.6/30.0
- 1% rule +0.0/10.0
- DSCR +0.0/10.0
$565,000
🖨 Deal sheet (PDF) 📄 Offer letter ✓ Due diligence
Listing remarks MLS
Spacious 4-bedroom, 2½-bath home tucked on a wooded cul-de-sac, offering the largest floor plan on a premium lot at exceptional value. The first floor features luxury vinyl plank flooring and hardwood stairs leading to the bedrooms, while the great room centers around a cozy gas/propane fireplace. Enjoy morning coffee or evening relaxation in the enclosed patio, and take advantage of a large, fully fenced yard with a generous shed for storage and privacy. Additional conveniences include a central vacuum system and whole-house water purifier, and the community offers two pools with a very low HOA fee.
Key facts
- 8,712 sq ft lot
- 2 garage spots
- Community pool
Neighborhood map
What this means for you Summary
Snapshot
- This is a 4-bed/3.0-bath single-family listed at $565k.
Deal economics
- At list price, monthly cash flow is $-2k ($-29k/yr) — negative.
- To cash-flow at today's rent, offer at most $214k (62.1% below list).
- To meet the 1% rule (rent ≥ 1% of price), the offer needs to be $200k (64.7% below list).
- Recommended offer: $200k (64.7% below list) — sets the bar for 1% rule.
- Cap rate 1.1% vs local median 1.9% in Frankford — below-typical yield; the buyer is paying a premium for something (appreciation thesis, condition, location) that the cap rate doesn't capture.
Location & tenants
- Location reads 63/100 on livability (#58 in DE) — a middle-class / working-renter tenant base. Strengths: crime A+, cost of living A+, housing A; Watch: employment C-, amenities F, commute F.
- Indian River School District (rural): math 25% / reading 41% proficiency, ranked #14 of 26 in DE (top 54%) — families likely to look elsewhere, expect single-tenant / working-renter base with shorter leases.
- Zoned schools: Showell (Phillip C.) Elementary School (math 27% / reading 37%, grade F, #44 of 105 statewide, top 46%, 279 students, 0% FRL); Selbyville Middle School (math 20% / reading 49%, grade F, #12 of 36 statewide, top 34%, 719 students, 0% FRL); Indian River High School (math 32% / reading 52%, grade F, #10 of 40 statewide, top 26%, 1,088 students, 0% FRL) — zoned schools average 0% FRL vs 49% district-wide (49 pts lower); this property's tenant base skews higher-income than the district average.
- Market conditions: 285 active listings in the ZIP; 1 comparable units currently listed for rent nearby; 4,354 units permitted in Sussex County in 2024 (344 in 5+ unit buildings).
Forward outlook
- In year one you build about $60k of equity ($4k loan paydown + $56k appreciation (10.0% local appreciation)).
- Sussex County population projected at +25% by 2050 — long-run rental-demand tailwind backs the buy-and-hold thesis.
- By year 2, paydown + projected appreciation supports a ~$97k cash-out refi (75% LTV) — recoverable capital for the next deal without selling this one.
Negotiation context
- It's been on market 74 days — a 6% lower offer ($531k) is reasonable based on typical stale-listing flexibility.
- 3 sale attempts since 9y ago with the ask held roughly flat each time — persistent listings suggest the price (not the market) is what's stuck; bring a comps-based counter.
Risks & watch-outs
- Climate carrying-cost: severe wind risk, 80% chance of damaging wind over 30y; extreme-heat days projected 7→17/yr by 2055 (HVAC capex compounding) — expect insurance premiums to compound above CPI over the hold.
Questions for the listing agent
- What do current leases actually rent for vs. the listed asking? Can we see a recent rent roll and the last 12 months of T-12 income?
- It's been on market 74 days. Have you received any prior offers? Is the seller open to a 65% concession, seller financing, or rate buy-down credit?
- What does the HOA fee cover, when was the last increase, and are there any pending special assessments or reserve-fund shortfalls?
- Why hasn't it sold? Are there any deal-killer items the seller is aware of (foundation, flood, title, zoning, code violations)?
- Is there a deadline driving the sale (1031 exchange, divorce, estate, relocation)? That informs how much negotiation room exists.
- Schools are F-rated, which usually means shorter tenancies and higher turnover. Who's the typical renter profile here, and what's been the actual vacancy rate?
- The area grade is low — what's the realistic commute time and amenity access for the typical tenant pool here? Any planned neighborhood developments (good or bad) we should know about?
- What's the average days-on-market for RENTAL listings here right now (not sales)? A rising rental-DOM trend means longer vacancies and softer asking-rent achievability than the comps imply.
- What's the recent tenant-quality profile in this submarket — average credit score on applications, eviction rate, late-payment / NSF rate, and stable-employment percentage? A property-management company in the area should have these aggregated.
- How much new for-sale + rental construction is in the pipeline within 1–3 miles? Heavy new supply typically softens prices + rents 12–24 months out; constrained supply supports both.
Investment metrics
- 1% rule
- 0.35% ✗
- Cap rate
- 1.14%
- Cash-on-cash
- -18.39%
- DSCR
- 0.18
- GRM
- 23.6
CMA / ARV
- ARV (median comp)
- $589,737
- List price
- $565,000
- Delta
- -4.19%
- Verdict
- FAIR
- Comps
- 20 within 1.0 mi
Show comp detail 3 sales within ~0.75 mi
| Address | Dist | Beds/Ba | Sqft | Sold | Price | $/sf | Match |
|---|---|---|---|---|---|---|---|
| 24118 Heartleaf Rd | 0.62mi | 3/2.0 (-1) | 1,152 (-2%) | 24mo | $194,000 | $168 | 39 |
| 37132 E White Tail Dr | 0.69mi | 3/2.0 (-1) | 1,202 (+3%) | 20mo | $305,000 | $254 | 38 |
| 33855 Palomino | 0.73mi | 3/2.0 (-1) | 1,344 (+15%) | 21mo | $306,000 | $228 | 15 |
Match score weights: distance 35% · size 25% · config 20% · recency 20%. Top-matched comps best support the ARV.
Projected returns pro-forma
10.0% appreciation · 3.0% rent growth · sell at horizon
- IRR
- 11.6%
- Equity multiple
- 1.97×
- Total profit
- $153,383
- Equity at exit
- $508,997
- IRR
- 12.4%
- Equity multiple
- 4.62×
- Total profit
- $573,300
- Equity at exit
- $1,097,671
Cash invested: $158,200 (down + closing). Projections, not guarantees.
Landlord ↔ Tenant lean methodology
- Overall (STATE)
- 70 Landlord-Friendly
- State Delaware
- 70 Landlord-Friendly · D+7
- County
- — inherits STATE
- City
- — inherits STATE
ZIP-level market 19945
- Home prices YoY
- 16.9%
- Active inventory
- 285
- Price-to-rent
- 23.6×
Monthly cashflow live
- Estimated rent
- $1,995 medium interval (Pro) →
- Mortgage (P&I)
- −$2,963
- Tax est. 1.5%
- −$706 /mo · $8,475/yr
- Insurance
- −$235
- HOA
- −$96
- Vacancy / Maint / Mgmt
- −$419
- Net cashflow
- $-2,425
Break-even live
Sensitivity live
| Price | -10% $-2,034 | -5% $-2,229 | +0% $-2,425 | +5% $-2,620 | +10% $-2,815 |
|---|---|---|---|---|---|
| Rent | -10% $-2,582 | -5% $-2,503 | +0% $-2,425 | +5% $-2,346 | +10% $-2,267 |
| Rate | -1.0pp $-2,140 | -0.5pp $-2,281 | base $-2,425 | +0.5pp $-2,571 | +1.0pp $-2,720 |
UW: 25.0% down · 7.5% · 30yr · 1.5% tax · 5.0% vac · 8.0% maint · 8.0% mgmt
Financing live
Cash to close
- Down payment
- $141,250
- Closing costs
- $16,950
- Reserves months
- —
- Total cash needed
- —
Loan-product check · same deal, 3 products live
Conventional
25% down · 7.5% · 30yr
- Down + closing
- —
- Monthly P&I
- —
- Monthly cashflow
- —
- DSCR
- —
- Eligible?
- —
Personal DTI + credit; lowest rate.
DSCR
20% down · 8.5% · 30yr
- Down + closing
- —
- Monthly P&I
- —
- Monthly cashflow
- —
- DSCR
- —
- Eligible?
- —
No personal income docs; deal must DSCR.
Hard money
10% down · 12.0% · 12mo
- Down + closing
- —
- Monthly P&I
- —
- Monthly cashflow
- —
- DSCR
- —
- Eligible?
- —
Short-term bridge; refi at stabilization.
Rent comps 1 comps
| Address | Beds | Baths | Sqft | Rent | $/sqft | DOM | Units | Dist |
|---|---|---|---|---|---|---|---|---|
| 25100 Ashton Cir Frankford, DE | 1.0–3.0 | 1.0–2.0 | 1054 | $1,995 | $1.89 | 15d | 1 | 0.55mi |
HOA detail
- Monthly dues
- $96 · $1,152/yr
- Likely covers
- watergaspool
Listing history 22 events
-
2026-06-21days on market $565,000 Active 74 DOM
-
2026-06-18days on market $565,000 Active 71 DOM
-
2026-06-17days on market $565,000 Active 70 DOM
-
2026-06-16days on market $565,000 Active 69 DOM
-
2026-06-15days on market $565,000 Active 68 DOM
-
2026-06-14days on market $565,000 Active 66 DOM
-
2026-06-13days on market $565,000 Active 65 DOM
-
2026-06-10days on market $565,000 Active 63 DOM
-
2026-06-09days on market $565,000 Active 62 DOM
-
2026-06-08days on market $565,000 Active 61 DOM
-
2026-06-07days on market $565,000 Active 60 DOM
-
2026-06-02days on market $565,000 Active 55 DOM
-
2026-06-01days on market $565,000 Active 54 DOM
-
2026-05-31days on market $565,000 Active 53 DOM
-
2026-05-30days on market $565,000 Active 52 DOM
-
2026-04-08$572,500 Active 614-char remark
Show marketing remark (614 chars)
Spacious 4-bedroom, 2½-bath home tucked on a wooded cul-de-sac, offering the largest floor plan on a premium lot at exceptional value. The first floor features luxury vinyl plank flooring and hardwood stairs leading to the bedrooms, while the great room centers around a cozy gas/propane fireplace. Enjoy morning coffee or evening relaxation in the enclosed patio, and take advantage of a large, fully fenced yard with a generous shed for storage and privacy. Additional conveniences include a central vacuum system and whole-house water purifier, and the community offers two pools with a very low HOA fee.
-
2026-04-03historical $572,500 614-char remark
Show marketing remark (614 chars)
Spacious 4-bedroom, 2½-bath home tucked on a wooded cul-de-sac, offering the largest floor plan on a premium lot at exceptional value. The first floor features luxury vinyl plank flooring and hardwood stairs leading to the bedrooms, while the great room centers around a cozy gas/propane fireplace. Enjoy morning coffee or evening relaxation in the enclosed patio, and take advantage of a large, fully fenced yard with a generous shed for storage and privacy. Additional conveniences include a central vacuum system and whole-house water purifier, and the community offers two pools with a very low HOA fee.
-
2026-04-01historical
-
2026-01-11$599,900 Active
-
2025-12-30historical
-
2018-03-05historical
-
2017-12-04$269,990
ⓘ Source: listings_history table (triggers on properties + properties_extension) + one-shot
backfill from property_details.listing_events for pre-trigger history.
Climate risk First Street
- Flood 1/10 Low FEMA zone X (unshaded) · 0% chance over 30 yrs
- Wildfire 3/10 Moderate
- Heat 8/10 Severe 7 d/yr ≥102°F today · 17 d/yr by 30 yrs out
- Wind 8/10 Severe 80% chance of damaging wind over 30 yrs
- Air quality 2/10 Low 0 unhealthy d/yr today · 1 by 30 yrs out
Nearby sold comps map
Loading sold comps map…
Walkable amenities ~0.75 mi
Loading nearby amenities…
Taxation est. · year 1
- Rental income
- $23,940
- − Mortgage interest
- −$31,649
- − Property taxes
- −$8,475
- − Insurance
- −$2,825
- − Repairs & maintenance
- −$1,915
- − Management
- −$1,915
- − HOA
- −$1,152
- − Depreciation
- −$16,436
- Taxable loss
- −$40,428
- Est. tax savings @ 24.0%
- +$9,703
- After-tax cash flow
- $-19,392/yr
For passive investors: Depreciation is non-cash, so a rental often shows a tax loss while cash-flowing — sheltering income. Rental losses are passive: they offset passive income freely, and up to $25,000/yr can offset ordinary (W-2) income if you actively participate and your MAGI is under $100k (phasing out to $0 by $150k); unused losses carry forward. On sale, claimed depreciation is recaptured at up to 25%, and gains may owe capital-gains tax (a 1031 exchange can defer both). Figures are a year-1 estimate at your 24.0% rate — not tax advice; consult a CPA.
Schools (NCES district)
- District
- Indian River School District
- NCES district ID
- 1000680
- Math proficiency
- 25% ▼ -27.00%
- Reading proficiency
- 41% ▼ -17.00%
- Median HH income
- $53,838
- Composite
- 28.99/100
- National rank
- #6620
- State rank
- #14 of 26 in DE
Livability — Frankford
- Score
- 63/100
- State rank
- #58
- US rank
- #15562
Category grades
Schools grade is shown separately in the Schools card above.
Census & demographics
- Population (ZIP)
- 8,917
Population outlook (Sussex County) Hauer SSP2
- Today (2025)
- 248,853 people
- By 2030
- 264,464 · +6.3%
- By 2040
- 290,980 · +16.9%
- By 2050
- 311,259 · +25.1%
- By 2075
- 352,488 · +41.6%
- By 2100
- 367,406 · +47.6%
Race, ethnicity, and origin ACS 2023
- Neighborhood character
- Predominantly White (77%)
- Race & ethnicity
- White 77% Black 12% Hispanic / Latino 8% Two or more races 7%
- Hispanic origin (detail)
- Mexican 4%
- Common ancestry
- Romanian 3% Slovak 3% Lithuanian 1%
- Foreign-born
- 5% · Canada
- Languages at home
- 91% English-only · Spanish 8%
Political lean MEDSL · Sussex
- 2024 margin
- R (+11.0) · D 43.9% · R 54.9% · Other 1.2%
- 2008→2024 swing
- -2.4pp toward R · 2008: -8.6pp · 2024: -11.0pp
- All cycles
- 2024: R+11.0 2020: R+11.2 2016: R+22.0 2012: R+13.0 2008: R+8.6
Not yet ingested
- Civics
- —
Market trends
- HPI YoY
- ▲ 46.51%
- Current HPI
- 322.2407
- Rent YoY
- —
- Metro
- —
- State GDP YoY
- —
- F500 in state
- 0
Price history
+112.0% since first listed7 events — show timeline
- 2026-04-08 Listed $572,500 BRIGHT MLS
- 2026-04-03 Coming Soon $572,500 BRIGHT MLS
- 2026-04-01 Listing Removed — BRIGHT MLS
- 2026-01-11 Listed $599,900 BRIGHT MLS
- 2025-12-30 Coming Soon — BRIGHT MLS
- 2018-03-05 Listing Removed — BRIGHT MLS
- 2017-12-04 Listed $269,990 BRIGHT MLS
Property tax history
+27.7%/yrLatest (2025): $767 · -10.0% YoY. Source: county tax records.
Cash-flow waterfall
monthlySold comps — $/sqft
last 12 mo · ≤1 miLoading sold comps…