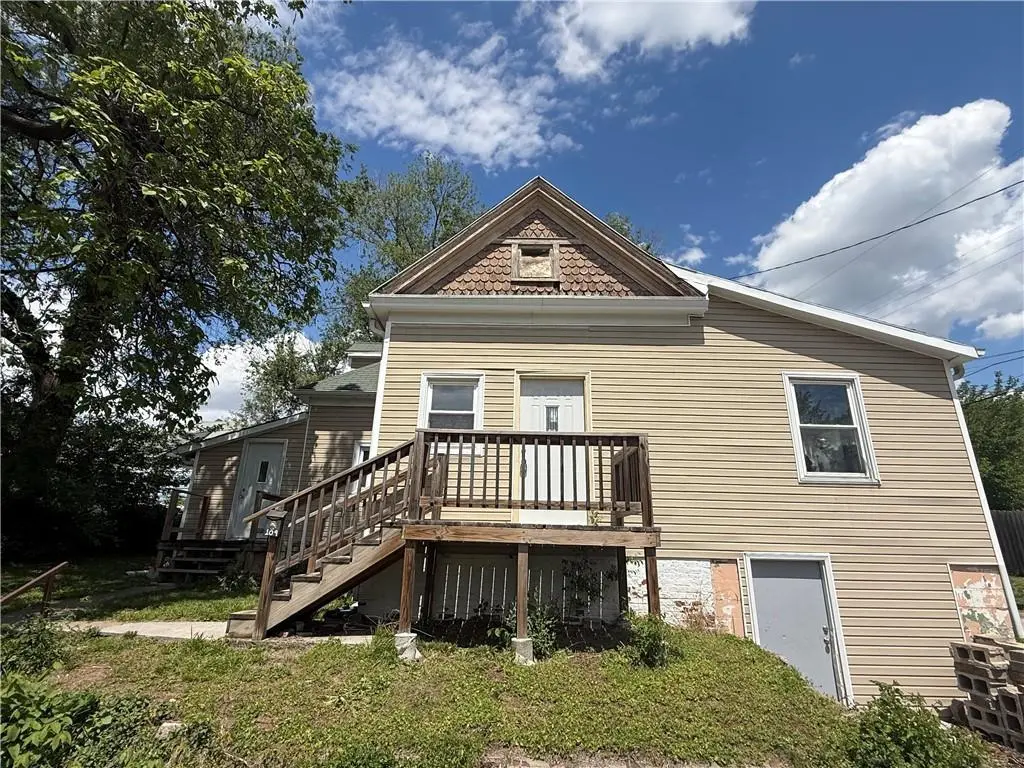
109 E Market St · St. Joseph, MO
Flood risk 1/10 · Minimal
- FEMA flood zone
- X
- Chance of flooding over 30 yrs
- 0.0%
- Est. flood insurance / yr
- $473 – $860
Fire risk 2/10 · Minimal
- Est. fire insurance / yr
- $1,054 – $1,958
Heat risk 4/10 · Minor
- Hot days now (above 107°F)
- 7 days/yr
- Hot days in 30 yrs
- 16 days/yr
Wind risk 2/10 · Minimal
- Chance of severe wind over 30 yrs
- —
Air-quality risk 2/10 · Minimal
- Unhealthy air days now
- 0 days/yr
- Unhealthy air days in 30 yrs
- 1 days/yr
Risk factors via First Street. Map © Google.
Why this score? — see what drove the B- grade
The composite is a weighted blend of 9 inputs, each scored 0–100. Each bar is that input's sub-score; the figure is the points it added to the 100-point composite (weight × sub-score).
- Cash flow +30.0/30.0
- 1% rule +10.0/10.0
- DSCR +10.0/10.0
- ARV discount +7.5/15.0
- Schools +2.8/10.0
- Rent growth +2.5/5.0
- Livability +2.5/5.0
- Condition / age +2.5/5.0
- Appreciation +0.0/10.0
$39,900
🖨 Deal sheet 📄 Offer letter ✓ Due diligence
Listing remarks
A RARE OPPORTUNITY FOR THIS SOLID HOME (HAS A GOOD EXTERIOR) TO BE BOUGHT At THIS GREAT PRICE-NEEDS FULL COSMETIC UPDATES/REPAIRS INSIDE. A REAL BARGAIN AT THIS PRICE AS THE AVERAGE MARKET VALUE IS AROUND $100K SO A GREAT OPPORTUNITY FOR SWEAT EQUITY FOR AN INVESTMENT PROPERTY OR SUPER CHEAP LIVING!
Key facts
- 2,614 sq ft lot
- Built 1902
- Listed 48 days
Property features AI
Finance
- HOA & community: No association fees
Exterior
- Parking: Other parking
- Utilities: Public water; Public sewer
- Home design: Single-family residence; Bungalow floor plan; Faces south
- Construction: Frame construction; Composition roof; Approximately 101+ years old
- Exterior features: Property not in a flood plain; Lot approximately 2,614 square feet
Interior
- Bedrooms: 3 bedrooms (two on the main level, one on the upper level)
- Bathrooms: 1 full bathroom
- Heating & cooling: Forced air heating; No central air
- Interior features: Eat-in kitchen; Unfinished basement
Neighborhood map
What this means for you Summary
Snapshot
- This is a 3-bed/1.0-bath single-family listed at $40k.
Deal economics
- At list price, monthly cash flow is $444 ($5k/yr) — positive.
- The deal already cash-flows at list — no discount required.
- Meets the 1% rule at list price ($886 rent vs $40k).
- Recommended offer: $39k (3.0% below list) — sets the bar for market timing.
- Cap rate 19.6% vs local median 4.7% in St. Joseph — top-decile yield for the area; either an underpriced asset or a hidden risk that comps aren't pricing in. Stress-test before assuming the spread holds.
Location & tenants
- Location reads: area grade B — affects rentability + tenant quality, not the cash-flow math above.
- St. Joseph (urban): math 28% / reading 38% proficiency, ranked #241 of 324 in MO (top 74%) — families likely to look elsewhere, expect single-tenant / working-renter base with shorter leases.
- Market conditions: 126 active listings in the ZIP; 4 comparable units currently listed for rent nearby; rentals lingering (median 44d on market — plan ~5-8 weeks vacancy on turnover, expect pricing pressure); 100% of comp listings sitting > 30 days — soft ceiling on asking rent; 70 units permitted in Buchanan County in 2024 (0 in 5+ unit buildings).
Forward outlook
- Local home prices are declining (-3.0%/yr); year-one equity from $276 of loan paydown is wiped out by about $1k of value loss. Plan a longer hold.
- Buchanan County population projected to shrink 6% by 2050 — rents likely to lag national; underwrite the cash flow, not the appreciation.
- At projected returns (-3.0% appreciation + 3.0% rent growth), your $11k cash investment doubles in ~3 years — after that, you're playing with house money.
Negotiation context
- It's been on market 49 days — a 3% lower offer ($39k) is reasonable based on typical stale-listing flexibility.
Risks & watch-outs
- Watch-outs: built in 1902 — expect roof / HVAC / electrical / plumbing capex.
Questions for the listing agent
- It's been on market 49 days. Have you received any prior offers? Is the seller open to a 3% concession, seller financing, or rate buy-down credit?
- Built in 1902 — when were the roof, HVAC, electrical panel, plumbing, and water heater last replaced?
- Is there a deadline driving the sale (1031 exchange, divorce, estate, relocation)? That informs how much negotiation room exists.
- What's the average days-on-market for RENTAL listings here right now (not sales)? A rising rental-DOM trend means longer vacancies and softer asking-rent achievability than the comps imply.
- What's the recent tenant-quality profile in this submarket — average credit score on applications, eviction rate, late-payment / NSF rate, and stable-employment percentage? A property-management company in the area should have these aggregated.
- How much new for-sale + rental construction is in the pipeline within 1–3 miles? Heavy new supply typically softens prices + rents 12–24 months out; constrained supply supports both.
Investment metrics
- 1% rule
- 2.22% ✓
- Cap rate
- 19.63%
- Cash-on-cash
- 47.65%
- DSCR
- 3.12
- GRM
- 3.8
CMA / ARV
- ARV (median comp)
- $84,777
- List price
- $39,900
- Delta
- -52.94%
- Verdict
- UNDERPRICED
- Comps
- 20 within 1.0 mi
Show comp detail 12 sales within ~0.75 mi
| Address | Dist | Beds/Ba | Sqft | Sold | Price | $/sf | Match |
|---|---|---|---|---|---|---|---|
| 1426 N 3rd St | 0.23mi | 3/1.0 | 972 (+2%) | 2mo | $115,000 | $118 | 84 |
| 2010 N 2nd St | 0.08mi | 2/1.0 (-1) | 1,000 (+5%) | 9mo | $99,000 | $99 | 75 |
| 1906 Main St | 0.04mi | 3/1.5 | 828 (-13%) | 1mo | $120,000 | $145 | 74 |
| 1414 N 3rd St | 0.26mi | 2/1.0 (-1) | 936 (-2%) | 13mo | $59,900 | $64 | 69 |
| 1618 Savannah Ave | 0.20mi | 2/1.0 (-1) | 1,064 (+12%) | 5mo | $74,000 | $70 | 61 |
| 1308 N 10th St | 0.61mi | 2/1.0 (-1) | 936 (-2%) | 7mo | $150,000 | $160 | 58 |
| 620 Powell St | 0.55mi | 2/1.0 (-1) | 1,000 (+5%) | 14mo | $85,000 | $85 | 50 |
| 1214 N 2nd St | 0.36mi | 2/1.0 (-1) | 1,064 (+12%) | 12mo | $5,000 | $5 | 48 |
| 2408 Saint Joseph Ave | 0.53mi | 2/1.0 (-1) | 884 (-7%) | 14mo | $125,000 | $141 | 47 |
| 2427 Saint Joseph Ave | 0.58mi | 2/1.5 (-1) | 1,080 (+13%) | 14mo | $89,900 | $83 | 32 |
| 502 Hamburg St | 0.55mi | 2/1.0 (-1) | 1,080 (+13%) | 19mo | $35,000 | $32 | 31 |
| 1445 N 11th St | 0.67mi | 2/2.0 (-1) | 824 (-13%) | 12mo | $79,900 | $97 | 28 |
Match score weights: distance 35% · size 25% · config 20% · recency 20%. Top-matched comps best support the ARV.
Projected returns pro-forma
-3.0% appreciation · 3.0% rent growth · sell at horizon
- IRR
- 45.1%
- Equity multiple
- 2.95×
- Total profit
- $21,790
- Equity at exit
- $5,949
- IRR
- 50.9%
- Equity multiple
- 5.96×
- Total profit
- $55,361
- Equity at exit
- $3,450
Cash invested: $11,172 (down + closing). Projections, not guarantees.
Landlord ↔ Tenant lean methodology
- Overall (STATE)
- 81 Strongly Landlord-Friendly
- State Missouri
- 81 Strongly Landlord-Friendly · R+10
- County
- — inherits STATE
- City
- — inherits STATE
ZIP-level market 64505
- Active inventory
- 126
- Price-to-rent
- 3.8×
Monthly cashflow live
- Estimated rent
- $886 medium interval (Pro) →
- Mortgage (P&I)
- −$209
- Tax from tax record
- −$31 /mo · $368/yr
- Insurance
- −$17
- HOA
- −$0
- Vacancy / Maint / Mgmt
- −$186
- Net cashflow
- $444
Break-even live
UW: 25.0% down · 7.5% · 30yr · 1.5% tax · 5.0% vac · 8.0% maint · 8.0% mgmt
Financing live
Cash to close
- Down payment
- $9,975
- Closing costs
- $1,197
- Reserves months
- —
- Total cash needed
- —
Loan-product check · same deal, 3 products live
Conventional
25% down · 7.5% · 30yr
- Down + closing
- —
- Monthly P&I
- —
- Monthly cashflow
- —
- DSCR
- —
- Eligible?
- —
Personal DTI + credit; lowest rate.
DSCR
20% down · 8.5% · 30yr
- Down + closing
- —
- Monthly P&I
- —
- Monthly cashflow
- —
- DSCR
- —
- Eligible?
- —
No personal income docs; deal must DSCR.
Hard money
10% down · 12.0% · 12mo
- Down + closing
- —
- Monthly P&I
- —
- Monthly cashflow
- —
- DSCR
- —
- Eligible?
- —
Short-term bridge; refi at stabilization.
Rent comps 4 comps
| Address | Beds | Baths | Sqft | Rent | $/sqft | DOM | Units | Dist |
|---|---|---|---|---|---|---|---|---|
| 1416 N 3rd St Unit 1418 St Joseph, MO | 2.0 | 1.0 | 750 | $850 | $1.13 | 43d | 1 | 0.25mi |
| 516 N 10th St Saint Joseph, MO | 1.0–2.0 | 1.0 | 700 | $900 | $1.29 | 43d | 1 | 0.90mi |
| 201 S 10th St Saint Joseph, MO | 2.0 | 1.0 | 600 | $1,000 | $1.67 | 43d | 1 | 1.23mi |
| 303 S 13th St St Joseph, MO | 3.0 | 1.5 | 1000 | $950 | $0.95 | 43d | 1 | 1.38mi |
Listing history 17 events
-
2026-06-19days on market $39,900 Active 49 DOM
-
2026-06-18days on market $39,900 Active 48 DOM
-
2026-06-17days on market $39,900 Active 47 DOM
-
2026-06-16days on market $39,900 Active 46 DOM
-
2026-06-15days on market $39,900 Active 45 DOM
-
2026-06-14days on market $39,900 Active 43 DOM
-
2026-06-12days on market $39,900 Active 42 DOM
-
2026-06-09days on market $39,900 Active 39 DOM
-
2026-06-08days on market $39,900 Active 38 DOM
-
2026-06-07days on market $39,900 Active 37 DOM
-
2026-06-03days on market $39,900 Active 33 DOM
-
2026-06-02days on market $39,900 Active 32 DOM
-
2026-06-01days on market $39,900 Active 31 DOM
-
2026-05-31days on market $39,900 Active 30 DOM
-
2026-05-30days on market $39,900 Active 29 DOM
-
2026-05-01$39,900 Active 300-char remark
-
1992-04-13soldstatus
ⓘ Source: listings_history table (triggers on properties + properties_extension) + one-shot
backfill from property_details.listing_events for pre-trigger history.
Tax reassessment forecast MO · Resets to sale price
- Current annual tax
- $368 · $31/mo
- Projected year-2 tax
- $387 · $32/mo
- Expected delta
- +$19/yr (+$2/mo · 5.3%)
ⓘ Screening estimate from a state-policy table — verify with the county assessor before closing.
Climate risk First Street
- Flood 1/10 Low FEMA zone X · 0% chance over 30 yrs
- Wildfire 2/10 Low
- Heat 4/10 Moderate 7 d/yr ≥107°F today · 16 d/yr by 30 yrs out
- Wind 2/10 Low
- Air quality 2/10 Low 0 unhealthy d/yr today · 1 by 30 yrs out
Nearby sold comps map
Loading sold comps map…
Walkable amenities ~0.75 mi
Loading nearby amenities…
Taxation est. · year 1
- Rental income
- $10,635
- − Mortgage interest
- −$2,235
- − Property taxes
- −$368
- − Insurance
- −$200
- − Repairs & maintenance
- −$851
- − Management
- −$851
- − Depreciation
- −$1,161
- Taxable income
- $4,970
- Est. tax owed @ 24.0%
- −$1,193
- After-tax cash flow
- $4,130/yr
For passive investors: Depreciation is non-cash, so a rental often shows a tax loss while cash-flowing — sheltering income. Rental losses are passive: they offset passive income freely, and up to $25,000/yr can offset ordinary (W-2) income if you actively participate and your MAGI is under $100k (phasing out to $0 by $150k); unused losses carry forward. On sale, claimed depreciation is recaptured at up to 25%, and gains may owe capital-gains tax (a 1031 exchange can defer both). Figures are a year-1 estimate at your 24.0% rate — not tax advice; consult a CPA.
Schools (NCES district)
- District
- St. Joseph
- NCES district ID
- 2927060
- Math proficiency
- 28% ▼ -6.00%
- Reading proficiency
- 38% ▼ -1.00%
- Median HH income
- $43,007
- Composite
- 27.99/100
- National rank
- #6853
- State rank
- #241 of 324 in MO
Livability — St. Joseph
No livability data for this city. (Only ~50 U.S. cities are tracked.)
Census & demographics
- Census place
- St. Joseph, MO
- City population
- 44,382
- Population (ZIP)
- 13,875
Population outlook (Buchanan County) Hauer SSP2
- Today (2025)
- 89,041 people
- By 2030
- 88,401 · -0.7%
- By 2040
- 86,220 · -3.2%
- By 2050
- 83,603 · -6.1%
- By 2075
- 76,750 · -13.8%
- By 2100
- 67,623 · -24.1%
Race, ethnicity, and origin ACS 2023
- Neighborhood character
- Predominantly White (81%)
- Race & ethnicity
- White 81% Hispanic / Latino 8% Two or more races 6% Black 3% Asian 3% Pacific Islander 1%
- Hispanic origin (detail)
- Mexican 6%
- Common ancestry
- Slovak 2% Lithuanian 2% Portuguese 1%
- Foreign-born
- 4% · Canada, China
- Languages at home
- 92% English-only · Spanish 5% Chinese 2% Other Asian/Pacific 1%
Political lean MEDSL · Buchanan
- 2024 margin
- Strong R (+28.0) · D 35.2% · R 63.3% · Other 1.5%
- 2008→2024 swing
- -28.2pp toward R · 2008: 0.1pp · 2024: -28.0pp
- All cycles
- 2024: R+28.0 2020: R+24.6 2016: R+26.2 2012: R+8.7 2008: D+0.1
Not yet ingested
- Civics
- —
Market trends
- HPI YoY
- ▼ -139.45%
- Current HPI
- 207.1403
- Rent YoY
- —
- Metro
- —
- State GDP YoY
- ▲ 1.84%
- F500 in state
- 20
Industry mix (Fortune 500 HQ in MO)
| Industry | F500 HQs | Revenue |
|---|---|---|
| Healthcare | 1 | $163B |
|
||
| Insurance | 1 | $21B |
|
||
| Industrial Technology | 1 | $17B |
|
||
| Retail | 1 | $16B |
|
||
| Industrial Distribution | 1 | $10B |
|
||
| Utilities | 1 | $9B |
|
||
Price history
2 events — show timeline
- 2026-05-01 Listed $39,900 Heartland MLS as Distributed by MLS Grid
- 1992-04-13 Sold (Public Records) — Public Records
Property tax history
+1.9%/yrLatest (2025): $368 · +11.5% YoY. Source: county tax records.
Cash-flow waterfall
monthlySold comps — $/sqft
last 12 mo · ≤1 miLoading sold comps…