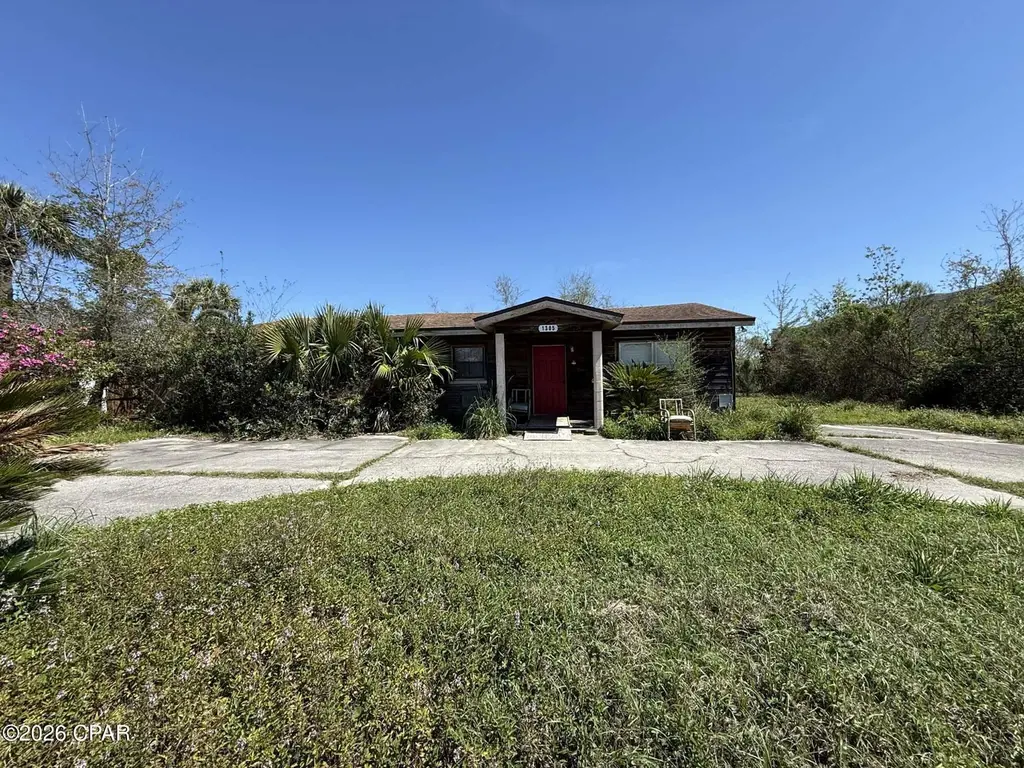
1305 Alabama Ave · Lynn Haven, FL
Flood risk 6/10 · Moderate
- FEMA flood zone
- X (unshaded)
- Chance of flooding over 30 yrs
- 0.7%
- Est. flood insurance / yr
- $507 – $1,088
Fire risk 1/10 · Minimal
- Est. fire insurance / yr
- $947 – $1,759
Heat risk 10/10 · Severe
- Hot days now (above 104°F)
- 7 days/yr
- Hot days in 30 yrs
- 21 days/yr
Wind risk 9/10 · Severe
- Chance of severe wind over 30 yrs
- 99.0%
Air-quality risk 1/10 · Minimal
- Unhealthy air days now
- 0 days/yr
- Unhealthy air days in 30 yrs
- 0 days/yr
Risk factors via First Street. Map © Google.
Why this score? — see what drove the C grade
The composite is a weighted blend of 9 inputs, each scored 0–100. Each bar is that input's sub-score; the figure is the points it added to the 100-point composite (weight × sub-score).
- Cash flow +18.7/30.0
- ARV discount +15.0/15.0
- DSCR +5.9/10.0
- 1% rule +4.7/10.0
- Schools +4.3/10.0
- Livability +4.0/5.0
- Rent growth +3.1/5.0
- Condition / age +2.5/5.0
- Appreciation +0.0/10.0
$159,000
🖨 Deal sheet 📄 Offer letter ✓ Due diligence
Listing remarks MLS
Investor Opportunity in the Highly Desired Lynn Haven Area! 2 bedroom, 1 bathroom home located in the sought-after city of Lynn Haven. This property offers excellent potential for investors, flippers, or buyers looking for their next renovation project. The home does have wood rot and will require repairs, making it ideal for cash buyers ready to bring new life to the property. Situated in a convenient location close to local shopping, dining, schools, and parks, this property has strong upside potential once renovated. Whether you're looking to flip, renovate and hold, or add to your rental portfolio, this property is full of possibilities. Property is being sold As-Is. Seller will make no repairs. Cash or renovation financing recommended. Don't miss the chance to invest in one of Bay County's most desirable areas!
Key facts
- Local schools
- Local shopping
- Local parks
Tags
Neighborhood map
What this means for you Summary
Snapshot
- This is a 2-bed/1.0-bath single-family listed at $159k.
Deal economics
- At list price, monthly cash flow is $156 ($2k/yr) — positive.
- The deal already cash-flows at list — no discount required.
- To meet the 1% rule (rent ≥ 1% of price), the offer needs to be $155k (2.7% below list).
- Recommended offer: $154k (3.0% below list) — sets the bar for market timing.
- Cap rate 7.5% vs local median 3.5% in Lynn Haven — top-decile yield for the area; either an underpriced asset or a hidden risk that comps aren't pricing in. Stress-test before assuming the spread holds.
Location & tenants
- Location reads 81/100 on livability (#96 in FL, #1,472 nationally) — a professional / high-income tenant draw. Strengths: crime A+, housing A+, health & safety A+; Watch: amenities D+, commute F.
- Bay (suburban): math 51% / reading 51% proficiency, ranked #29 of 73 in FL (top 40%) — acceptable for families but not a draw, mixed tenant base, ~2y average lease.
- Market conditions: Rents rising (+2.5%/yr); 196 active listings in the ZIP; 4 comparable units currently listed for rent nearby; rentals at typical pace (median 21d on market — plan ~3-4 weeks tenant-placement turnaround); solid renter incomes; 2,473 units permitted in Bay County in 2024 (559 in 5+ unit buildings).
Forward outlook
- Local home prices are declining (-3.0%/yr); year-one equity from $1k of loan paydown is wiped out by about $5k of value loss. Plan a longer hold.
- Bay County population projected at +24% by 2050 — long-run rental-demand tailwind backs the buy-and-hold thesis.
Negotiation context
- It's been on market 53 days — a 3% lower offer ($154k) is reasonable based on typical stale-listing flexibility.
- 2 sale attempts with the ask held roughly flat each time — persistent listings suggest the price (not the market) is what's stuck; bring a comps-based counter.
- Current owner paid $68k; list at $159k implies a 134% gain — meaningful room to come down on a strong offer.
Risks & watch-outs
- Climate carrying-cost: major flood risk; severe wind risk, 99% chance of damaging wind over 30y; extreme-heat days projected 7→21/yr by 2055 (HVAC capex compounding) — expect insurance premiums to compound above CPI over the hold.
Questions for the listing agent
- It's been on market 53 days. Have you received any prior offers? Is the seller open to a 3% concession, seller financing, or rate buy-down credit?
- Built in 1962 — when were the roof, HVAC, electrical panel, plumbing, and water heater last replaced?
- Is there a deadline driving the sale (1031 exchange, divorce, estate, relocation)? That informs how much negotiation room exists.
- Schools are B-rated — typically a magnet for longer-tenancy family renters. What's the average tenant stay here, and is there a school-zone premium baked into asking?
- What's the average days-on-market for RENTAL listings here right now (not sales)? A rising rental-DOM trend means longer vacancies and softer asking-rent achievability than the comps imply.
- What's the recent tenant-quality profile in this submarket — average credit score on applications, eviction rate, late-payment / NSF rate, and stable-employment percentage? A property-management company in the area should have these aggregated.
- How much new for-sale + rental construction is in the pipeline within 1–3 miles? Heavy new supply typically softens prices + rents 12–24 months out; constrained supply supports both.
Investment metrics
- 1% rule
- 0.97% ✗
- Cap rate
- 7.47%
- Cash-on-cash
- 4.20%
- DSCR
- 1.19
- GRM
- 8.6
CMA / ARV
- ARV (median comp)
- $234,414
- List price
- $159,000
- Delta
- -32.17%
- Verdict
- UNDERPRICED
- Comps
- 20 within 1.0 mi
Show comp detail 7 sales within ~0.75 mi
| Address | Dist | Beds/Ba | Sqft | Sold | Price | $/sf | Match |
|---|---|---|---|---|---|---|---|
| 1112 Indiana Ave | 0.49mi | 3/1.0 (+1) | 1,093 (-2%) | 11mo | $192,000 | $176 | 59 |
| 1402 Carolina Ave | 0.31mi | 3/1.0 (+1) | 1,020 (-9%) | 11mo | $195,000 | $191 | 56 |
| 716 New York Ave | 0.59mi | 3/1.0 (+1) | 1,080 (-3%) | 16mo | $159,900 | $148 | 48 |
| 703 Michigan Ave | 0.74mi | 2/2.0 | 1,203 (+8%) | 12mo | $140,000 | $116 | 39 |
| 808 Tennessee Ave | 0.53mi | 3/2.0 (+1) | 1,232 (+10%) | 13mo | $276,500 | $224 | 38 |
| 706 Alabama Ave | 0.60mi | 3/1.0 (+1) | 1,010 (-10%) | 19mo | $209,000 | $207 | 35 |
| 201 E 8th St | 0.63mi | 3/2.0 (+1) | 1,274 (+14%) | 15mo | $280,000 | $220 | 26 |
Match score weights: distance 35% · size 25% · config 20% · recency 20%. Top-matched comps best support the ARV.
Projected returns pro-forma
-3.0% appreciation · 2.52% rent growth · sell at horizon
- IRR
- -10.3%
- Equity multiple
- 0.63×
- Total profit
- $-16,582
- Equity at exit
- $23,707
- IRR
- -1.6%
- Equity multiple
- 0.90×
- Total profit
- $-4,671
- Equity at exit
- $13,747
Cash invested: $44,520 (down + closing). Projections, not guarantees.
Landlord ↔ Tenant lean methodology
- Overall (STATE)
- 87 Strongly Landlord-Friendly
- State Florida
- 87 Strongly Landlord-Friendly · R+3
- County
- — inherits STATE
- City
- — inherits STATE
ZIP-level market 32444
- Home prices YoY
- -29.1%
- Rents YoY
- 2.5%
- Active inventory
- 196
- Price-to-rent
- 8.6×
Monthly cashflow live
- Estimated rent
- $1,547 medium interval (Pro) →
- Mortgage (P&I)
- −$834
- Tax from tax record
- −$166 /mo · $1,995/yr
- Insurance
- −$66
- HOA
- −$0
- Vacancy / Maint / Mgmt
- −$325
- Net cashflow
- $156
Break-even live
UW: 25.0% down · 7.5% · 30yr · 1.5% tax · 5.0% vac · 8.0% maint · 8.0% mgmt
Financing live
Cash to close
- Down payment
- $39,750
- Closing costs
- $4,770
- Reserves months
- —
- Total cash needed
- —
Loan-product check · same deal, 3 products live
Conventional
25% down · 7.5% · 30yr
- Down + closing
- —
- Monthly P&I
- —
- Monthly cashflow
- —
- DSCR
- —
- Eligible?
- —
Personal DTI + credit; lowest rate.
DSCR
20% down · 8.5% · 30yr
- Down + closing
- —
- Monthly P&I
- —
- Monthly cashflow
- —
- DSCR
- —
- Eligible?
- —
No personal income docs; deal must DSCR.
Hard money
10% down · 12.0% · 12mo
- Down + closing
- —
- Monthly P&I
- —
- Monthly cashflow
- —
- DSCR
- —
- Eligible?
- —
Short-term bridge; refi at stabilization.
Rent comps 4 comps
| Address | Beds | Baths | Sqft | Rent | $/sqft | DOM | Units | Dist |
|---|---|---|---|---|---|---|---|---|
| 1409 Florida Ave Lynn Haven, FL | 2.0 | 1.0 | 800 | $1,276 | $1.59 | 21d | 1 | 0.26mi |
| 1307 Pennsylvania Ave Unit 1 Lynn Haven, FL | 3.0 | 1.0 | 1256 | $1,500 | $1.19 | 13d | 1 | 0.34mi |
| 1019 Bradford Cir Unit 1019 Lynn Haven, FL | 2.0 | 1.0 | 810 | $1,225 | $1.51 | 21d | 1 | 1.34mi |
| 1125 Bradley Cir Lynn Haven, FL | 3.0 | 2.0 | 1190 | $1,850 | $1.55 | 13d | 1 | 1.42mi |
Listing history 5 events
-
2026-05-14status Active 830-char remark
Show marketing remark (830 chars)
Investor Opportunity in the Highly Desired Lynn Haven Area! 2 bedroom, 1 bathroom home located in the sought-after city of Lynn Haven. This property offers excellent potential for investors, flippers, or buyers looking for their next renovation project. The home does have wood rot and will require repairs, making it ideal for cash buyers ready to bring new life to the property. Situated in a convenient location close to local shopping, dining, schools, and parks, this property has strong upside potential once renovated. Whether you're looking to flip, renovate and hold, or add to your rental portfolio, this property is full of possibilities. Property is being sold As-Is. Seller will make no repairs. Cash or renovation financing recommended. Don't miss the chance to invest in one of Bay County's most desirable areas!
-
2026-03-13$159,000 Active 830-char remark
Show marketing remark (830 chars)
Investor Opportunity in the Highly Desired Lynn Haven Area! 2 bedroom, 1 bathroom home located in the sought-after city of Lynn Haven. This property offers excellent potential for investors, flippers, or buyers looking for their next renovation project. The home does have wood rot and will require repairs, making it ideal for cash buyers ready to bring new life to the property. Situated in a convenient location close to local shopping, dining, schools, and parks, this property has strong upside potential once renovated. Whether you're looking to flip, renovate and hold, or add to your rental portfolio, this property is full of possibilities. Property is being sold As-Is. Seller will make no repairs. Cash or renovation financing recommended. Don't miss the chance to invest in one of Bay County's most desirable areas!
-
2001-07-31soldstatus $68,000
-
1992-04-01soldstatus $37,400
-
1988-11-01soldstatus $28,000
ⓘ Source: listings_history table (triggers on properties + properties_extension) + one-shot
backfill from property_details.listing_events for pre-trigger history.
Tax reassessment forecast FL · Resets to sale price
- Current annual tax
- $1,995 · $166/mo
- Projected year-2 tax
- $1,995 · $166/mo
- Expected delta
- $0/yr ($0/mo · -0.0%)
ⓘ Screening estimate from a state-policy table — verify with the county assessor before closing.
Climate risk First Street
- Flood 6/10 Major FEMA zone X (unshaded) · 70% chance over 30 yrs
- Wildfire 1/10 Low
- Heat 10/10 Extreme 7 d/yr ≥104°F today · 21 d/yr by 30 yrs out
- Wind 9/10 Extreme 99% chance of damaging wind over 30 yrs
- Air quality 1/10 Low 0 unhealthy d/yr today · 0 by 30 yrs out
Nearby sold comps map
Loading sold comps map…
Walkable amenities ~0.75 mi
Loading nearby amenities…
Taxation est. · year 1
- Rental income
- $18,563
- − Mortgage interest
- −$8,906
- − Property taxes
- −$1,995
- − Insurance
- −$795
- − Repairs & maintenance
- −$1,485
- − Management
- −$1,485
- − Depreciation
- −$4,625
- Taxable loss
- −$728
- Est. tax savings @ 24.0%
- +$175
- After-tax cash flow
- $2,044/yr
For passive investors: Depreciation is non-cash, so a rental often shows a tax loss while cash-flowing — sheltering income. Rental losses are passive: they offset passive income freely, and up to $25,000/yr can offset ordinary (W-2) income if you actively participate and your MAGI is under $100k (phasing out to $0 by $150k); unused losses carry forward. On sale, claimed depreciation is recaptured at up to 25%, and gains may owe capital-gains tax (a 1031 exchange can defer both). Figures are a year-1 estimate at your 24.0% rate — not tax advice; consult a CPA.
Schools (NCES district)
- District
- Bay
- NCES district ID
- 1200090
- Math proficiency
- 51% ▼ -8.00%
- Reading proficiency
- 51% ▼ -7.00%
- Median HH income
- $47,740
- Composite
- 43.41/100
- National rank
- #3014
- State rank
- #29 of 73 in FL
Livability — Lynn Haven
- Score
- 81/100
- State rank
- #96
- US rank
- #1472
Category grades
Schools grade is shown separately in the Schools card above.
Census & demographics
- Census place
- Lynn Haven, FL
- County
- Bay County · 163,593 people
- City population
- 21,459
- Metro
- Panama City, FL
- Population (ZIP)
- 21,459
- Household income
- $83,160
- Rent vs Own
- Severe rent burden
- 430.0
Population outlook (Bay County) Hauer SSP2
- Today (2025)
- 206,264 people
- By 2030
- 217,740 · +5.6%
- By 2040
- 238,738 · +15.7%
- By 2050
- 255,545 · +23.9%
- By 2075
- 288,295 · +39.8%
- By 2100
- 288,638 · +39.9%
Race, ethnicity, and origin ACS 2023
- Neighborhood character
- Predominantly White (75%)
- Race & ethnicity
- White 75% Two or more races 11% Hispanic / Latino 10% Black 6% Asian 3%
- Hispanic origin (detail)
- Mexican 2% Puerto Rican 2%
- Common ancestry
- Lithuanian 3% Romanian 3% Serbian 2%
- Foreign-born
- 10% · Canada, Vietnam, South Korea
- Languages at home
- 87% English-only · Spanish 8% Russian/Polish/Slavic 1% Other Indo-European 1%
Political lean MEDSL · Bay
- 2024 margin
- Solid R (+47.4) · D 25.8% · R 73.1% · Other 1.1%
- 2008→2024 swing
- -6.6pp toward R · 2008: -40.7pp · 2024: -47.4pp
- All cycles
- 2024: R+47.4 2020: R+43.5 2016: R+46.3 2012: R+43.6 2008: R+40.7
Not yet ingested
- Civics
- —
Market trends
- HPI YoY
- ▼ -108.08%
- Current HPI
- 263.5418
- Rent YoY
- ▲ 2.52%
- Metro
- Panama City, FL
- State GDP YoY
- ▲ 3.28%
- F500 in state
- 36
Industry mix (Fortune 500 HQ in FL)
| Industry | F500 HQs | Revenue |
|---|---|---|
| Industrial Technology | 2 | $29B |
|
||
| Insurance | 2 | $17B |
|
||
| Retail | 1 | $60B |
|
||
| Technology Distribution | 1 | $58B |
|
||
| Homebuilding | 1 | $35B |
|
||
| Technology Manufacturing | 1 | $35B |
|
||
Price history
+467.9% since first listed5 events — show timeline
- 2026-05-14 Relisted — CPARMLS
- 2026-03-13 Listed $159,000 CPARMLS
- 2001-07-31 Sold (Public Records) $68,000 Public Records
- 1992-04-01 Sold (Public Records) $37,400 Public Records
- 1988-11-01 Sold (Public Records) $28,000 Public Records
Property tax history
+5.4%/yrLatest (2025): $1,995 · +9.2% YoY. Source: county tax records.
Cash-flow waterfall
monthlySold comps — $/sqft
last 12 mo · ≤1 miLoading sold comps…