 Fourplex
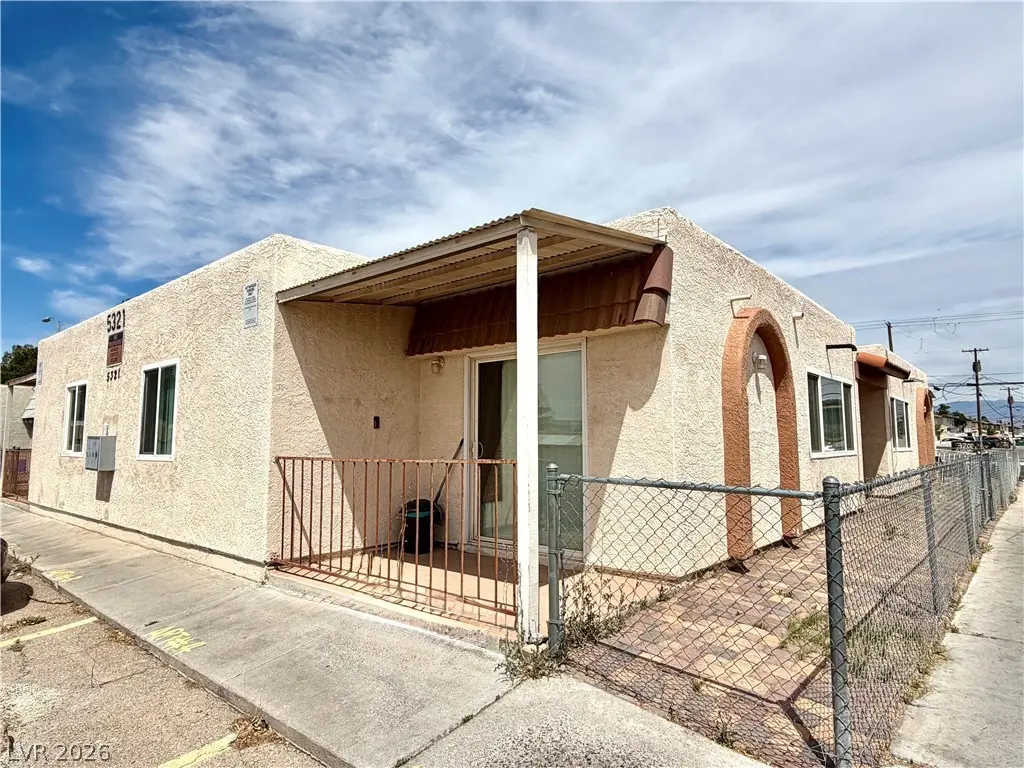
5321 W Cheyenne Ave · Las Vegas, NV
Flood risk 1/10 · Minimal
- FEMA flood zone
- X (unshaded)
- Chance of flooding over 30 yrs
- 0.0%
- Est. flood insurance / yr
- $507 – $1,088
Fire risk 1/10 · Minimal
- Est. fire insurance / yr
- $490 – $910
Heat risk 8/10 · Major
- Hot days now (above 106°F)
- 7 days/yr
- Hot days in 30 yrs
- 18 days/yr
Wind risk 1/10 · Minimal
- Chance of severe wind over 30 yrs
- —
Air-quality risk 3/10 · Minor
- Unhealthy air days now
- 3 days/yr
- Unhealthy air days in 30 yrs
- 4 days/yr
Risk factors via First Street. Map © Google.
Why this score? — see what drove the C- grade
The composite is a weighted blend of 9 inputs, each scored 0–100. Each bar is that input's sub-score; the figure is the points it added to the 100-point composite (weight × sub-score).
- Cash flow +22.9/30.0
- ARV discount +7.5/15.0
- DSCR +7.3/10.0
- 1% rule +4.7/10.0
- Livability +4.0/5.0
- Schools +2.6/10.0
- Condition / age +2.5/5.0
- Rent growth +2.4/5.0
- Appreciation +0.0/10.0
$649,000
🖨 Deal sheet 📄 Offer letter ✓ Due diligence
Multi-family units
County records classify this as Multi-Family (2-4 Unit). Listing-text estimate: 4 units. confirmed
Listing remarks MLS
4 PLEX INVESTMENT OPPORTUNITY! Great location close to restaurants, shopping centers and transportation. ALL units have 2 BEDROOMS, 1 BATH in good condition. Investment opportunity in Multi-Family Fourplex located near the 95 HWY. Property features 1 building with 4 units. Each unit is 745 sq ft, with Washer, dryer, and refrigerator included with all units. Currently, three units are occupied and are month to month with long term tenants. It's a great time to capitalize in a booming rental market. Contact me today for more information.
Key facts
- 6,970 sq ft lot
- Built 1979
- Listed 30 days
Property features AI
Finance
- Financial info: Tenants pay electricity; Reported actual rents: units rent for approximately $1,000–$1,125 (individual unit rents listed)
Exterior
- Utilities: Public water; Public sewer
- Home design: Fourplex (multi-family, 1 building, 4 total units); 1 story
- Construction: Stucco and wood frame construction; Flat roof
- Exterior features: Good condition, resale property; Single-story building; Parcel about 0.16 acre
Interior
- Bedrooms: Four 2-bedroom units (fourplex)
- Flooring: Tile
- Bathrooms: Each unit has 1 full bathroom
- Heating & cooling: Central heating (electric); Central air conditioning
- Interior features: Blinds and window treatments; Unfurnished; Tile flooring
- Laundry & utility: Washer hookup in units; Dryer hookup in units
Neighborhood map
What this means for you Summary
Snapshot
- This is a 4 × 2-bed/1.0-bath units multifamily listed at $649k.
Deal economics
- At list price, monthly cash flow is $1k ($14k/yr) — positive. Per door: $285/mo.
- The deal already cash-flows at list — no discount required.
- To meet the 1% rule (rent ≥ 1% of price), the offer needs to be $628k (3.3% below list).
- Recommended offer: $628k (3.3% below list) — sets the bar for 1% rule.
Location & tenants
- Location reads 80/100 on livability (#2 in NV, #1,723 nationally) — a professional / high-income tenant draw. Strengths: amenities A+, commute A+, housing A+; Watch: crime F.
- Clark County School District (urban): math 21% / reading 39% proficiency, ranked #11 of 17 in NV (top 65%) — families likely to look elsewhere, expect single-tenant / working-renter base with shorter leases.
- Market conditions: Rents soft (-0.4%/yr); 319 active listings in the ZIP; 14,754 units permitted in Clark County in 2024 (2,301 in 5+ unit buildings).
- At $6,279/mo this rent would consume 127% of the median local household income ($59k/yr) (locally 4437% of renters already pay >50% of income on rent) — very limited rent-growth headroom before tenants either downsize or default.
Forward outlook
- Local home prices are declining (-3.0%/yr); year-one equity from $4k of loan paydown is wiped out by about $19k of value loss. Plan a longer hold.
- Clark County population projected at +36% by 2050 — long-run rental-demand tailwind backs the buy-and-hold thesis.
Negotiation context
- It's been on market 30 days — a 2% lower offer ($639k) is reasonable based on typical stale-listing flexibility.
- 2 sale attempts since 4y ago with the ask held roughly flat each time — persistent listings suggest the price (not the market) is what's stuck; bring a comps-based counter.
Risks & watch-outs
- Climate carrying-cost: extreme-heat days projected 7→18/yr by 2055 (HVAC capex compounding) — expect insurance premiums to compound above CPI over the hold.
Questions for the listing agent
- Can we see the unit-by-unit rent roll, current vacancy, and any below-market leases? What's the average tenancy length?
- What capital expenditures (roof, boiler, parking lot, exteriors) have been made in the last 5 years, and what's planned in the next 2?
- Built in 1979 — when were the roof, HVAC, electrical panel, plumbing, and water heater last replaced?
- Is there a deadline driving the sale (1031 exchange, divorce, estate, relocation)? That informs how much negotiation room exists.
- Crime grade is F in this area — have there been break-ins, vandalism, or insurance claims at this property in the last 3 years? What carrier currently insures it and at what premium?
- What's the average days-on-market for RENTAL listings here right now (not sales)? A rising rental-DOM trend means longer vacancies and softer asking-rent achievability than the comps imply.
- What's the recent tenant-quality profile in this submarket — average credit score on applications, eviction rate, late-payment / NSF rate, and stable-employment percentage? A property-management company in the area should have these aggregated.
- How much new apartment / multifamily construction is in the pipeline within 1–3 miles? Heavy new supply (>2% of stock underway) typically softens rents 12–24 months out; light construction supports rent growth.
Investment metrics
- 1% rule
- 0.97% ✗
- Cap rate
- 8.40%
- Cash-on-cash
- 7.52%
- DSCR
- 1.33
- GRM
- 8.6
CMA / ARV
No comps found within radius.
Projected returns pro-forma
-3.0% appreciation · 0.0% rent growth · sell at horizon
- IRR
- -7.9%
- Equity multiple
- 0.72×
- Total profit
- $-51,326
- Equity at exit
- $96,768
- IRR
- -2.2%
- Equity multiple
- 0.87×
- Total profit
- $-23,655
- Equity at exit
- $56,114
Cash invested: $181,720 (down + closing). Projections, not guarantees.
Landlord ↔ Tenant lean methodology
- Overall (STATE)
- 71 Landlord-Friendly
- State Nevada
- 71 Landlord-Friendly · R+1
- County
- — inherits STATE
- City
- — inherits STATE
ZIP-level market 89108
- Rents YoY
- -0.4%
- Active inventory
- 319
- Price-to-rent
- 34.5×
Monthly cashflow live
- Estimated rent
- $6,279 high interval (Pro) →
- Mortgage (P&I)
- −$3,403
- Tax from tax record
- −$147 /mo · $1,769/yr
- Insurance
- −$270
- HOA
- −$0
- Vacancy / Maint / Mgmt
- −$1,319
- Net cashflow
- $1,139
Break-even live
4-unit breakdown (identical units grouped — click to expand)
| Units | Beds | Baths | Est. rent |
|---|---|---|---|
| 4× units | 2 | 1 | $6,280 |
| #1 | 2 | 1 | $1,570 |
| #2 | 2 | 1 | $1,570 |
| #3 | 2 | 1 | $1,570 |
| #4 | 2 | 1 | $1,570 |
| Total (4 units) | $6,279 | ||
UW: 25.0% down · 7.5% · 30yr · 1.5% tax · 5.0% vac · 8.0% maint · 8.0% mgmt
Financing live
Cash to close
- Down payment
- $162,250
- Closing costs
- $19,470
- Reserves months
- —
- Total cash needed
- —
Loan-product check · same deal, 3 products live
Conventional
25% down · 7.5% · 30yr
- Down + closing
- —
- Monthly P&I
- —
- Monthly cashflow
- —
- DSCR
- —
- Eligible?
- —
Personal DTI + credit; lowest rate.
DSCR
20% down · 8.5% · 30yr
- Down + closing
- —
- Monthly P&I
- —
- Monthly cashflow
- —
- DSCR
- —
- Eligible?
- —
No personal income docs; deal must DSCR.
Hard money
10% down · 12.0% · 12mo
- Down + closing
- —
- Monthly P&I
- —
- Monthly cashflow
- —
- DSCR
- —
- Eligible?
- —
Short-term bridge; refi at stabilization.
Listing history 11 events
-
2026-05-05historical Active Under Contract 359-char remark
-
2026-04-27$649,000 Active 359-char remark
-
2023-07-22historical
-
2022-12-16soldstatus $563,000 Closed 541-char remark
Show marketing remark (541 chars)
4 PLEX INVESTMENT OPPORTUNITY! Great location close to restaurants, shopping centers and transportation. ALL units have 2 BEDROOMS, 1 BATH in good condition. Investment opportunity in Multi-Family Fourplex located near the 95 HWY. Property features 1 building with 4 units. Each unit is 745 sq ft, with Washer, dryer, and refrigerator included with all units. Currently, three units are occupied and are month to month with long term tenants. It's a great time to capitalize in a booming rental market. Contact me today for more information.
-
2022-12-16soldstatus $563,000
Show marketing remark (541 chars)
4 PLEX INVESTMENT OPPORTUNITY! Great location close to restaurants, shopping centers and transportation. ALL units have 2 BEDROOMS, 1 BATH in good condition. Investment opportunity in Multi-Family Fourplex located near the 95 HWY. Property features 1 building with 4 units. Each unit is 745 sq ft, with Washer, dryer, and refrigerator included with all units. Currently, three units are occupied and are month to month with long term tenants. It's a great time to capitalize in a booming rental market. Contact me today for more information.
-
2022-11-14status Pending 541-char remark
Show marketing remark (541 chars)
4 PLEX INVESTMENT OPPORTUNITY! Great location close to restaurants, shopping centers and transportation. ALL units have 2 BEDROOMS, 1 BATH in good condition. Investment opportunity in Multi-Family Fourplex located near the 95 HWY. Property features 1 building with 4 units. Each unit is 745 sq ft, with Washer, dryer, and refrigerator included with all units. Currently, three units are occupied and are month to month with long term tenants. It's a great time to capitalize in a booming rental market. Contact me today for more information.
-
2022-10-31$574,900 Active 541-char remark
Show marketing remark (541 chars)
4 PLEX INVESTMENT OPPORTUNITY! Great location close to restaurants, shopping centers and transportation. ALL units have 2 BEDROOMS, 1 BATH in good condition. Investment opportunity in Multi-Family Fourplex located near the 95 HWY. Property features 1 building with 4 units. Each unit is 745 sq ft, with Washer, dryer, and refrigerator included with all units. Currently, three units are occupied and are month to month with long term tenants. It's a great time to capitalize in a booming rental market. Contact me today for more information.
-
2005-03-18soldstatus $368,000
-
1998-12-02soldstatus $175,000
-
1988-10-18soldstatus $32,500
-
1986-10-23soldstatus $93,414
ⓘ Source: listings_history table (triggers on properties + properties_extension) + one-shot
backfill from property_details.listing_events for pre-trigger history.
Tax reassessment forecast NV · Resets to sale price
- Current annual tax
- $1,769 · $147/mo
- Projected year-2 tax
- $3,829 · $319/mo
- Expected delta
- +$2,060/yr (+$172/mo · 116.5%)
ⓘ Screening estimate from a state-policy table — verify with the county assessor before closing.
Climate risk First Street
- Flood 1/10 Low FEMA zone X (unshaded) · 0% chance over 30 yrs
- Wildfire 1/10 Low
- Heat 8/10 Severe 7 d/yr ≥106°F today · 18 d/yr by 30 yrs out
- Wind 1/10 Low
- Air quality 3/10 Moderate 3 unhealthy d/yr today · 4 by 30 yrs out
Nearby sold comps map
Loading sold comps map…
Walkable amenities ~0.75 mi
Loading nearby amenities…
Taxation est. · year 1
- Rental income
- $75,348
- − Mortgage interest
- −$36,354
- − Property taxes
- −$1,769
- − Insurance
- −$3,245
- − Repairs & maintenance
- −$6,028
- − Management
- −$6,028
- − Depreciation
- −$18,880
- Taxable income
- $3,044
- Est. tax owed @ 24.0%
- −$731
- After-tax cash flow
- $12,939/yr
For passive investors: Depreciation is non-cash, so a rental often shows a tax loss while cash-flowing — sheltering income. Rental losses are passive: they offset passive income freely, and up to $25,000/yr can offset ordinary (W-2) income if you actively participate and your MAGI is under $100k (phasing out to $0 by $150k); unused losses carry forward. On sale, claimed depreciation is recaptured at up to 25%, and gains may owe capital-gains tax (a 1031 exchange can defer both). Figures are a year-1 estimate at your 24.0% rate — not tax advice; consult a CPA.
Schools (NCES district)
- District
- Clark County School District
- NCES district ID
- 3200060
- Math proficiency
- 21% ▼ -13.00%
- Reading proficiency
- 39% ▼ -8.00%
- Median HH income
- $53,611
- Composite
- 26.48/100
- National rank
- #7211
- State rank
- #11 of 17 in NV
Livability — Las Vegas
- Score
- 80/100
- State rank
- #2
- US rank
- #1723
Category grades
Schools grade is shown separately in the Schools card above.
Census & demographics
- Census place
- Las Vegas, NV
- County
- Clark County · 2,306,105 people
- City population
- 1,643,591
- Metro
- Las Vegas-Henderson-Paradise, NV
- Population (ZIP)
- 72,814
- Household income
- $59,449
- Rent vs Own
- Severe rent burden
- 4437.0
Population outlook (Clark County) Hauer SSP2
- Today (2025)
- 2,504,101 people
- By 2030
- 2,693,770 · +7.6%
- By 2040
- 3,061,208 · +22.2%
- By 2050
- 3,400,072 · +35.8%
- By 2075
- 4,139,522 · +65.3%
- By 2100
- 4,596,916 · +83.6%
Race, ethnicity, and origin ACS 2023
- Neighborhood character
- Diverse neighborhood (Simpson 0.65)
- Race & ethnicity
- Hispanic / Latino 50% White 27% Two or more races 17% Black 14% Asian 4% Native American 1%
- Hispanic origin (detail)
- Mexican 39% Puerto Rican 2% Cuban 2%
- Common ancestry
- Lithuanian 1% Italian 1% Romanian 1%
- Foreign-born
- 25% · Canada
- Languages at home
- 55% English-only · Spanish 41% Tagalog/Filipino 2% Other Indo-European 1%
Political lean MEDSL · Clark
- 2024 margin
- Toss-up / Even · D 50.4% · R 47.8% · Other 1.7%
- 2008→2024 swing
- -16.5pp toward R · 2008: 19.1pp · 2024: 2.6pp
- All cycles
- 2024: D+2.6 2020: D+9.3 2016: D+10.7 2012: D+14.5 2008: D+19.1
Not yet ingested
- Civics
- —
Market trends
- HPI YoY
- ▼ -330.01%
- Current HPI
- 300.5771
- Rent YoY
- ▼ -0.43%
- Metro
- Las Vegas-Henderson-Paradise, NV
- State GDP YoY
- ▲ 3.08%
- F500 in state
- 6
Industry mix (Fortune 500 HQ in NV)
| Industry | F500 HQs | Revenue |
|---|---|---|
| Hotels / Casinos | 3 | $36B |
|
||
Price history
+581.9% since first listed14 events — show timeline
- 2026-05-29 Sold (Public Records) $637,000 Public Records
- 2026-05-29 Sold (MLS) $637,000 GLVAR
- 2026-05-27 Pending — GLVAR
- 2026-05-05 Contingent — GLVAR
- 2026-04-27 Listed $649,000 GLVAR
- 2023-07-22 Rental Removed — APPFOLIO
- 2022-12-16 Sold (Public Records) $563,000 Public Records
- 2022-12-16 Sold (MLS) $563,000 GLVAR
- 2022-11-14 Pending — GLVAR
- 2022-10-31 Listed $574,900 GLVAR
- 2005-03-18 Sold (Public Records) $368,000 Public Records
- 1998-12-02 Sold (Public Records) $175,000 Public Records
- 1988-10-18 Sold (Public Records) $32,500 Public Records
- 1986-10-23 Sold (Public Records) $93,414 Public Records
Property tax history
-0.8%/yrLatest (2025): $1,769 · +7.8% YoY. Source: county tax records.
Cash-flow waterfall
monthlySold comps — $/sqft
last 12 mo · ≤1 miLoading sold comps…