 Multi-family
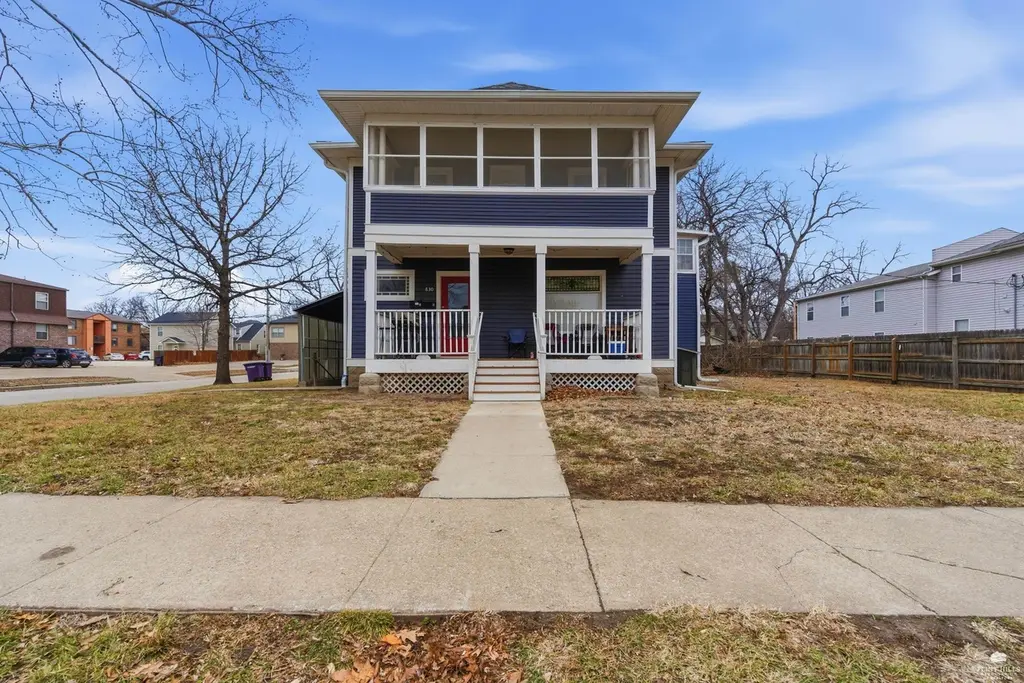
830 Moro St · Manhattan, KS
Flood risk 1/10 · Minimal
- FEMA flood zone
- X (unshaded)
- Chance of flooding over 30 yrs
- 0.0%
- Est. flood insurance / yr
- $473 – $860
Fire risk 3/10 · Minor
- Est. fire insurance / yr
- $1,154 – $2,142
Heat risk 5/10 · Moderate
- Hot days now (above 107°F)
- 7 days/yr
- Hot days in 30 yrs
- 16 days/yr
Wind risk 2/10 · Minimal
- Chance of severe wind over 30 yrs
- —
Air-quality risk 2/10 · Minimal
- Unhealthy air days now
- 2 days/yr
- Unhealthy air days in 30 yrs
- 2 days/yr
Risk factors via First Street. Map © Google.
Why this score? — see what drove the C+ grade
The composite is a weighted blend of 9 inputs, each scored 0–100. Each bar is that input's sub-score; the figure is the points it added to the 100-point composite (weight × sub-score).
- Cash flow +25.4/30.0
- DSCR +8.4/10.0
- ARV discount +7.5/15.0
- 1% rule +6.1/10.0
- Livability +4.2/5.0
- Rent growth +4.0/5.0
- Schools +3.6/10.0
- Condition / age +2.5/5.0
- Appreciation +0.0/10.0
$355,000
🖨 Deal sheet 📄 Offer letter ✓ Due diligence
Multi-family units
County records classify this as Multi-Family (5+ Unit). Listing-text estimate: 1 unit. estimate disagrees with records
5+ unit building — per-unit beds/baths from public records are typically unavailable; the breakdown below (if shown) is an estimate from the listing text.
Listing remarks MLS
4 plex located within walking distance of the KSU Campus
Key facts
- Unbeatable location
- 6,075 sq ft lot
- Built 1910
Tags
Property features AI
Finance
- Other: Tax information provided separately
- Financial info: Reported unit rents: Unit 1 $850, Unit 3 $600, Unit 4 $700
- HOA & community: No HOA details provided
Exterior
- Parking: No parking details provided
- Security: No security details provided
- Utilities: Public water; Public sewer
- Home design: Residential income property; Quadruplex
- Construction: Construction materials: Unknown
- Exterior features: No fencing; Concrete road access
Interior
- Kitchen: No kitchen appliance details provided
- Bedrooms: Unit 1: 2 bedrooms; Unit 2: 1 bedroom; Unit 3: 1 bedroom; Unit 4: 1 bedroom
- Flooring: No flooring details provided
- Bathrooms: Four full bathrooms total; Each unit includes 1 bathroom
- Heating & cooling: Electric heating; Window cooling units; Other heating and cooling features
- Interior features: Finished walk-up basement
- Laundry & utility: No laundry appliance details provided
Neighborhood map
What this means for you Summary
Snapshot
- This is a 4-bed/4.0-bath multifamily listed at $355k.
Deal economics
- At list price, monthly cash flow is $812 ($10k/yr) — positive.
- The deal already cash-flows at list — no discount required.
- Meets the 1% rule at list price ($4k rent vs $355k).
- Recommended offer: $350k (1.5% below list) — sets the bar for market timing.
Location & tenants
- Location reads 83/100 on livability (#6 in KS, #979 nationally) — a professional / high-income tenant draw. Strengths: amenities A+, commute A+, cost of living A+; Watch: crime C-, employment C-.
- Manhattan-Ogden (urban): math 39% / reading 46% proficiency, ranked #26 of 169 in KS (top 15%) — families likely to look elsewhere, expect single-tenant / working-renter base with shorter leases.
- Market conditions: Rents rising fast (+6.0%/yr); 336 active listings in the ZIP; 132 units permitted in Riley County in 2024 (35 in 5+ unit buildings).
- At $3,927/mo this rent would consume 86% of the median local household income ($55k/yr) (locally 3089% of renters already pay >50% of income on rent) — very limited rent-growth headroom before tenants either downsize or default.
Forward outlook
- Local home prices are declining (-3.0%/yr); year-one equity from $2k of loan paydown is wiped out by about $11k of value loss. Plan a longer hold.
- Riley County population projected at +30% by 2050 — long-run rental-demand tailwind backs the buy-and-hold thesis.
- At projected returns (-3.0% appreciation + 6.0% rent growth), your $99k cash investment doubles in ~9 years — after that, you're playing with house money.
Negotiation context
- It's been on market 18 days — a 2% lower offer ($350k) is reasonable based on typical stale-listing flexibility.
- 7 sale attempts since 5y ago; this cycle's ask has dropped $20k (5%) from the opening price — seller is motivated, your offer sets the floor, not the list.
Risks & watch-outs
- Watch-outs: built in 1910 — expect roof / HVAC / electrical / plumbing capex.
- Climate carrying-cost: extreme-heat days projected 7→16/yr by 2055 (HVAC capex compounding) — expect insurance premiums to compound above CPI over the hold.
Questions for the listing agent
- Built in 1910 — when were the roof, HVAC, electrical panel, plumbing, and water heater last replaced?
- Is there a deadline driving the sale (1031 exchange, divorce, estate, relocation)? That informs how much negotiation room exists.
- What's the average days-on-market for RENTAL listings here right now (not sales)? A rising rental-DOM trend means longer vacancies and softer asking-rent achievability than the comps imply.
- What's the recent tenant-quality profile in this submarket — average credit score on applications, eviction rate, late-payment / NSF rate, and stable-employment percentage? A property-management company in the area should have these aggregated.
- How much new apartment / multifamily construction is in the pipeline within 1–3 miles? Heavy new supply (>2% of stock underway) typically softens rents 12–24 months out; light construction supports rent growth.
Investment metrics
- 1% rule
- 1.11% ✓
- Cap rate
- 9.04%
- Cash-on-cash
- 9.80%
- DSCR
- 1.44
- GRM
- 7.5
CMA / ARV
No comps found within radius.
Projected returns pro-forma
-3.0% appreciation · 6.02% rent growth · sell at horizon
- IRR
- 1.6%
- Equity multiple
- 1.06×
- Total profit
- $6,454
- Equity at exit
- $52,932
- IRR
- 13.9%
- Equity multiple
- 2.26×
- Total profit
- $125,734
- Equity at exit
- $30,694
Cash invested: $99,400 (down + closing). Projections, not guarantees.
Landlord ↔ Tenant lean methodology
- Overall (STATE)
- 83 Strongly Landlord-Friendly
- State Kansas
- 83 Strongly Landlord-Friendly · R+10
- County
- — inherits STATE
- City
- — inherits STATE
ZIP-level market 66502
- Rents YoY
- 6.0%
- Active inventory
- 336
- Price-to-rent
- 30.1×
Monthly cashflow live
- Estimated rent
- $3,927 medium interval (Pro) →
- Mortgage (P&I)
- −$1,862
- Tax from tax record
- −$281 /mo · $3,367/yr
- Insurance
- −$148
- HOA
- −$0
- Vacancy / Maint / Mgmt
- −$825
- Net cashflow
- $812
Break-even live
4-unit breakdown (identical units grouped — click to expand)
| Units | Beds | Baths | Est. rent |
|---|---|---|---|
| 4× units | 2 | 1 | $3,928 |
| #1 | 2 | 1 | $982 |
| #2 | 2 | 1 | $982 |
| #3 | 2 | 1 | $982 |
| #4 | 2 | 1 | $982 |
| Total (4 units) | $3,927 | ||
UW: 25.0% down · 7.5% · 30yr · 1.5% tax · 5.0% vac · 8.0% maint · 8.0% mgmt
Financing live
Cash to close
- Down payment
- $88,750
- Closing costs
- $10,650
- Reserves months
- —
- Total cash needed
- —
Loan-product check · same deal, 3 products live
Conventional
25% down · 7.5% · 30yr
- Down + closing
- —
- Monthly P&I
- —
- Monthly cashflow
- —
- DSCR
- —
- Eligible?
- —
Personal DTI + credit; lowest rate.
DSCR
20% down · 8.5% · 30yr
- Down + closing
- —
- Monthly P&I
- —
- Monthly cashflow
- —
- DSCR
- —
- Eligible?
- —
No personal income docs; deal must DSCR.
Hard money
10% down · 12.0% · 12mo
- Down + closing
- —
- Monthly P&I
- —
- Monthly cashflow
- —
- DSCR
- —
- Eligible?
- —
Short-term bridge; refi at stabilization.
Listing history 37 events
-
2026-06-19days on market $355,000 Active 18 DOM
-
2026-06-18days on market $355,000 Active 17 DOM
-
2026-06-17days on market $355,000 Active 16 DOM
-
2026-06-16days on market $355,000 Active 15 DOM
-
2026-06-15days on market $355,000 Active 14 DOM
-
2026-06-14days on market $355,000 Active 12 DOM
-
2026-06-13days on market $355,000 Active 11 DOM
-
2026-06-10days on market $355,000 Active 9 DOM
-
2026-06-09days on market $355,000 Active 8 DOM
-
2026-06-08days on market $355,000 Active 7 DOM
-
2026-06-07days on market $355,000 Active 6 DOM
-
2026-06-03days on market $355,000 Active 2 DOM
-
2026-06-01pricestatusdays on market $355,000 Active 1 DOM
-
2026-04-16price $360,000
-
2026-02-26price $370,000
-
2026-01-14$375,000 Active
-
2024-12-19soldstatus Closed 56-char remark
Show marketing remark (56 chars)
4 plex located within walking distance of the KSU Campus
-
2024-11-11status Pending 56-char remark
Show marketing remark (56 chars)
4 plex located within walking distance of the KSU Campus
-
2024-10-29price $275,000 56-char remark
Show marketing remark (56 chars)
4 plex located within walking distance of the KSU Campus
-
2024-09-21$279,500 Active 56-char remark
Show marketing remark (56 chars)
4 plex located within walking distance of the KSU Campus
-
2024-04-10historical $725
-
2024-03-20price $725
-
2024-01-18price $750
-
2024-01-12$800
-
2024-01-12historical $800
-
2024-01-12$800
-
2023-08-17historical $496
-
2023-08-06$496
-
2023-08-05historical $495
-
2023-08-01price $495
-
2022-11-07soldstatus
-
2022-10-31soldstatus Closed 293-char remark
Show marketing remark (293 chars)
Excellent investment property opportunity. 4 Units ALL Leased! Property is located within walking distance of campus, city park, Aggieville, downtown, Poyntz Ave. , and many more amenities that is offered in Manhattan. This is a property that can't be missed! Call Brice at (785) 422- 7078!
-
2022-09-19status Pending 293-char remark
Show marketing remark (293 chars)
Excellent investment property opportunity. 4 Units ALL Leased! Property is located within walking distance of campus, city park, Aggieville, downtown, Poyntz Ave. , and many more amenities that is offered in Manhattan. This is a property that can't be missed! Call Brice at (785) 422- 7078!
-
2022-09-06$200,000 Active 293-char remark
Show marketing remark (293 chars)
Excellent investment property opportunity. 4 Units ALL Leased! Property is located within walking distance of campus, city park, Aggieville, downtown, Poyntz Ave. , and many more amenities that is offered in Manhattan. This is a property that can't be missed! Call Brice at (785) 422- 7078!
-
2021-11-04soldstatus
-
2021-11-01soldstatus
-
2021-07-20$185,000
ⓘ Source: listings_history table (triggers on properties + properties_extension) + one-shot
backfill from property_details.listing_events for pre-trigger history.
Tax reassessment forecast KS · Resets to sale price
- Current annual tax
- $3,367 · $281/mo
- Projected year-2 tax
- $5,006 · $417/mo
- Expected delta
- +$1,638/yr (+$137/mo · 48.7%)
ⓘ Screening estimate from a state-policy table — verify with the county assessor before closing.
Climate risk First Street
- Flood 1/10 Low FEMA zone X (unshaded) · 0% chance over 30 yrs
- Wildfire 3/10 Moderate
- Heat 5/10 Major 7 d/yr ≥107°F today · 16 d/yr by 30 yrs out
- Wind 2/10 Low
- Air quality 2/10 Low 2 unhealthy d/yr today · 2 by 30 yrs out
Nearby sold comps map
Loading sold comps map…
Walkable amenities ~0.75 mi
Loading nearby amenities…
Taxation est. · year 1
- Rental income
- $47,124
- − Mortgage interest
- −$19,886
- − Property taxes
- −$3,367
- − Insurance
- −$1,775
- − Repairs & maintenance
- −$3,770
- − Management
- −$3,770
- − Depreciation
- −$10,327
- Taxable income
- $4,229
- Est. tax owed @ 24.0%
- −$1,015
- After-tax cash flow
- $8,731/yr
For passive investors: Depreciation is non-cash, so a rental often shows a tax loss while cash-flowing — sheltering income. Rental losses are passive: they offset passive income freely, and up to $25,000/yr can offset ordinary (W-2) income if you actively participate and your MAGI is under $100k (phasing out to $0 by $150k); unused losses carry forward. On sale, claimed depreciation is recaptured at up to 25%, and gains may owe capital-gains tax (a 1031 exchange can defer both). Figures are a year-1 estimate at your 24.0% rate — not tax advice; consult a CPA.
Schools (NCES district)
- District
- Manhattan-Ogden
- NCES district ID
- 2009180
- Math proficiency
- 39% ▼ -1.00%
- Reading proficiency
- 46% ▲ 1.00%
- Median HH income
- $44,001
- Composite
- 35.97/100
- National rank
- #4795
- State rank
- #26 of 169 in KS
Livability — Manhattan
- Score
- 83/100
- State rank
- #6
- US rank
- #979
Category grades
Schools grade is shown separately in the Schools card above.
Census & demographics
- Census place
- Manhattan, KS
- County
- Riley County · 62,662 people
- City population
- 60,966
- Metro
- Manhattan, KS
- Population (ZIP)
- 43,693
- Household income
- $54,833
- Rent vs Own
- Severe rent burden
- 3089.0
Population outlook (Riley County) Hauer SSP2
- Today (2025)
- 83,656 people
- By 2030
- 89,075 · +6.5%
- By 2040
- 99,100 · +18.5%
- By 2050
- 109,146 · +30.5%
- By 2075
- 134,178 · +60.4%
- By 2100
- 153,653 · +83.7%
Race, ethnicity, and origin ACS 2023
- Neighborhood character
- Predominantly White (78%)
- Race & ethnicity
- White 78% Hispanic / Latino 9% Two or more races 8% Black 4% Asian 3% Native American 1%
- Hispanic origin (detail)
- Mexican 6%
- Common ancestry
- Slovak 3% Italian 3% Lithuanian 2%
- Foreign-born
- 8% · Canada, China
- Languages at home
- 91% English-only · Spanish 5% Other Indo-European 2% Chinese 1%
Political lean MEDSL · Riley
- 2024 margin
- Toss-up / Even · D 49.6% · R 47.8% · Other 2.5%
- 2008→2024 swing
- +8.8pp toward D · 2008: -7.0pp · 2024: 1.8pp
- All cycles
- 2024: D+1.8 2020: D+3.2 2016: R+4.5 2012: R+12.7 2008: R+7.0
Not yet ingested
- Civics
- —
Market trends
- HPI YoY
- ▼ -283.54%
- Current HPI
- 172.7795
- Rent YoY
- ▲ 6.02%
- Metro
- Manhattan, KS
- State GDP YoY
- —
- F500 in state
- 0
Price history
+94.6% since first listed24 events — show timeline
- 2026-04-16 Price Changed $360,000 FHAOR as distributed by MLS GRID
- 2026-02-26 Price Changed $370,000 FHAOR as distributed by MLS GRID
- 2026-01-14 Listed $375,000 FHAOR as distributed by MLS GRID
- 2024-12-19 Sold (MLS) — FHAOR as distributed by MLS GRID
- 2024-11-11 Pending — FHAOR as distributed by MLS GRID
- 2024-10-29 Price Changed $275,000 FHAOR as distributed by MLS GRID
- 2024-09-21 Listed $279,500 FHAOR as distributed by MLS GRID
- 2024-04-10 Rental Removed $725 APPFOLIO
- 2024-03-20 Price Changed $725 APPFOLIO
- 2024-01-18 Price Changed $750 APPFOLIO
- 2024-01-12 Listed for Rent $800 APPFOLIO
- 2024-01-12 Rental Removed $800 APPFOLIO
- 2024-01-12 Listed for Rent $800 APPFOLIO
- 2023-08-17 Rental Removed $496 APPFOLIO
- 2023-08-06 Listed for Rent $496 APPFOLIO
- 2023-08-05 Rental Removed $495 APPFOLIO
- 2023-08-01 Price Changed $495 APPFOLIO
- 2022-11-07 Sold (Public Records) — Public Records
- 2022-10-31 Sold (MLS) — FHAOR as distributed by MLS GRID
- 2022-09-19 Pending — FHAOR as distributed by MLS GRID
- 2022-09-06 Listed $200,000 FHAOR as distributed by MLS GRID
- 2021-11-04 Sold (Public Records) — Public Records
- 2021-11-01 Sold (MLS) — FHAOR as distributed by MLS GRID
- 2021-07-20 Listed $185,000 FHAOR as distributed by MLS GRID
Property tax history
+2.1%/yrLatest (2025): $3,367 · +16.9% YoY. Source: county tax records.
Cash-flow waterfall
monthlySold comps — $/sqft
last 12 mo · ≤1 miLoading sold comps…