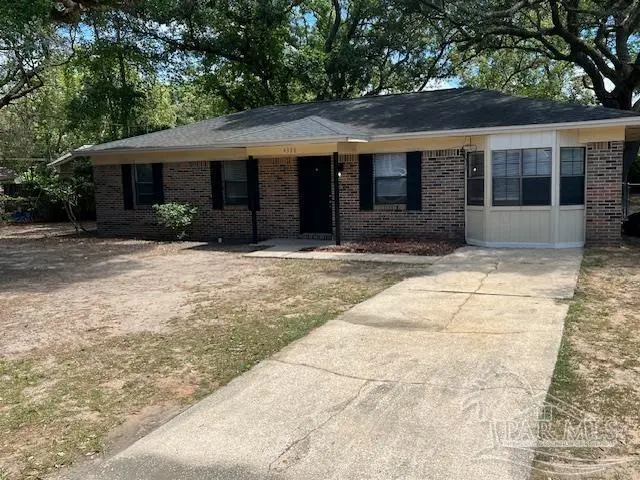
4328 Rhonda Rd · Pea Ridge, FL
Flood risk 1/10 · Minimal
- FEMA flood zone
- X (unshaded)
- Chance of flooding over 30 yrs
- 0.0%
- Est. flood insurance / yr
- $507 – $1,088
Fire risk 3/10 · Minor
- Est. fire insurance / yr
- $947 – $1,759
Heat risk 9/10 · Severe
- Hot days now (above 105°F)
- 7 days/yr
- Hot days in 30 yrs
- 21 days/yr
Wind risk 9/10 · Severe
- Chance of severe wind over 30 yrs
- 99.0%
Air-quality risk 1/10 · Minimal
- Unhealthy air days now
- 0 days/yr
- Unhealthy air days in 30 yrs
- 0 days/yr
Risk factors via First Street. Map © Google.
Why this score? — see what drove the C+ grade
The composite is a weighted blend of 9 inputs, each scored 0–100. Each bar is that input's sub-score; the figure is the points it added to the 100-point composite (weight × sub-score).
- Cash flow +22.5/30.0
- ARV discount +10.9/15.0
- DSCR +7.2/10.0
- Schools +5.3/10.0
- 1% rule +5.1/10.0
- Livability +3.5/5.0
- Rent growth +3.2/5.0
- Condition / age +2.5/5.0
- Appreciation +0.0/10.0
$199,900
🖨 Deal sheet (PDF) 📄 Offer letter ✓ Due diligence
Listing remarks
This is a great starter home and with excellent owner financing available.
Key facts
- 0.26 acre lot
- Built 1980
- Listed 65 days
Property features AI
Finance
- Other: County-maintained road access; Energy efficiency features: insulation, insulated walls, ridge vent
- HOA & community: No association
Exterior
- Parking: Driveway with open parking; RV access/parking
- Security: Smoke detectors
- Utilities: Public water; Public sewer; Circuit breakers with copper wiring; Cable available
- Home design: One-story brick home; Resale property; Not attached to another property; Shingle roof
- Construction: Brick construction; Slab foundation; Built as a single-level (one) dwelling
- Exterior features: Patio; Porch; Back yard with chain-link fence; Interior lot
Interior
- Kitchen: Laminate counters; Pantry; Refrigerator included; Eat-in kitchen / kitchen-dining combo
- Bedrooms: Primary bedroom on the first floor (approx. 11 x 15); Additional bedroom on the first floor (approx. 10 x 12)
- Flooring: Vinyl; Carpet; Laminate
- Bathrooms: 1 full bathroom
- Heating & cooling: Central heat; Central air; Ceiling fans for cooling
- Interior features: Baseboards; Ceiling fans; Insulated doors; Double-pane windows with blinds
- Laundry & utility: Laundry inside with washer/dryer hookups; Electric water heater
Neighborhood map
What this means for you Summary
Snapshot
- This is a 3-bed/1.0-bath single-family listed at $200k.
Deal economics
- At list price, monthly cash flow is $335 ($4k/yr) — positive.
- The deal already cash-flows at list — no discount required.
- Meets the 1% rule at list price ($2k rent vs $200k).
- Recommended offer: $188k (6.0% below list) — sets the bar for market timing.
- Cap rate 8.3% vs local median 4.5% in Pea Ridge — top-decile yield for the area; either an underpriced asset or a hidden risk that comps aren't pricing in. Stress-test before assuming the spread holds.
Location & tenants
- Location reads 69/100 on livability (#459 in FL) — a middle-class / working-renter tenant base. Strengths: cost of living A+, housing A+, crime A-; Watch: schools D-, amenities F, commute F.
- Santa Rosa (suburban): math 63% / reading 60% proficiency, ranked #8 of 73 in FL (top 11%) — acceptable for families but not a draw, mixed tenant base, ~2y average lease.
- Market conditions: Rents rising (+2.7%/yr); 665 active listings in the ZIP; 10 comparable units currently listed for rent nearby; rentals at typical pace (median 15d on market — plan ~3-4 weeks tenant-placement turnaround); solid renter incomes; 1,983 units permitted in Santa Rosa County in 2024 (128 in 5+ unit buildings).
Forward outlook
- Local home prices are declining (-3.0%/yr); year-one equity from $1k of loan paydown is wiped out by about $6k of value loss. Plan a longer hold.
- Santa Rosa County population projected at +31% by 2050 — long-run rental-demand tailwind backs the buy-and-hold thesis.
Negotiation context
- It's been on market 65 days — a 6% lower offer ($188k) is reasonable based on typical stale-listing flexibility.
- 2 sale attempts since 14y ago with the ask held roughly flat each time — persistent listings suggest the price (not the market) is what's stuck; bring a comps-based counter.
- Current owner paid $40k; list at $200k implies a 396% gain — meaningful room to come down on a strong offer.
Risks & watch-outs
- Climate carrying-cost: severe wind risk, 99% chance of damaging wind over 30y; extreme-heat days projected 7→21/yr by 2055 (HVAC capex compounding) — expect insurance premiums to compound above CPI over the hold.
Questions for the listing agent
- It's been on market 65 days. Have you received any prior offers? Is the seller open to a 6% concession, seller financing, or rate buy-down credit?
- Why hasn't it sold? Are there any deal-killer items the seller is aware of (foundation, flood, title, zoning, code violations)?
- Is there a deadline driving the sale (1031 exchange, divorce, estate, relocation)? That informs how much negotiation room exists.
- Schools are D-rated, which usually means shorter tenancies and higher turnover. Who's the typical renter profile here, and what's been the actual vacancy rate?
- What's the average days-on-market for RENTAL listings here right now (not sales)? A rising rental-DOM trend means longer vacancies and softer asking-rent achievability than the comps imply.
- What's the recent tenant-quality profile in this submarket — average credit score on applications, eviction rate, late-payment / NSF rate, and stable-employment percentage? A property-management company in the area should have these aggregated.
- How much new for-sale + rental construction is in the pipeline within 1–3 miles? Heavy new supply typically softens prices + rents 12–24 months out; constrained supply supports both.
Investment metrics
- 1% rule
- 1.01% ✓
- Cap rate
- 8.31%
- Cash-on-cash
- 7.19%
- DSCR
- 1.32
- GRM
- 8.2
CMA / ARV
- ARV (on-the-fly)
- $216,151
- Comps found
- 12
Show comp detail 12 sales within ~0.75 mi
| Address | Dist | Beds/Ba | Sqft | Sold | Price | $/sf | Match |
|---|---|---|---|---|---|---|---|
| 4364 W Avenida De Golf | 0.18mi | 3/1.5 | 1,325 (+4%) | 2mo | $225,000 | $170 | 82 |
| 4233 W Avenida De Golf | 0.28mi | 3/2.0 | 1,300 (+2%) | 1mo | $181,500 | $140 | 80 |
| 5306 Catalina St | 0.27mi | 3/1.0 | 1,326 (+4%) | 3mo | $150,000 | $113 | 79 |
| 4361 W Avenida De Golf | 0.21mi | 3/1.5 | 1,371 (+7%) | 3mo | $204,000 | $149 | 74 |
| 4460 Santa Villa Dr | 0.22mi | 3/1.5 | 1,400 (+10%) | 4mo | $215,000 | $154 | 69 |
| 5270 Barcelona St | 0.34mi | 3/2.0 | 1,353 (+6%) | 4mo | $228,000 | $169 | 67 |
| 4250 Avenida San Marcus | 0.39mi | 3/2.0 | 1,326 (+4%) | 6mo | $230,000 | $173 | 66 |
| 5247 Catalina St | 0.30mi | 3/2.0 | 1,430 (+12%) | 3mo | $251,000 | $176 | 60 |
| 4520 Struth Ln | 0.41mi | 3/2.0 | 1,426 (+12%) | 6mo | $195,000 | $137 | 53 |
| 4412 Copperwood Pl | 0.39mi | 3/2.0 | 1,442 (+13%) | 4mo | $305,000 | $212 | 53 |
| 4175 Bell Ln | 0.71mi | 3/2.0 | 1,200 (-6%) | 4mo | $209,200 | $174 | 50 |
| 4327 Chantilly Way | 0.72mi | 3/2.0 | 1,385 (+8%) | 6mo | $210,000 | $152 | 44 |
Match score weights: distance 35% · size 25% · config 20% · recency 20%. Top-matched comps best support the ARV.
Projected returns pro-forma
-3.0% appreciation · 2.72% rent growth · sell at horizon
- IRR
- -5.6%
- Equity multiple
- 0.79×
- Total profit
- $-11,643
- Equity at exit
- $29,806
- IRR
- 3.7%
- Equity multiple
- 1.27×
- Total profit
- $14,874
- Equity at exit
- $17,284
Cash invested: $55,972 (down + closing). Projections, not guarantees.
Landlord ↔ Tenant lean methodology
- Overall (STATE)
- 87 Strongly Landlord-Friendly
- State Florida
- 87 Strongly Landlord-Friendly · R+3
- County
- — inherits STATE
- City
- — inherits STATE
ZIP-level market 32571
- Home prices YoY
- -17.7%
- Rents YoY
- 2.7%
- Active inventory
- 665
- Price-to-rent
- 8.2×
Monthly cashflow live
- Estimated rent
- $2,020 high interval (Pro) →
- Mortgage (P&I)
- −$1,048
- Tax from tax record
- −$129 /mo · $1,548/yr
- Insurance
- −$83
- HOA
- −$0
- Vacancy / Maint / Mgmt
- −$424
- Net cashflow
- $335
Break-even live
Sensitivity live
| Price | -10% $449 | -5% $392 | +0% $335 | +5% $279 | +10% $222 |
|---|---|---|---|---|---|
| Rent | -10% $176 | -5% $256 | +0% $335 | +5% $415 | +10% $495 |
| Rate | -1.0pp $436 | -0.5pp $386 | base $335 | +0.5pp $284 | +1.0pp $231 |
UW: 25.0% down · 7.5% · 30yr · 1.5% tax · 5.0% vac · 8.0% maint · 8.0% mgmt
Financing live
Cash to close
- Down payment
- $49,975
- Closing costs
- $5,997
- Reserves months
- —
- Total cash needed
- —
Loan-product check · same deal, 3 products live
Conventional
25% down · 7.5% · 30yr
- Down + closing
- —
- Monthly P&I
- —
- Monthly cashflow
- —
- DSCR
- —
- Eligible?
- —
Personal DTI + credit; lowest rate.
DSCR
20% down · 8.5% · 30yr
- Down + closing
- —
- Monthly P&I
- —
- Monthly cashflow
- —
- DSCR
- —
- Eligible?
- —
No personal income docs; deal must DSCR.
Hard money
10% down · 12.0% · 12mo
- Down + closing
- —
- Monthly P&I
- —
- Monthly cashflow
- —
- DSCR
- —
- Eligible?
- —
Short-term bridge; refi at stabilization.
Rent comps 10 comps
| Address | Beds | Baths | Sqft | Rent | $/sqft | DOM | Units | Dist |
|---|---|---|---|---|---|---|---|---|
| 4933 Bell Ridge Ln Milton, FL | 1.0–3.0 | 1.0–2.0 | 865 | $1,437 | $1.66 | 14d | 8 | 0.70mi |
| 4624 Malay Cir Milton, FL | 4.0 | 2.0 | 1787 | $2,085 | $1.17 | 14d | 1 | 1.01mi |
| 4530 Chantilly Way Milton, FL | 3.0 | 2.0 | 1629 | $1,750 | $1.07 | 24d | 1 | 1.09mi |
| 5061 Peach Dr Milton, FL | 3.0 | 2.5 | 1581 | $1,850 | $1.17 | 24d | 1 | 1.11mi |
| 4836 Covenant Cir Milton, FL | 3.0 | 2.0 | 1590 | $1,875 | $1.18 | 14d | 1 | 1.12mi |
| 5157 Peach Dr Milton, FL | 3.0 | 2.0 | 1788 | $2,100 | $1.17 | 14d | 1 | 1.25mi |
| 4413 Oak Vista Ln Milton, FL | 1.0–3.0 | 1.0–2.0 | 992 | $2,354 | $2.37 | 14d | 18 | 1.32mi |
| 4496 Fiske St Milton, FL | 3.0 | 2.0 | 1418 | $1,850 | $1.30 | 14d | 1 | 1.33mi |
| 5240 Peach Dr Unit NA Milton, FL | 4.0 | 2.0 | 1800 | $2,175 | $1.21 | 24d | 1 | 1.41mi |
| 5320 Cornwall Dr Milton, FL | 3.0 | 2.0 | 1703 | $2,200 | $1.29 | 14d | 1 | 1.48mi |
Listing history 22 events
-
2026-06-18days on market $199,900 Active 65 DOM
-
2026-06-17days on market $199,900 Active 64 DOM
-
2026-06-16days on market $199,900 Active 63 DOM
-
2026-06-15days on market $199,900 Active 62 DOM
-
2026-06-14days on market $199,900 Active 60 DOM
-
2026-06-10days on market $199,900 Active 57 DOM
-
2026-06-09days on market $199,900 Active 56 DOM
-
2026-06-08days on market $199,900 Active 55 DOM
-
2026-06-07days on market $199,900 Active 54 DOM
-
2026-06-05days on market $199,900 Active 51 DOM
-
2026-06-03days on market $199,900 Active 50 DOM
-
2026-06-02days on market $199,900 Active 49 DOM
-
2026-06-01days on market $199,900 Active 48 DOM
-
2026-05-31days on market $199,900 Active 47 DOM
-
2026-05-31days on market $199,900 Active 46 DOM
-
2026-04-14$199,900 Active
-
2012-08-03historical
-
2012-01-06$79,900
-
1999-03-12soldstatus $40,300
-
1991-08-01soldstatus $35,600
-
1985-07-01soldstatus $33,000
-
1980-03-01soldstatus $28,500
ⓘ Source: listings_history table (triggers on properties + properties_extension) + one-shot
backfill from property_details.listing_events for pre-trigger history.
Tax reassessment forecast FL · Resets to sale price
- Current annual tax
- $1,548 · $129/mo
- Projected year-2 tax
- $1,659 · $138/mo
- Expected delta
- +$111/yr (+$9/mo · 7.2%)
ⓘ Screening estimate from a state-policy table — verify with the county assessor before closing.
Climate risk First Street
- Flood 1/10 Low FEMA zone X (unshaded) · 0% chance over 30 yrs
- Wildfire 3/10 Moderate
- Heat 9/10 Extreme 7 d/yr ≥105°F today · 21 d/yr by 30 yrs out
- Wind 9/10 Extreme 99% chance of damaging wind over 30 yrs
- Air quality 1/10 Low 0 unhealthy d/yr today · 0 by 30 yrs out
Nearby sold comps map
Loading sold comps map…
Walkable amenities ~0.75 mi
Loading nearby amenities…
Taxation est. · year 1
- Rental income
- $24,243
- − Mortgage interest
- −$11,198
- − Property taxes
- −$1,548
- − Insurance
- −$1,000
- − Repairs & maintenance
- −$1,939
- − Management
- −$1,939
- − Depreciation
- −$5,815
- Taxable income
- $804
- Est. tax owed @ 24.0%
- −$193
- After-tax cash flow
- $3,832/yr
For passive investors: Depreciation is non-cash, so a rental often shows a tax loss while cash-flowing — sheltering income. Rental losses are passive: they offset passive income freely, and up to $25,000/yr can offset ordinary (W-2) income if you actively participate and your MAGI is under $100k (phasing out to $0 by $150k); unused losses carry forward. On sale, claimed depreciation is recaptured at up to 25%, and gains may owe capital-gains tax (a 1031 exchange can defer both). Figures are a year-1 estimate at your 24.0% rate — not tax advice; consult a CPA.
Schools (NCES district)
- District
- Santa Rosa
- NCES district ID
- 1201650
- Math proficiency
- 63% ▼ -6.00%
- Reading proficiency
- 60% ▼ -5.00%
- Median HH income
- $58,161
- Composite
- 53.12/100
- National rank
- #1511
- State rank
- #8 of 73 in FL
Livability — Pea Ridge
- Score
- 69/100
- State rank
- #459
- US rank
- #8316
Category grades
Schools grade is shown separately in the Schools card above.
Census & demographics
- Census place
- Pea Ridge, FL
- County
- Santa Rosa County · 194,764 people
- Metro
- Pensacola-Ferry Pass-Brent, FL
- Population (ZIP)
- 42,171
- Household income
- $87,617
- Rent vs Own
- Severe rent burden
- 301.0
Population outlook (Santa Rosa County) Hauer SSP2
- Today (2025)
- 195,978 people
- By 2030
- 209,782 · +7.0%
- By 2040
- 235,293 · +20.1%
- By 2050
- 256,408 · +30.8%
- By 2075
- 298,074 · +52.1%
- By 2100
- 303,216 · +54.7%
Race, ethnicity, and origin ACS 2023
- Neighborhood character
- Predominantly White (80%)
- Race & ethnicity
- White 80% Two or more races 9% Hispanic / Latino 6% Black 4% Asian 2%
- Hispanic origin (detail)
- Mexican 3%
- Common ancestry
- Lithuanian 4% Italian 3% Slovak 2%
- Foreign-born
- 6% · Canada, South Korea
- Languages at home
- 93% English-only · Spanish 2% Other Indo-European 1% Russian/Polish/Slavic 1%
Political lean MEDSL · Santa Rosa
- 2024 margin
- Solid R (+51.0) · D 24.1% · R 75.0%
- 2008→2024 swing
- -3.0pp toward R · 2008: -47.9pp · 2024: -51.0pp
- All cycles
- 2024: R+51.0 2020: R+46.5 2016: R+53.5 2012: R+52.6 2008: R+47.9
Not yet ingested
- Civics
- —
Market trends
- HPI YoY
- ▼ -62.39%
- Current HPI
- 290.2953
- Rent YoY
- ▲ 2.72%
- Metro
- Pensacola-Ferry Pass-Brent, FL
- State GDP YoY
- ▲ 3.28%
- F500 in state
- 36
Industry mix (Fortune 500 HQ in FL)
| Industry | F500 HQs | Revenue |
|---|---|---|
| Industrial Technology | 2 | $29B |
|
||
| Insurance | 2 | $17B |
|
||
| Retail | 1 | $60B |
|
||
| Technology Distribution | 1 | $58B |
|
||
| Homebuilding | 1 | $35B |
|
||
| Technology Manufacturing | 1 | $35B |
|
||
Price history
+601.4% since first listed7 events — show timeline
- 2026-04-14 Listed $199,900 PARMLS
- 2012-08-03 Listing Removed — PARMLS
- 2012-01-06 Listed $79,900 PARMLS
- 1999-03-12 Sold (Public Records) $40,300 Public Records
- 1991-08-01 Sold (Public Records) $35,600 Public Records
- 1985-07-01 Sold (Public Records) $33,000 Public Records
- 1980-03-01 Sold (Public Records) $28,500 Public Records
Property tax history
+5.8%/yrLatest (2025): $1,548 · +6.1% YoY. Source: county tax records.
Cash-flow waterfall
monthlySold comps — $/sqft
last 12 mo · ≤1 miLoading sold comps…