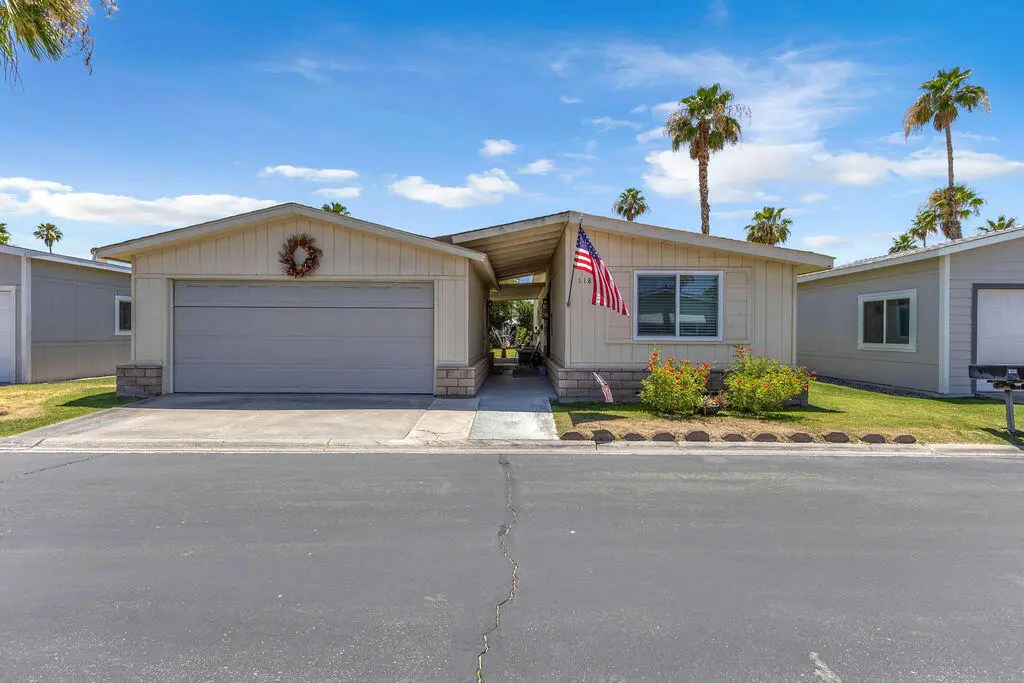
1185 Via Fresno · Cathedral City, CA
Flood risk 1/10 · Minimal
- FEMA flood zone
- X (unshaded)
- Chance of flooding over 30 yrs
- 0.0%
- Est. flood insurance / yr
- $507 – $1,088
Fire risk 1/10 · Minimal
- Est. fire insurance / yr
- $659 – $1,223
Heat risk 9/10 · Severe
- Hot days now (above 113°F)
- 7 days/yr
- Hot days in 30 yrs
- 20 days/yr
Wind risk 1/10 · Minimal
- Chance of severe wind over 30 yrs
- —
Air-quality risk 5/10 · Moderate
- Unhealthy air days now
- 6 days/yr
- Unhealthy air days in 30 yrs
- 8 days/yr
Risk factors via First Street. Map © Google.
Why this score? — see what drove the C+ grade
The composite is a weighted blend of 9 inputs, each scored 0–100. Each bar is that input's sub-score; the figure is the points it added to the 100-point composite (weight × sub-score).
- Cash flow +30.0/30.0
- DSCR +10.0/10.0
- 1% rule +9.7/10.0
- Rent growth +3.3/5.0
- Livability +3.3/5.0
- Schools +2.7/10.0
- Condition / age +2.5/5.0
- ARV discount +0.0/15.0
- Appreciation +0.0/10.0
$145,000
🖨 Deal sheet (PDF) 📄 Offer letter ✓ Due diligence
Listing remarks MLS
SELLER MOTIVATED!! Desert Sands Mobile Home Park, A 55+ Gated Community Is Centrally Located To Cathedral City Shopping Center. This 1985 home features 2 bedrooms and 1 bathroom, with kitchen appliances included, ceiling fans, washer & dryer. Includes Central A/C & Heating, Evaporative Cooler and Wall/Window unit. Desert Sands offers a completely remodeled and spacious clubhouse with a large ballroom, pool and hot tub, sauna, fitness center, and tennis courts. This property offers its residents picturesque living with an active social community. Buyers must be park approved, have good credit, have 3 times the space rent in income. Dogs under 21 lbs ok! Pay $838.09 Per Month. Breakdown of Space Rent $797, Sewer $24.50, & Trash $16.59 per month. Buyers must be park approved, have good credit, have 3 times the space rent in income. * * Inquire with the listing agent on who can approve your mortgage for Desert Sands today!!
Key facts
- Newer ac unit
- Generously sized lot
- Covered patio
Tags
Property features AI
Finance
- Other: CC & R disclosures; Listing terms: Cash or cash to new loan; Possession at close of escrow; Short-term rentals not allowed; Will not consider lease
- Financial info: Land lease purchase available; Annual land lease amount: $11,100; Monthly space rent: $925.00
- HOA & community: Senior community; Gated community; No monthly association fee
Exterior
- Parking: Detached 2-car garage; Driveway; 2 total parking spaces
- Security: Automatic gate; Gated community
- Utilities: Water: Water district (DWA); Sewer: In street, paid; PUD: No
- Home design: Detached single-wide mobile home; Traditional style; One level; View faces mountains
- Construction: Skirted with block; Year built (assessor source)
- Exterior features: Automatic gate; Gated community; Awnings on patio; Street lights; Mountain view; Lease land type
Interior
- Kitchen: Refrigerator; Gas range; Dishwasher
- Bedrooms: Other room(s)
- Flooring: Carpet; Vinyl
- Bathrooms: 1 full bathroom
- Heating & cooling: Central heating; Central air; Ceiling fan(s)
- Interior features: Unfurnished; No fireplace
- Laundry & utility: Washer; Dryer; Tankless water heater
Neighborhood map
What this means for you Summary
Snapshot
- This is a 2-bed/1.0-bath manufactured listed at $145k.
Deal economics
- At list price, monthly cash flow is $686 ($8k/yr) — positive.
- The deal already cash-flows at list — no discount required.
- Meets the 1% rule at list price ($2k rent vs $145k).
- Recommended offer: $143k (1.5% below list) — sets the bar for market timing.
- Cap rate 12.0% vs local median 5.1% in Cathedral City — top-decile yield for the area; either an underpriced asset or a hidden risk that comps aren't pricing in. Stress-test before assuming the spread holds.
Location & tenants
- Location reads 66/100 on livability (#344 in CA) — a middle-class / working-renter tenant base. Strengths: commute A+, housing B+; Watch: employment D+, schools F, amenities D-.
- Palm Springs Unified (suburban): math 21% / reading 42% proficiency, ranked #328 of 517 in CA (top 63%) — families likely to look elsewhere, expect single-tenant / working-renter base with shorter leases; 73% free/reduced lunch — lower-income household profile, screen leases tightly.
- Market conditions: Rents rising (+3.2%/yr); 530 active listings in the ZIP; 20 comparable units currently listed for rent nearby; rentals at typical pace (median 26d on market — plan ~3-4 weeks tenant-placement turnaround); 40% of comp listings sitting > 30 days — soft ceiling on asking rent; 9,195 units permitted in Riverside County in 2024 (1,512 in 5+ unit buildings).
- This rent runs 35% of the median local income ($74k/yr) — at the standard rent-burdened threshold; future hikes will face affordability resistance.
Forward outlook
- Local home prices are declining (-3.0%/yr); year-one equity from $1k of loan paydown is wiped out by about $4k of value loss. Plan a longer hold.
- Riverside County population projected at +22% by 2050 — long-run rental-demand tailwind backs the buy-and-hold thesis.
- At projected returns (-3.0% appreciation + 3.2% rent growth), your $41k cash investment doubles in ~6 years — after that, you're playing with house money.
Negotiation context
- It's been on market 17 days — a 2% lower offer ($143k) is reasonable based on typical stale-listing flexibility.
- 5 sale attempts since 7y ago with the ask held roughly flat each time — persistent listings suggest the price (not the market) is what's stuck; bring a comps-based counter.
- Current owner paid $78k; list at $145k implies a 85% gain — meaningful room to come down on a strong offer.
Risks & watch-outs
- Climate carrying-cost: extreme-heat days projected 7→20/yr by 2055 (HVAC capex compounding) — expect insurance premiums to compound above CPI over the hold.
Questions for the listing agent
- Is there a deadline driving the sale (1031 exchange, divorce, estate, relocation)? That informs how much negotiation room exists.
- Schools are F-rated, which usually means shorter tenancies and higher turnover. Who's the typical renter profile here, and what's been the actual vacancy rate?
- What's the average days-on-market for RENTAL listings here right now (not sales)? A rising rental-DOM trend means longer vacancies and softer asking-rent achievability than the comps imply.
- What's the recent tenant-quality profile in this submarket — average credit score on applications, eviction rate, late-payment / NSF rate, and stable-employment percentage? A property-management company in the area should have these aggregated.
- How much new for-sale + rental construction is in the pipeline within 1–3 miles? Heavy new supply typically softens prices + rents 12–24 months out; constrained supply supports both.
Investment metrics
- 1% rule
- 1.47% ✓
- Cap rate
- 11.97%
- Cash-on-cash
- 20.27%
- DSCR
- 1.90
- GRM
- 5.7
CMA / ARV
- ARV (on-the-fly)
- $108,192
- Comps found
- 1
Show comp detail 1 sale within ~0.75 mi
| Address | Dist | Beds/Ba | Sqft | Sold | Price | $/sf | Match |
|---|---|---|---|---|---|---|---|
| 1077 Via Grande | 0.17mi | 2/2.0 | 860 (+10%) | 12mo | $119,000 | $138 | 62 |
Match score weights: distance 35% · size 25% · config 20% · recency 20%. Top-matched comps best support the ARV.
Projected returns pro-forma
-3.0% appreciation · 3.22% rent growth · sell at horizon
- IRR
- 12.8%
- Equity multiple
- 1.51×
- Total profit
- $20,687
- Equity at exit
- $21,620
- IRR
- 21.8%
- Equity multiple
- 2.88×
- Total profit
- $76,340
- Equity at exit
- $12,537
Cash invested: $40,600 (down + closing). Projections, not guarantees.
Landlord ↔ Tenant lean methodology
- Overall (STATE)
- 18 Strongly Tenant-Friendly
- State California
- 18 Strongly Tenant-Friendly · D+13
- County
- — inherits STATE
- City
- — inherits STATE
ZIP-level market 92234
- Home prices YoY
- -27.7%
- Rents YoY
- 3.2%
- Active inventory
- 530
- Price-to-rent
- 5.7×
Monthly cashflow live
- Estimated rent
- $2,136 high interval (Pro) →
- Mortgage (P&I)
- −$760
- Tax est. 1.5%
- −$181 /mo · $2,175/yr
- Insurance
- −$60
- HOA
- −$0
- Vacancy / Maint / Mgmt
- −$449
- Net cashflow
- $686
Break-even live
Sensitivity live
| Price | -10% $786 | -5% $736 | +0% $686 | +5% $636 | +10% $586 |
|---|---|---|---|---|---|
| Rent | -10% $517 | -5% $601 | +0% $686 | +5% $770 | +10% $855 |
| Rate | -1.0pp $759 | -0.5pp $723 | base $686 | +0.5pp $648 | +1.0pp $610 |
UW: 25.0% down · 7.5% · 30yr · 1.5% tax · 5.0% vac · 8.0% maint · 8.0% mgmt
Financing live
Cash to close
- Down payment
- $36,250
- Closing costs
- $4,350
- Reserves months
- —
- Total cash needed
- —
Loan-product check · same deal, 3 products live
Conventional
25% down · 7.5% · 30yr
- Down + closing
- —
- Monthly P&I
- —
- Monthly cashflow
- —
- DSCR
- —
- Eligible?
- —
Personal DTI + credit; lowest rate.
DSCR
20% down · 8.5% · 30yr
- Down + closing
- —
- Monthly P&I
- —
- Monthly cashflow
- —
- DSCR
- —
- Eligible?
- —
No personal income docs; deal must DSCR.
Hard money
10% down · 12.0% · 12mo
- Down + closing
- —
- Monthly P&I
- —
- Monthly cashflow
- —
- DSCR
- —
- Eligible?
- —
Short-term bridge; refi at stabilization.
Rent comps 20 comps
| Address | Beds | Baths | Sqft | Rent | $/sqft | DOM | Units | Dist |
|---|---|---|---|---|---|---|---|---|
| 33255 Date Palm Dr Cathedral City, CA | 2.0 | 2.0 | 1050 | $1,795 | $1.71 | 45d | 1 | 0.34mi |
| 32425 Rancho Vista Dr Unit A Cathedral City, CA | 2.0 | 1.0 | 754 | $1,950 | $2.59 | 9d | 1 | 0.34mi |
| 32585 Cielo Vista Rd Cathedral City, CA | 2.0 | 2.0 | 840 | $2,000 | $2.38 | 25d | 1 | 0.36mi |
| 32150 Aurora Vista Rd Cathedral City, CA | 2.0 | 1.0 | 1100 | $2,195 | $2.00 | 45d | 1 | 0.54mi |
| 32150 Aurora Vista Rd Unit C Cathedral City, CA | 2.0 | 1.0 | 1100 | $2,395 | $2.18 | 45d | 1 | 0.54mi |
| 69801 Ramon Rd #115 Cathedral City, CA | 1.0 | 1.0 | 600 | $1,600 | $2.67 | 16d | 1 | 0.64mi |
| 69155 Dinah Shore Dr Cathedral City, CA | 2.0 | 2.0 | 1100 | $1,795 | $1.63 | 45d | 1 | 0.66mi |
| 32200 Cathedral Canyon Dr #31 Cathedral City, CA | 1.0 | 1.0 | 740 | $1,550 | $2.09 | 25d | 1 | 0.69mi |
| 34073 Emily Way Rancho Mirage, CA | 2.0 | 2.0 | 966 | $2,100 | $2.17 | 19d | 1 | 0.77mi |
| 34073 Emily Way Rancho Mirage, CA | 2.0 | 2.0 | 966 | $2,100 | $2.17 | 23d | 1 | 0.77mi |
| 33495 Cathedral Canyon Dr Unit B Cathedral City, CA | 2.0 | 1.0 | 1100 | $2,100 | $1.91 | 45d | 1 | 0.77mi |
| 33495 Cathedral Canyon Dr Cathedral City, CA | 2.0 | 1.0 | 1100 | $2,200 | $2.00 | 45d | 1 | 0.77mi |
| 69646 Antonia Way Rancho Mirage, CA | 2.0 | 2.0 | 966 | $2,450 | $2.54 | 19d | 1 | 0.93mi |
| 33030 Shifting Sands Trl Apt 4 Cathedral City, CA | 2.0 | 1.0 | 821 | $1,599 | $1.95 | 25d | 1 | 0.99mi |
| 31520 Landau Blvd Unit 3 Cathedral City, CA | 1.0 | 1.0 | 950 | $1,650 | $1.74 | 0d | 1 | 1.33mi |
| 31200 Landau Blvd Cathedral City, CA | 2.0–3.0 | 2.0 | 1016 | $2,300 | $2.26 | 45d | 3 | 1.35mi |
| 31200 Landau Blvd Cathedral City, CA | 2.0–3.0 | 2.0 | 1016 | $2,195 | $2.16 | 13d | 4 | 1.35mi |
| 68185 Alcita Rd Cathedral City, CA | 2.0 | 2.0 | 975 | $1,895 | $1.94 | 3d | 1 | 1.37mi |
| 30125 Avenida Juarez Unit 30127 Cathedral City, CA | 3.0 | 2.0 | 1000 | $2,499 | $2.50 | 16d | 1 | 1.43mi |
| 35615 Paseo Circulo E Cathedral City, CA | 1.0 | 2.0 | 1029 | $2,250 | $2.19 | 45d | 1 | 1.45mi |
Listing history 11 events
-
2026-06-21days on market $145,000 Active 17 DOM
-
2026-06-18days on market $145,000 Active 14 DOM
-
2026-06-17days on market $145,000 Active 13 DOM
-
2026-06-16days on market $145,000 Active 12 DOM
-
2026-06-15days on market $145,000 Active 11 DOM
-
2026-06-13days on market $145,000 Active 9 DOM
-
2026-06-13days on market $145,000 Active 8 DOM
-
2026-06-09days on market $145,000 Active 5 DOM
-
2026-06-08days on market $145,000 Active 4 DOM
-
2026-06-07remarks 699-char remark
-
2026-06-07$145,000 Active 3 DOM
ⓘ Source: listings_history table (triggers on properties + properties_extension) + one-shot
backfill from property_details.listing_events for pre-trigger history.
Climate risk First Street
- Flood 1/10 Low FEMA zone X (unshaded) · 0% chance over 30 yrs
- Wildfire 1/10 Low
- Heat 9/10 Extreme 7 d/yr ≥113°F today · 20 d/yr by 30 yrs out
- Wind 1/10 Low
- Air quality 5/10 Major 6 unhealthy d/yr today · 8 by 30 yrs out
Nearby sold comps map
Loading sold comps map…
Walkable amenities ~0.75 mi
Loading nearby amenities…
Taxation est. · year 1
- Rental income
- $25,638
- − Mortgage interest
- −$8,122
- − Property taxes
- −$2,175
- − Insurance
- −$725
- − Repairs & maintenance
- −$2,051
- − Management
- −$2,051
- − Depreciation
- −$4,218
- Taxable income
- $6,295
- Est. tax owed @ 24.0%
- −$1,511
- After-tax cash flow
- $6,718/yr
For passive investors: Depreciation is non-cash, so a rental often shows a tax loss while cash-flowing — sheltering income. Rental losses are passive: they offset passive income freely, and up to $25,000/yr can offset ordinary (W-2) income if you actively participate and your MAGI is under $100k (phasing out to $0 by $150k); unused losses carry forward. On sale, claimed depreciation is recaptured at up to 25%, and gains may owe capital-gains tax (a 1031 exchange can defer both). Figures are a year-1 estimate at your 24.0% rate — not tax advice; consult a CPA.
Schools (NCES district)
- District
- Palm Springs Unified
- NCES district ID
- 0629550
- Math proficiency
- 21% ▼ -7.00%
- Reading proficiency
- 42% ▬ 0.00%
- Median HH income
- $43,638
- Composite
- 26.76/100
- National rank
- #7131
- State rank
- #328 of 517 in CA
Livability — Cathedral City
- Score
- 66/100
- State rank
- #344
- US rank
- #11749
Category grades
Schools grade is shown separately in the Schools card above.
Census & demographics
- Census place
- Cathedral City, CA
- County
- Riverside County · 2,287,001 people
- City population
- 52,267
- Metro
- Riverside-San Bernardino-Ontario, CA
- Population (ZIP)
- 52,267
- Household income
- $73,572
- Rent vs Own
- Severe rent burden
- 1682.0
Population outlook (Riverside County) Hauer SSP2
- Today (2025)
- 2,664,475 people
- By 2030
- 2,802,692 · +5.2%
- By 2040
- 3,050,904 · +14.5%
- By 2050
- 3,256,783 · +22.2%
- By 2075
- 3,655,058 · +37.2%
- By 2100
- 3,766,594 · +41.4%
Race, ethnicity, and origin ACS 2023
- Neighborhood character
- Diverse neighborhood (Simpson 0.56)
- Race & ethnicity
- Hispanic / Latino 59% White 30% Two or more races 27% Asian 6% Native American 2% Black 2%
- Hispanic origin (detail)
- Mexican 51%
- Common ancestry
- Lithuanian 2% Romanian 1% Italian 1%
- Foreign-born
- 28% · Canada, Vietnam
- Languages at home
- 48% English-only · Spanish 46% Tagalog/Filipino 3% Other Asian/Pacific 1%
Political lean MEDSL · Riverside
- 2024 margin
- Toss-up / Even · D 48.0% · R 49.3% · Other 2.6%
- 2008→2024 swing
- -3.6pp toward R · 2008: 2.3pp · 2024: -1.3pp
- All cycles
- 2024: R+1.3 2020: D+8.0 2016: D+4.3 2012: R+0.4 2008: D+2.3
Not yet ingested
- Civics
- —
Market trends
- HPI YoY
- ▼ -136.57%
- Current HPI
- 356.9845
- Rent YoY
- ▲ 3.22%
- Metro
- Riverside-San Bernardino-Ontario, CA
- State GDP YoY
- ▲ 3.21%
- F500 in state
- 116
Industry mix (Fortune 500 HQ in CA)
| Industry | F500 HQs | Revenue |
|---|---|---|
| Technology | 27 | $1,492B |
|
||
| Financial Services | 3 | $174B |
|
||
| Retail | 3 | $44B |
|
||
| Insurance | 3 | $26B |
|
||
| Media / Entertainment | 2 | $115B |
|
||
| Pharmaceuticals / Biotech | 2 | $62B |
|
||
Price history
+353.1% since first listed15 events — show timeline
- 2026-05-29 Listed $145,000 GPSMLS
- 2022-04-01 Sold (MLS) $78,500 TheMLS
- 2022-03-10 Pending — TheMLS
- 2022-01-24 Contingent — TheMLS
- 2021-12-23 Relisted — TheMLS
- 2021-12-16 Price Changed $89,000 TheMLS
- 2021-09-17 Listed $85,000 TheMLS
- 2019-12-25 Listing Removed — GPSMLS
- 2019-12-24 Pending — GPSMLS
- 2019-12-24 Sold (MLS) $25,000 GPSMLS
- 2019-10-07 Contingent — GPSMLS
- 2019-09-27 Relisted — GPSMLS
- 2019-07-31 Contingent — GPSMLS
- 2019-07-02 Price Changed $28,000 GPSMLS
- 2019-05-29 Listed $32,000 GPSMLS
Property tax history
-0.9%/yrLatest (2025): $242 · -1.4% YoY. Source: county tax records.
Cash-flow waterfall
monthlySold comps — $/sqft
last 12 mo · ≤1 miLoading sold comps…