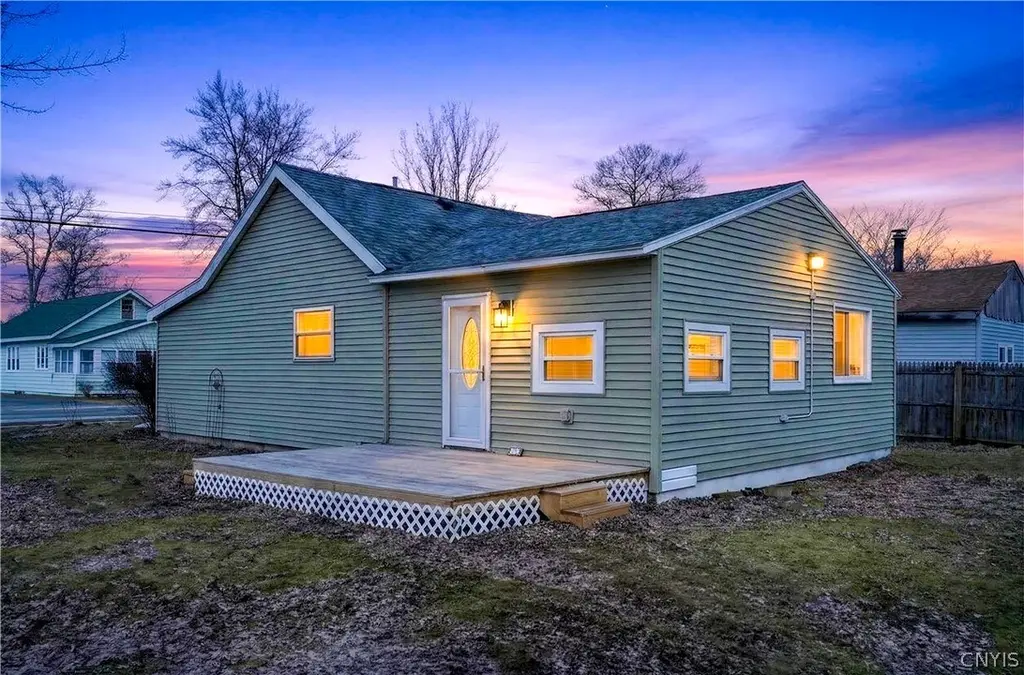
2310 Main St · Sylvan Beach, NY
Flood risk 1/10 · Minimal
- FEMA flood zone
- X (unshaded)
- Chance of flooding over 30 yrs
- 0.0%
- Est. flood insurance / yr
- $507 – $1,088
Fire risk 3/10 · Minor
- Est. fire insurance / yr
- $691 – $1,283
Heat risk 3/10 · Minor
- Hot days now (above 94°F)
- 7 days/yr
- Hot days in 30 yrs
- 16 days/yr
Wind risk 1/10 · Minimal
- Chance of severe wind over 30 yrs
- 0.0%
Air-quality risk 2/10 · Minimal
- Unhealthy air days now
- 0 days/yr
- Unhealthy air days in 30 yrs
- 1 days/yr
Risk factors via First Street. Map © Google.
Why this score? — see what drove the D grade
The composite is a weighted blend of 9 inputs, each scored 0–100. Each bar is that input's sub-score; the figure is the points it added to the 100-point composite (weight × sub-score).
- ARV discount +14.5/15.0
- Appreciation +10.0/10.0
- Cash flow +6.4/30.0
- Schools +3.5/10.0
- Livability +2.8/5.0
- Rent growth +2.5/5.0
- Condition / age +2.5/5.0
- 1% rule +1.6/10.0
- DSCR +0.7/10.0
$199,000
🖨 Deal sheet (PDF) 📄 Offer letter ✓ Due diligence
Listing remarks MLS
Prime Sylvan Beach location on Main Street, directly across from the water and beach. Set on a double lot with deeded lake rights, offering a rare combination of space, location, and flexibility. This property offers potential for Airbnb or short term rental, long term rental, owner occupied, vacation home, or full year living. Enjoy a true walkable setting with restaurants, shops, the amusement park, and boat launch nearby, plus close proximity to the casino and an easy drive to Syracuse. Major updates include a newer roof (1 year), HVAC with propane furnace and central air (5 years), hot water heater (5 years), vinyl siding, new deck, updated kitchen flooring, newer carpet, insulated front door and storm door (5 years), and a newer dishwasher. Interior has been freshly painted, along with added features like a screened gazebo with electric, shed, ceiling fans, mounted TVs, and more. The extra lot provides additional space and future potential. A strong opportunity combining location, updates, and versatility.
Key facts
- Built 1940
Neighborhood map
What this means for you Summary
Snapshot
- This is a 2-bed/1.0-bath single-family listed at $199k.
Deal economics
- At list price, monthly cash flow is $-342 ($-4k/yr) — negative.
- To cash-flow at today's rent, offer at most $150k (24.9% below list).
- To meet the 1% rule (rent ≥ 1% of price), the offer needs to be $131k (34.3% below list).
- Recommended offer: $131k (34.3% below list) — sets the bar for 1% rule.
- Cap rate 4.2% vs local median 2.3% in Sylvan Beach — top-decile yield for the area; either an underpriced asset or a hidden risk that comps aren't pricing in. Stress-test before assuming the spread holds.
Location & tenants
- Location reads 56/100 on livability (#1,110 in NY) — a working-class tenant base; expect higher turnover. Strengths: cost of living A+, housing A+; Watch: employment D+, crime F, amenities F.
- Camden Central School District (rural): math 34% / reading 48% proficiency, ranked #504 of 590 in NY (top 85%) — families likely to look elsewhere, expect single-tenant / working-renter base with shorter leases.
- Zoned schools: Mcconnellsville Elementary School (math 22% / reading 57%, grade F, #1,444 of 2,108 statewide, top 71%, 260 students, 41% FRL); Camden Middle School (math 17% / reading 42%, grade F, #550 of 729 statewide, top 77%, 580 students, 48% FRL); Camden Senior High School (math 92% / reading 75%, grade A, #409 of 1,100 statewide, top 39%, 620 students, 45% FRL) — zoned schools at 45% FRL track the district average.
- Market conditions: 34 active listings in the ZIP; 204 units permitted in Oneida County in 2024 (68 in 5+ unit buildings).
Forward outlook
- In year one you build about $21k of equity ($1k loan paydown + $20k appreciation (10.0% local appreciation)).
- Oneida County population projected at -12% by 2050 — secular population decline; favor cash flow + early exit over multi-decade hold.
- By year 2, paydown + projected appreciation supports a ~$34k cash-out refi (75% LTV) — recoverable capital for the next deal without selling this one.
Negotiation context
- Only 0 days on market — expect competitive offers; lowballing is unlikely to land.
- 11 sale attempts since 17y ago with the ask held roughly flat each time — persistent listings suggest the price (not the market) is what's stuck; bring a comps-based counter.
Risks & watch-outs
- Watch-outs: built in 1940 — expect roof / HVAC / electrical / plumbing capex.
Questions for the listing agent
- What do current leases actually rent for vs. the listed asking? Can we see a recent rent roll and the last 12 months of T-12 income?
- Built in 1940 — when were the roof, HVAC, electrical panel, plumbing, and water heater last replaced?
- Is there a deadline driving the sale (1031 exchange, divorce, estate, relocation)? That informs how much negotiation room exists.
- Schools are F-rated, which usually means shorter tenancies and higher turnover. Who's the typical renter profile here, and what's been the actual vacancy rate?
- Crime grade is F in this area — have there been break-ins, vandalism, or insurance claims at this property in the last 3 years? What carrier currently insures it and at what premium?
- The area grade is low — what's the realistic commute time and amenity access for the typical tenant pool here? Any planned neighborhood developments (good or bad) we should know about?
- What's the average days-on-market for RENTAL listings here right now (not sales)? A rising rental-DOM trend means longer vacancies and softer asking-rent achievability than the comps imply.
- What's the recent tenant-quality profile in this submarket — average credit score on applications, eviction rate, late-payment / NSF rate, and stable-employment percentage? A property-management company in the area should have these aggregated.
- How much new for-sale + rental construction is in the pipeline within 1–3 miles? Heavy new supply typically softens prices + rents 12–24 months out; constrained supply supports both.
Investment metrics
- 1% rule
- 0.66% ✗
- Cap rate
- 4.23%
- Cash-on-cash
- -7.36%
- DSCR
- 0.67
- GRM
- 12.7
CMA / ARV
- ARV (median comp)
- $235,545
- List price
- $199,000
- Delta
- -15.52%
- Verdict
- UNDERPRICED
- Comps
- 20 within 1.0 mi
Show comp detail 5 sales within ~0.75 mi
| Address | Dist | Beds/Ba | Sqft | Sold | Price | $/sf | Match |
|---|---|---|---|---|---|---|---|
| 2317 Pleasant Ave | 0.04mi | 2/1.0 | 988 (-2%) | 3mo | $75,000 | $76 | 92 |
| 2913 Division St | 0.26mi | 3/1.0 (+1) | 1,000 (-1%) | 20mo | $193,000 | $193 | 65 |
| 316 16th Ave | 0.40mi | 3/2.0 (+1) | 990 (-2%) | 12mo | $225,000 | $227 | 59 |
| 2354 Lake Shore Dr | 0.72mi | 3/1.0 (+1) | 1,000 (-1%) | 13mo | $475,000 | $475 | 49 |
| 332 18th Ave | 0.31mi | 3/1.0 (+1) | 1,120 (+11%) | 21mo | $186,000 | $166 | 44 |
Match score weights: distance 35% · size 25% · config 20% · recency 20%. Top-matched comps best support the ARV.
Projected returns pro-forma
10.0% appreciation · 3.0% rent growth · sell at horizon
- IRR
- 19.1%
- Equity multiple
- 2.55×
- Total profit
- $86,620
- Equity at exit
- $179,275
- IRR
- 17.6%
- Equity multiple
- 5.89×
- Total profit
- $272,248
- Equity at exit
- $386,613
Cash invested: $55,720 (down + closing). Projections, not guarantees.
Landlord ↔ Tenant lean methodology
- Overall (STATE)
- 15 Strongly Tenant-Friendly
- State New York
- 15 Strongly Tenant-Friendly · D+10
- County
- — inherits STATE
- City
- — inherits STATE
ZIP-level market 13308
- Home prices YoY
- 28.6%
- Active inventory
- 34
- Price-to-rent
- 12.7×
Monthly cashflow live
- Estimated rent
- $1,308 medium interval (Pro) →
- Mortgage (P&I)
- −$1,044
- Tax est. 1.5%
- −$249 /mo · $2,985/yr
- Insurance
- −$83
- HOA
- −$0
- Vacancy / Maint / Mgmt
- −$275
- Net cashflow
- $-342
Break-even live
Sensitivity live
| Price | -10% $-204 | -5% $-273 | +0% $-342 | +5% $-411 | +10% $-480 |
|---|---|---|---|---|---|
| Rent | -10% $-445 | -5% $-394 | +0% $-342 | +5% $-290 | +10% $-239 |
| Rate | -1.0pp $-242 | -0.5pp $-291 | base $-342 | +0.5pp $-394 | +1.0pp $-446 |
UW: 25.0% down · 7.5% · 30yr · 1.5% tax · 5.0% vac · 8.0% maint · 8.0% mgmt
Financing live
Cash to close
- Down payment
- $49,750
- Closing costs
- $5,970
- Reserves months
- —
- Total cash needed
- —
Loan-product check · same deal, 3 products live
Conventional
25% down · 7.5% · 30yr
- Down + closing
- —
- Monthly P&I
- —
- Monthly cashflow
- —
- DSCR
- —
- Eligible?
- —
Personal DTI + credit; lowest rate.
DSCR
20% down · 8.5% · 30yr
- Down + closing
- —
- Monthly P&I
- —
- Monthly cashflow
- —
- DSCR
- —
- Eligible?
- —
No personal income docs; deal must DSCR.
Hard money
10% down · 12.0% · 12mo
- Down + closing
- —
- Monthly P&I
- —
- Monthly cashflow
- —
- DSCR
- —
- Eligible?
- —
Short-term bridge; refi at stabilization.
Listing history 27 events
-
2026-06-17statusdays on market $199,000 Under Contract
Show marketing remark (1026 chars)
Prime Sylvan Beach location on Main Street, directly across from the water and beach. Set on a double lot with deeded lake rights, offering a rare combination of space, location, and flexibility. This property offers potential for Airbnb or short term rental, long term rental, owner occupied, vacation home, or full year living. Enjoy a true walkable setting with restaurants, shops, the amusement park, and boat launch nearby, plus close proximity to the casino and an easy drive to Syracuse. Major updates include a newer roof (1 year), HVAC with propane furnace and central air (5 years), hot water heater (5 years), vinyl siding, new deck, updated kitchen flooring, newer carpet, insulated front door and storm door (5 years), and a newer dishwasher. Interior has been freshly painted, along with added features like a screened gazebo with electric, shed, ceiling fans, mounted TVs, and more. The extra lot provides additional space and future potential. A strong opportunity combining location, updates, and versatility.
-
2026-05-18historical Active Under Contract 1026-char remark
Show marketing remark (1026 chars)
Prime Sylvan Beach location on Main Street, directly across from the water and beach. Set on a double lot with deeded lake rights, offering a rare combination of space, location, and flexibility. This property offers potential for Airbnb or short term rental, long term rental, owner occupied, vacation home, or full year living. Enjoy a true walkable setting with restaurants, shops, the amusement park, and boat launch nearby, plus close proximity to the casino and an easy drive to Syracuse. Major updates include a newer roof (1 year), HVAC with propane furnace and central air (5 years), hot water heater (5 years), vinyl siding, new deck, updated kitchen flooring, newer carpet, insulated front door and storm door (5 years), and a newer dishwasher. Interior has been freshly painted, along with added features like a screened gazebo with electric, shed, ceiling fans, mounted TVs, and more. The extra lot provides additional space and future potential. A strong opportunity combining location, updates, and versatility.
-
2026-04-20$199,000 Active 1026-char remark
Show marketing remark (1026 chars)
Prime Sylvan Beach location on Main Street, directly across from the water and beach. Set on a double lot with deeded lake rights, offering a rare combination of space, location, and flexibility. This property offers potential for Airbnb or short term rental, long term rental, owner occupied, vacation home, or full year living. Enjoy a true walkable setting with restaurants, shops, the amusement park, and boat launch nearby, plus close proximity to the casino and an easy drive to Syracuse. Major updates include a newer roof (1 year), HVAC with propane furnace and central air (5 years), hot water heater (5 years), vinyl siding, new deck, updated kitchen flooring, newer carpet, insulated front door and storm door (5 years), and a newer dishwasher. Interior has been freshly painted, along with added features like a screened gazebo with electric, shed, ceiling fans, mounted TVs, and more. The extra lot provides additional space and future potential. A strong opportunity combining location, updates, and versatility.
-
2025-12-30historical
-
2025-09-15price $194,900
-
2025-08-18price $199,900
-
2025-08-17historical $1,800
-
2025-08-02price $205,000
-
2025-07-18$1,800
-
2025-07-03price $215,000
-
2025-05-24$229,900 Active
-
2019-01-02historical
-
2018-09-24$124,900
-
2017-10-26soldstatus $80,000
-
2017-07-27$84,500
-
2016-09-25historical
-
2016-03-25$89,500
-
2015-12-19historical
-
2014-09-22historical
-
2014-09-19$89,900
-
2013-07-15$95,000
-
2012-12-15historical
-
2012-06-15$99,900
-
2010-06-25soldstatus $88,000
-
2009-09-09historical
-
2009-09-09$92,900
-
2009-06-09$99,900
ⓘ Source: listings_history table (triggers on properties + properties_extension) + one-shot
backfill from property_details.listing_events for pre-trigger history.
Climate risk First Street
- Flood 1/10 Low FEMA zone X (unshaded) · 0% chance over 30 yrs
- Wildfire 3/10 Moderate
- Heat 3/10 Moderate 7 d/yr ≥94°F today · 16 d/yr by 30 yrs out
- Wind 1/10 Low 0% chance of damaging wind over 30 yrs
- Air quality 2/10 Low 0 unhealthy d/yr today · 1 by 30 yrs out
Nearby sold comps map
Loading sold comps map…
Walkable amenities ~0.75 mi
Loading nearby amenities…
Taxation est. · year 1
- Rental income
- $15,695
- − Mortgage interest
- −$11,147
- − Property taxes
- −$2,985
- − Insurance
- −$995
- − Repairs & maintenance
- −$1,256
- − Management
- −$1,256
- − Depreciation
- −$5,789
- Taxable loss
- −$7,732
- Est. tax savings @ 24.0%
- +$1,856
- After-tax cash flow
- $-2,248/yr
For passive investors: Depreciation is non-cash, so a rental often shows a tax loss while cash-flowing — sheltering income. Rental losses are passive: they offset passive income freely, and up to $25,000/yr can offset ordinary (W-2) income if you actively participate and your MAGI is under $100k (phasing out to $0 by $150k); unused losses carry forward. On sale, claimed depreciation is recaptured at up to 25%, and gains may owe capital-gains tax (a 1031 exchange can defer both). Figures are a year-1 estimate at your 24.0% rate — not tax advice; consult a CPA.
Schools (NCES district)
- District
- Camden Central School District
- NCES district ID
- 3606240
- Math proficiency
- 34% ▼ -14.00%
- Reading proficiency
- 48% ▲ 1.00%
- Median HH income
- $48,686
- Composite
- 35.15/100
- National rank
- #5008
- State rank
- #504 of 590 in NY
Livability — Sylvan Beach
- Score
- 56/100
- State rank
- #1110
- US rank
- #22755
Category grades
Schools grade is shown separately in the Schools card above.
Census & demographics
- Census place
- Sylvan Beach, NY
- City population
- 547
- Population (ZIP)
- 4,239
Population outlook (Oneida County) Hauer SSP2
- Today (2025)
- 225,223 people
- By 2030
- 220,384 · -2.1%
- By 2040
- 209,071 · -7.2%
- By 2050
- 197,920 · -12.1%
- By 2075
- 175,541 · -22.1%
- By 2100
- 148,491 · -34.1%
Race, ethnicity, and origin ACS 2023
- Neighborhood character
- Predominantly White (93%)
- Race & ethnicity
- White 93% Two or more races 5% Hispanic / Latino 4% Asian 1%
- Common ancestry
- Romanian 8% Lithuanian 3% Subsaharan African 2%
- Foreign-born
- 2% · South Korea, Canada
- Languages at home
- 98% English-only · Korean 1%
Political lean MEDSL · Oneida
- 2024 margin
- Strong R (+21.3) · D 39.4% · R 60.6%
- 2008→2024 swing
- -15.2pp toward R · 2008: -6.1pp · 2024: -21.3pp
- All cycles
- 2024: R+21.3 2020: R+15.5 2016: R+21.1 2012: R+5.3 2008: R+6.1
Not yet ingested
- Civics
- —
Market trends
- HPI YoY
- ▲ 73.19%
- Current HPI
- 329.3091
- Rent YoY
- —
- Metro
- —
- State GDP YoY
- ▲ 2.60%
- F500 in state
- 92
Industry mix (Fortune 500 HQ in NY)
| Industry | F500 HQs | Revenue |
|---|---|---|
| Financial Services | 10 | $950B |
|
||
| Consumer Goods | 9 | $162B |
|
||
| Insurance | 4 | $225B |
|
||
| Telecommunications | 2 | $144B |
|
||
| Pharmaceuticals | 2 | $112B |
|
||
| Media / Entertainment | 2 | $69B |
|
||
Price history
+85.2% since first listed28 events — show timeline
- 2026-06-17 Sold (MLS) $185,000 CNYIS
- 2026-05-24 Pending — CNYIS
- 2026-05-18 Contingent — CNYIS
- 2026-04-20 Listed $199,000 CNYIS
- 2025-12-30 Listing Removed — CNYIS
- 2025-09-15 Price Changed $194,900 CNYIS
- 2025-08-18 Price Changed $199,900 CNYIS
- 2025-08-17 Rental Removed $1,800 Avail
- 2025-08-02 Price Changed $205,000 CNYIS
- 2025-07-18 Listed for Rent $1,800 Avail
- 2025-07-03 Price Changed $215,000 CNYIS
- 2025-05-24 Listed $229,900 CNYIS
- 2019-01-02 Listing Removed — CNYIS
- 2018-09-24 Listed $124,900 CNYIS
- 2017-10-26 Sold (MLS) $80,000 CNYIS
- 2017-07-27 Listed $84,500 CNYIS
- 2016-09-25 Listing Removed — CNYIS
- 2016-03-25 Listed $89,500 CNYIS
- 2015-12-19 Listing Removed — CNYIS
- 2014-09-22 Listing Removed — CNYIS
- 2014-09-19 Listed $89,900 CNYIS
- 2013-07-15 Listed $95,000 CNYIS
- 2012-12-15 Listing Removed — CNYIS
- 2012-06-15 Listed $99,900 CNYIS
- 2010-06-25 Sold (MLS) $88,000 CNYIS
- 2009-09-09 Listed $92,900 CNYIS
- 2009-09-09 Listing Removed — CNYIS
- 2009-06-09 Listed $99,900 CNYIS
Cash-flow waterfall
monthlySold comps — $/sqft
last 12 mo · ≤1 miLoading sold comps…