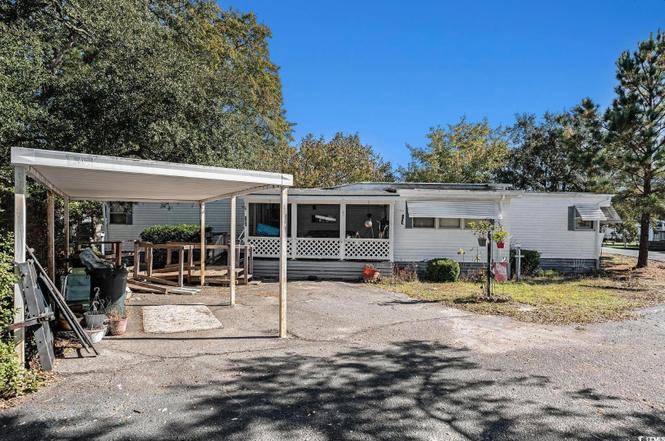
109 Village Ct · Murrells Inlet, SC
Flood risk 5/10 · Moderate
- FEMA flood zone
- X (shaded)
- Chance of flooding over 30 yrs
- 0.24%
- Est. flood insurance / yr
- $507 – $1,088
Fire risk 4/10 · Minor
- Est. fire insurance / yr
- $783 – $1,453
Heat risk 9/10 · Severe
- Hot days now (above 106°F)
- 7 days/yr
- Hot days in 30 yrs
- 18 days/yr
Wind risk 9/10 · Severe
- Chance of severe wind over 30 yrs
- 99.0%
Air-quality risk 2/10 · Minimal
- Unhealthy air days now
- 0 days/yr
- Unhealthy air days in 30 yrs
- 1 days/yr
Risk factors via First Street. Map © Google.
Why this score? — see what drove the D+ grade
The composite is a weighted blend of 9 inputs, each scored 0–100. Each bar is that input's sub-score; the figure is the points it added to the 100-point composite (weight × sub-score).
- Cash flow +15.0/30.0
- ARV discount +7.5/15.0
- 1% rule +5.0/10.0
- DSCR +5.0/10.0
- Livability +3.8/5.0
- Rent growth +3.7/5.0
- Schools +2.7/10.0
- Condition / age +2.5/5.0
- Appreciation +0.0/10.0
$29,000
🖨 Deal sheet 📄 Offer letter ✓ Due diligence
Listing remarks MLS
2 bedroom 2 bath mobile home in Inlet Oaks Village a 55+ community with a pool. A great place to spend winters, as a getaway or live permanently.
Key facts
- Clubhouse
- Large front porch
- Community pool
Tags
Property features AI
Finance
- Other: Land lease present
- Financial info: Has land lease (approximately $650 monthly)
- HOA & community: Monthly association fee; Owner-allowed golf cart; Owner-allowed motorcycle; Tenant-allowed golf cart; Community allows long term rentals; Senior community; Pool in community
Exterior
- Parking: Carport; 2 parking spaces total
- Utilities: Public water; Sewer available; Electricity available; Cable available; Phone available; Underground utilities
- Home design: Single wide mobile home; Resale condition; Zoned MF; Outside city limits
- Construction: Single wide body type
- Exterior features: Front porch; Rear porch; Screened porch; Porch; Outdoor community pool; Storage
Interior
- Kitchen: Dishwasher; Disposal; Microwave; Range; Range hood; Refrigerator; Pantry; Kitchen exhaust fan; Kitchen/dining combo
- Bedrooms: Bedroom on main level
- Flooring: Carpet; Vinyl
- Bathrooms: 2 full bathrooms
- Heating & cooling: Central heating (electric); Central air conditioning
- Interior features: Window treatments; Ceiling fan(s); Bathtub; Separate shower; Tub/shower combination; Vanity; Split bedrooms; Main level primary; Workshop; Storage
- Laundry & utility: Washer hookup; Dryer; Washer; Utility room
Neighborhood map
What this means for you Summary
Snapshot
- This is a 2-bed/2.0-bath manufactured listed at $29k.
Deal economics
- At list price, monthly cash flow is $1k ($15k/yr) — positive.
- The deal already cash-flows at list — no discount required.
- Meets the 1% rule at list price ($2k rent vs $29k).
- Recommended offer: $26k (12.0% below list) — sets the bar for market timing.
- Cap rate 56.5% vs local median 2.2% in Murrells Inlet — top-decile yield for the area; either an underpriced asset or a hidden risk that comps aren't pricing in. Stress-test before assuming the spread holds.
Location & tenants
- Location reads 76/100 on livability (#25 in SC, #3,720 nationally) — a middle-class / working-renter tenant base. Strengths: crime A+, housing A+, health & safety A+; Watch: amenities F, commute F.
- Georgetown 01 (town): math 26% / reading 38% proficiency, ranked #51 of 80 in SC (top 64%) — families likely to look elsewhere, expect single-tenant / working-renter base with shorter leases.
- Market conditions: Rents rising fast (+4.7%/yr); 287 active listings in the ZIP; 2 comparable units currently listed for rent nearby; 323 units permitted in Georgetown County in 2024 (0 in 5+ unit buildings).
- This rent runs 30% of the median local income ($71k/yr) — at the standard rent-burdened threshold; future hikes will face affordability resistance.
Forward outlook
- Local home prices are declining (-3.0%/yr); year-one equity from $200 of loan paydown is wiped out by about $870 of value loss. Plan a longer hold.
- At projected returns (-3.0% appreciation + 4.7% rent growth), your $8k cash investment doubles in ~1 year — after that, you're playing with house money.
Negotiation context
- It's been on market 213 days — a 12% lower offer ($26k) is reasonable based on typical stale-listing flexibility.
- 3 sale attempts since 24y ago; this cycle's ask has dropped $11k (27%) from the opening price — seller is motivated, your offer sets the floor, not the list.
- Current owner paid $17k; list at $29k implies a 71% gain — meaningful room to come down on a strong offer.
Risks & watch-outs
- Climate carrying-cost: moderate flood risk; severe wind risk, 99% chance of damaging wind over 30y; extreme-heat days projected 7→18/yr by 2055 (HVAC capex compounding) — expect insurance premiums to compound above CPI over the hold.
Questions for the listing agent
- It's been on market 213 days. Have you received any prior offers? Is the seller open to a 12% concession, seller financing, or rate buy-down credit?
- Why hasn't it sold? Are there any deal-killer items the seller is aware of (foundation, flood, title, zoning, code violations)?
- Is there a deadline driving the sale (1031 exchange, divorce, estate, relocation)? That informs how much negotiation room exists.
- Schools are A-rated — typically a magnet for longer-tenancy family renters. What's the average tenant stay here, and is there a school-zone premium baked into asking?
- The area grade is low — what's the realistic commute time and amenity access for the typical tenant pool here? Any planned neighborhood developments (good or bad) we should know about?
- What's the average days-on-market for RENTAL listings here right now (not sales)? A rising rental-DOM trend means longer vacancies and softer asking-rent achievability than the comps imply.
- What's the recent tenant-quality profile in this submarket — average credit score on applications, eviction rate, late-payment / NSF rate, and stable-employment percentage? A property-management company in the area should have these aggregated.
- How much new for-sale + rental construction is in the pipeline within 1–3 miles? Heavy new supply typically softens prices + rents 12–24 months out; constrained supply supports both.
Investment metrics
- 1% rule
- 6.17% ✓
- Cap rate
- 56.54%
- Cash-on-cash
- 179.44%
- DSCR
- 8.98
- GRM
- 1.3
CMA / ARV
- ARV (on-the-fly)
- $69,580
- Comps found
- 12
Show comp detail 12 sales within ~0.75 mi
| Address | Dist | Beds/Ba | Sqft | Sold | Price | $/sf | Match |
|---|---|---|---|---|---|---|---|
| 176 Burr Cir | 0.09mi | 2/2.0 | 980 (0%) | 14mo | $72,000 | $73 | 84 |
| 166 Dubose Loop | 0.09mi | 2/2.0 | 980 (0%) | 22mo | $90,000 | $92 | 78 |
| 173 Braddock Ct | 0.14mi | 2/2.0 | 955 (-3%) | 19mo | $55,000 | $58 | 73 |
| 15 Burr Cir | 0.07mi | 2/2.0 | 924 (-6%) | 21mo | $67,000 | $73 | 70 |
| 53 Crooked Island Cir | 0.48mi | 3/2.0 (+1) | 1,000 (+2%) | 0mo | $67,000 | $67 | 69 |
| 147 Ridgeway Loop | 0.11mi | 2/2.0 | 872 (-11%) | 11mo | $72,000 | $83 | 68 |
| 11 Dover St | 0.50mi | 3/1.0 (+1) | 980 (0%) | 2mo | $28,000 | $29 | 66 |
| 54 Crooked Island Cir | 0.52mi | 3/2.0 (+1) | 920 (-6%) | 1mo | $65,000 | $71 | 60 |
| 29 Oceanside Landing Crooked Island Cir | 0.45mi | 3/2.0 (+1) | 1,064 (+9%) | 4mo | $58,500 | $55 | 56 |
| 1021 S Marlin St | 0.73mi | 2/2.0 | 920 (-6%) | 4mo | $218,000 | $237 | 53 |
| 67 Crooked Island Cir | 0.58mi | 2/2.0 | 1,100 (+12%) | 0mo | $45,000 | $41 | 52 |
| 91 Crooked Island Cir | 0.55mi | 2/2.0 | 1,120 (+14%) | 4mo | $11,500 | $10 | 47 |
Match score weights: distance 35% · size 25% · config 20% · recency 20%. Top-matched comps best support the ARV.
Projected returns pro-forma
-3.0% appreciation · 4.66% rent growth · sell at horizon
- IRR
- —
- Equity multiple
- 10.32×
- Total profit
- $75,703
- Equity at exit
- $4,324
- IRR
- —
- Equity multiple
- 22.98×
- Total profit
- $178,518
- Equity at exit
- $2,507
Cash invested: $8,120 (down + closing). Projections, not guarantees.
Landlord ↔ Tenant lean methodology
- Overall (STATE)
- 90 Strongly Landlord-Friendly
- State South Carolina
- 90 Strongly Landlord-Friendly · R+6
- County
- — inherits STATE
- City
- — inherits STATE
ZIP-level market 29576
- Home prices YoY
- -18.8%
- Rents YoY
- 4.7%
- Active inventory
- 287
- Price-to-rent
- 1.3×
Monthly cashflow live
- Estimated rent
- $1,791 medium interval (Pro) →
- Mortgage (P&I)
- −$152
- Tax est. 1.5%
- −$36 /mo · $435/yr
- Insurance
- −$12
- HOA
- −$0
- Vacancy / Maint / Mgmt
- −$376
- Net cashflow
- $1,214
Break-even live
UW: 25.0% down · 7.5% · 30yr · 1.5% tax · 5.0% vac · 8.0% maint · 8.0% mgmt
Financing live
Cash to close
- Down payment
- $7,250
- Closing costs
- $870
- Reserves months
- —
- Total cash needed
- —
Loan-product check · same deal, 3 products live
Conventional
25% down · 7.5% · 30yr
- Down + closing
- —
- Monthly P&I
- —
- Monthly cashflow
- —
- DSCR
- —
- Eligible?
- —
Personal DTI + credit; lowest rate.
DSCR
20% down · 8.5% · 30yr
- Down + closing
- —
- Monthly P&I
- —
- Monthly cashflow
- —
- DSCR
- —
- Eligible?
- —
No personal income docs; deal must DSCR.
Hard money
10% down · 12.0% · 12mo
- Down + closing
- —
- Monthly P&I
- —
- Monthly cashflow
- —
- DSCR
- —
- Eligible?
- —
Short-term bridge; refi at stabilization.
Rent comps 2 comps
| Address | Beds | Baths | Sqft | Rent | $/sqft | DOM | Units | Dist |
|---|---|---|---|---|---|---|---|---|
| 4996 Highway 17 Business Murrells Inlet, SC | 2.0 | 2.0 | 925 | $1,500 | $1.62 | 13d | 1 | 0.58mi |
| 13 Muddy Bay Dr Murrells Inlet, SC | 2.0–3.0 | 2.0 | 1095 | $1,801 | $1.64 | 13d | 13 | 1.20mi |
Listing history 21 events
-
2026-06-18days on market $29,000 Active 213 DOM
-
2026-06-17days on market $29,000 Active 212 DOM
-
2026-06-16days on market $29,000 Active 211 DOM
-
2026-06-15days on market $29,000 Active 210 DOM
-
2026-06-14days on market $29,000 Active 208 DOM
-
2026-06-10days on market $29,000 Active 205 DOM
-
2026-06-09days on market $29,000 Active 204 DOM
-
2026-06-08days on market $29,000 Active 203 DOM
-
2026-06-07days on market $29,000 Active 202 DOM
-
2026-06-03days on market $29,000 Active 198 DOM
-
2026-06-02days on market $29,000 Active 197 DOM
-
2026-06-01days on market $29,000 Active 196 DOM
-
2026-05-31days on market $29,000 Active 195 DOM
-
2026-05-30days on market $29,000 Active 194 DOM
-
2026-04-24price $29,000
-
2026-01-08price $34,900
-
2025-11-17$39,900 Active
-
2015-03-23soldstatus $17,000 145-char remark
Show marketing remark (145 chars)
2 bedroom 2 bath mobile home in Inlet Oaks Village a 55+ community with a pool. A great place to spend winters, as a getaway or live permanently.
-
2014-11-11$18,000 145-char remark
Show marketing remark (145 chars)
2 bedroom 2 bath mobile home in Inlet Oaks Village a 55+ community with a pool. A great place to spend winters, as a getaway or live permanently.
-
2003-01-17soldstatus $12,000
-
2002-10-09$14,500
ⓘ Source: listings_history table (triggers on properties + properties_extension) + one-shot
backfill from property_details.listing_events for pre-trigger history.
Climate risk First Street
- Flood 5/10 Major FEMA zone X (shaded) · 24% chance over 30 yrs
- Wildfire 4/10 Moderate
- Heat 9/10 Extreme 7 d/yr ≥106°F today · 18 d/yr by 30 yrs out
- Wind 9/10 Extreme 99% chance of damaging wind over 30 yrs
- Air quality 2/10 Low 0 unhealthy d/yr today · 1 by 30 yrs out
Nearby sold comps map
Loading sold comps map…
Walkable amenities ~0.75 mi
Loading nearby amenities…
Taxation est. · year 1
- Rental income
- $21,488
- − Mortgage interest
- −$1,624
- − Property taxes
- −$435
- − Insurance
- −$145
- − Repairs & maintenance
- −$1,719
- − Management
- −$1,719
- − Depreciation
- −$844
- Taxable income
- $15,002
- Est. tax owed @ 24.0%
- −$3,600
- After-tax cash flow
- $10,970/yr
For passive investors: Depreciation is non-cash, so a rental often shows a tax loss while cash-flowing — sheltering income. Rental losses are passive: they offset passive income freely, and up to $25,000/yr can offset ordinary (W-2) income if you actively participate and your MAGI is under $100k (phasing out to $0 by $150k); unused losses carry forward. On sale, claimed depreciation is recaptured at up to 25%, and gains may owe capital-gains tax (a 1031 exchange can defer both). Figures are a year-1 estimate at your 24.0% rate — not tax advice; consult a CPA.
Schools (NCES district)
- District
- Georgetown 01
- NCES district ID
- 4502280
- Math proficiency
- 26% ▼ -11.00%
- Reading proficiency
- 38% ▼ -5.00%
- Median HH income
- $43,045
- Composite
- 27.15/100
- National rank
- #7030
- State rank
- #51 of 80 in SC
Livability — Murrells Inlet
- Score
- 76/100
- State rank
- #25
- US rank
- #3720
Category grades
Schools grade is shown separately in the Schools card above.
Census & demographics
- Census place
- Murrells Inlet, SC
- County
- Horry County · 356,152 people
- City population
- 34,695
- Metro
- Myrtle Beach-Conway-North Myrtle Beach, SC-NC
- Population (ZIP)
- 34,695
- Household income
- $70,691
- Rent vs Own
- Severe rent burden
- 309.0
Population outlook (Georgetown County) Hauer SSP2
- Today (2025)
- 63,275 people
- By 2030
- 63,630 · +0.6%
- By 2040
- 63,130 · -0.2%
- By 2050
- 61,904 · -2.2%
- By 2075
- 59,305 · -6.3%
- By 2100
- 53,852 · -14.9%
Race, ethnicity, and origin ACS 2023
- Neighborhood character
- Predominantly White (89%)
- Race & ethnicity
- White 89% Hispanic / Latino 4% Black 3% Two or more races 3% Asian 2%
- Common ancestry
- Romanian 4% Slovak 3% Serbian 2%
- Foreign-born
- 5% · Canada, China, Vietnam
- Languages at home
- 96% English-only · Spanish 2% Chinese 1%
Political lean MEDSL · Georgetown
- 2024 margin
- R (+19.5) · D 39.6% · R 59.1% · Other 1.2%
- 2008→2024 swing
- -14.2pp toward R · 2008: -5.2pp · 2024: -19.5pp
- All cycles
- 2024: R+19.5 2020: R+12.7 2016: R+13.0 2012: R+7.6 2008: R+5.2
Not yet ingested
- Civics
- —
Market trends
- HPI YoY
- ▼ -57.53%
- Current HPI
- 248.5102
- Rent YoY
- ▲ 4.66%
- Metro
- Myrtle Beach-Conway-North Myrtle Beach, SC-NC
- State GDP YoY
- ▲ 4.51%
- F500 in state
- 2
Industry mix (Fortune 500 HQ in SC)
| Industry | F500 HQs | Revenue |
|---|---|---|
| Packaging | 1 | $7B |
|
||
Price history
+100.0% since first listed7 events — show timeline
- 2026-04-24 Price Changed $29,000 CCAR
- 2026-01-08 Price Changed $34,900 CCAR
- 2025-11-17 Listed $39,900 CCAR
- 2015-03-23 Sold (MLS) $17,000 CCAR
- 2014-11-11 Listed $18,000 CCAR
- 2003-01-17 Sold (MLS) $12,000 CCAR
- 2002-10-09 Listed $14,500 CCAR
Cash-flow waterfall
monthlySold comps — $/sqft
last 12 mo · ≤1 miLoading sold comps…