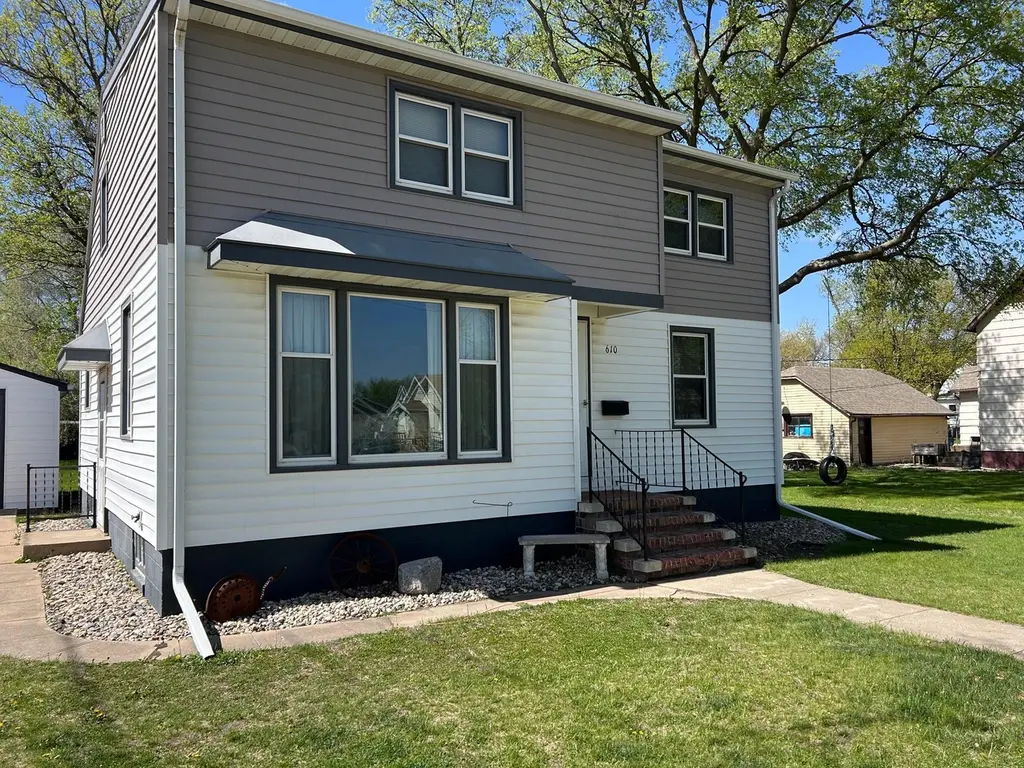
610 Lyon Ave N · Canby, MN
Flood risk 1/10 · Minimal
- FEMA flood zone
- X (unshaded)
- Chance of flooding over 30 yrs
- 0.0%
- Est. flood insurance / yr
- $473 – $860
Fire risk 3/10 · Minor
- Est. fire insurance / yr
- $888 – $1,650
Heat risk 2/10 · Minimal
- Hot days now (above 100°F)
- 7 days/yr
- Hot days in 30 yrs
- 14 days/yr
Wind risk 2/10 · Minimal
- Chance of severe wind over 30 yrs
- —
Air-quality risk 2/10 · Minimal
- Unhealthy air days now
- 1 days/yr
- Unhealthy air days in 30 yrs
- 1 days/yr
Risk factors via First Street. Map © Google.
Why this score? — see what drove the F grade
The composite is a weighted blend of 9 inputs, each scored 0–100. Each bar is that input's sub-score; the figure is the points it added to the 100-point composite (weight × sub-score).
- Cash flow +8.2/30.0
- ARV discount +7.5/15.0
- Schools +4.4/10.0
- Livability +4.0/5.0
- 1% rule +2.7/10.0
- Rent growth +2.5/5.0
- Condition / age +2.5/5.0
- DSCR +2.2/10.0
- Appreciation +0.7/10.0
$109,000
🖨 Deal sheet 📄 Offer letter ✓ Due diligence
Listing remarks
Why rent when you can own? Cozy home in a convenient location in Canby. The three bed one bath home is well maintained with many updates. There are two bedrooms on the main level and a bedroom with a TV/ office room on the second level. Outside a single car garage with a cement patio with shade trees, which is a great place to relax or grill a summer meal. Come and take a look!
Key facts
- Many updates
- Single car garage
- Shade trees
Tags
Property features AI
Finance
- Other: Above-grade finished area and main level finished area available; Below-grade finished area available
- Financial info: Other mortgage type
Exterior
- Parking: Detached garage (1 car), approximately 12 x 20 with 9' wide by 7' high door
- Utilities: City water (connected); City sewer (connected); Natural gas; Power by Ottertail Power
- Home design: Residential property; One and one-half story; Main floor primary bedroom
- Construction: Block and frame construction; Foundation: block (approx. 30 x 24); Roof age 8 years or less
- Exterior features: Rear porch; Vinyl exterior; Light tree coverage; Zero lot line
Interior
- Kitchen: Range; Refrigerator; Microwave; Freezer; Eat-in kitchen
- Bedrooms: 3 bedrooms total; Main level bedrooms (two on main); Upper level bedroom(s) and flex room
- Bathrooms: One full bathroom on the main floor
- Heating & cooling: Forced air heating; Central air conditioning
- Interior features: Ceiling fan(s); Main floor primary bedroom; Patio; Washer/dryer hookup; Block basement
- Laundry & utility: Washer and dryer included; Laundry located in basement; Water softener (owned); Electric water heater
Neighborhood map
What this means for you Summary
Snapshot
- This is a 3-bed/1.0-bath single-family listed at $109k.
Deal economics
- At list price, monthly cash flow is $-103 ($-1k/yr) — negative.
- To cash-flow at today's rent, offer at most $91k (16.7% below list).
- To meet the 1% rule (rent ≥ 1% of price), the offer needs to be $83k (23.4% below list).
- Recommended offer: $83k (23.4% below list) — sets the bar for 1% rule.
Location & tenants
- Location reads 79/100 on livability (#96 in MN, #2,152 nationally) — a middle-class / working-renter tenant base. Strengths: crime A+, cost of living A+, housing A+; Watch: amenities F, commute F.
- Canby Public School District (rural): math 52% / reading 52% proficiency, ranked #99 of 301 in MN (top 33%) — acceptable for families but not a draw, mixed tenant base, ~2y average lease.
- Market conditions: 10 active listings in the ZIP; 7 units permitted in Yellow Medicine County in 2024 (0 in 5+ unit buildings).
Forward outlook
- Local home prices are declining (-3.0%/yr); year-one equity from $754 of loan paydown is wiped out by about $3k of value loss. Plan a longer hold.
- Yellow Medicine County population projected at -26% by 2050 — secular population decline; favor cash flow + early exit over multi-decade hold.
Negotiation context
- It's been on market 28 days — a 2% lower offer ($107k) is reasonable based on typical stale-listing flexibility.
- Current owner paid $60k; list at $109k implies a 82% gain — meaningful room to come down on a strong offer.
Risks & watch-outs
- Watch-outs: built in 1950 — expect roof / HVAC / electrical / plumbing capex.
Questions for the listing agent
- What do current leases actually rent for vs. the listed asking? Can we see a recent rent roll and the last 12 months of T-12 income?
- Built in 1950 — when were the roof, HVAC, electrical panel, plumbing, and water heater last replaced?
- Is there a deadline driving the sale (1031 exchange, divorce, estate, relocation)? That informs how much negotiation room exists.
- Schools are B-rated — typically a magnet for longer-tenancy family renters. What's the average tenant stay here, and is there a school-zone premium baked into asking?
- The area grade is low — what's the realistic commute time and amenity access for the typical tenant pool here? Any planned neighborhood developments (good or bad) we should know about?
- What's the average days-on-market for RENTAL listings here right now (not sales)? A rising rental-DOM trend means longer vacancies and softer asking-rent achievability than the comps imply.
- What's the recent tenant-quality profile in this submarket — average credit score on applications, eviction rate, late-payment / NSF rate, and stable-employment percentage? A property-management company in the area should have these aggregated.
- How much new for-sale + rental construction is in the pipeline within 1–3 miles? Heavy new supply typically softens prices + rents 12–24 months out; constrained supply supports both.
Investment metrics
- 1% rule
- 0.77% ✗
- Cap rate
- 5.16%
- Cash-on-cash
- -4.06%
- DSCR
- 0.82
- GRM
- 10.9
CMA / ARV
- ARV (median comp)
- $40,437
- List price
- $109,000
- Delta
- 169.55%
- Verdict
- OVERPRICED
- Comps
- 1 within 2.0 mi
Projected returns pro-forma
-3.0% appreciation · 3.0% rent growth · sell at horizon
- IRR
- -23.1%
- Equity multiple
- 0.21×
- Total profit
- $-24,217
- Equity at exit
- $16,252
- IRR
- -17.6%
- Equity multiple
- 0.03×
- Total profit
- $-29,477
- Equity at exit
- $9,424
Cash invested: $30,520 (down + closing). Projections, not guarantees.
Landlord ↔ Tenant lean methodology
- Overall (STATE)
- 46 Balanced
- State Minnesota
- 46 Balanced · D+2
- County
- — inherits STATE
- City
- — inherits STATE
ZIP-level market 56220
- Home prices YoY
- -3.8%
- Active inventory
- 10
- Price-to-rent
- 10.9×
Monthly cashflow live
- Estimated rent
- $835 medium interval (Pro) →
- Mortgage (P&I)
- −$572
- Tax from tax record
- −$146 /mo · $1,748/yr
- Insurance
- −$45
- HOA
- −$0
- Vacancy / Maint / Mgmt
- −$175
- Net cashflow
- $-103
Break-even live
UW: 25.0% down · 7.5% · 30yr · 1.5% tax · 5.0% vac · 8.0% maint · 8.0% mgmt
Financing live
Cash to close
- Down payment
- $27,250
- Closing costs
- $3,270
- Reserves months
- —
- Total cash needed
- —
Loan-product check · same deal, 3 products live
Conventional
25% down · 7.5% · 30yr
- Down + closing
- —
- Monthly P&I
- —
- Monthly cashflow
- —
- DSCR
- —
- Eligible?
- —
Personal DTI + credit; lowest rate.
DSCR
20% down · 8.5% · 30yr
- Down + closing
- —
- Monthly P&I
- —
- Monthly cashflow
- —
- DSCR
- —
- Eligible?
- —
No personal income docs; deal must DSCR.
Hard money
10% down · 12.0% · 12mo
- Down + closing
- —
- Monthly P&I
- —
- Monthly cashflow
- —
- DSCR
- —
- Eligible?
- —
Short-term bridge; refi at stabilization.
Listing history 12 events
-
2026-06-12statusdays on market $109,000 Pending 28 DOM
-
2026-06-09days on market $109,000 Contingent - Inspection 25 DOM
-
2026-06-08days on market $109,000 Contingent - Inspection 24 DOM
-
2026-06-07days on market $109,000 Contingent - Inspection 23 DOM
-
2026-06-05statusdays on market $109,000 Contingent - Inspection 21 DOM
-
2026-06-04days on market $109,000 Active 19 DOM
-
2026-06-02days on market $109,000 Active 18 DOM
-
2026-06-01days on market $109,000 Active 17 DOM
-
2026-05-31days on market $109,000 Active 16 DOM
-
2026-05-31days on market $109,000 Active 15 DOM
-
2026-05-15$109,000 Active 380-char remark
-
2025-01-28soldstatus $60,000
ⓘ Source: listings_history table (triggers on properties + properties_extension) + one-shot
backfill from property_details.listing_events for pre-trigger history.
Tax reassessment forecast MN · Partial reset (capped growth)
- Current annual tax
- $1,748 · $146/mo
- Projected year-2 tax
- $1,748 · $146/mo
- Expected delta
- $0/yr ($0/mo · 0.0%)
ⓘ Screening estimate from a state-policy table — verify with the county assessor before closing.
Climate risk First Street
- Flood 1/10 Low FEMA zone X (unshaded) · 0% chance over 30 yrs
- Wildfire 3/10 Moderate
- Heat 2/10 Low 7 d/yr ≥100°F today · 14 d/yr by 30 yrs out
- Wind 2/10 Low
- Air quality 2/10 Low 1 unhealthy d/yr today · 1 by 30 yrs out
Nearby sold comps map
Loading sold comps map…
Walkable amenities ~0.75 mi
Loading nearby amenities…
Taxation est. · year 1
- Rental income
- $10,018
- − Mortgage interest
- −$6,106
- − Property taxes
- −$1,748
- − Insurance
- −$545
- − Repairs & maintenance
- −$801
- − Management
- −$801
- − Depreciation
- −$3,171
- Taxable loss
- −$3,155
- Est. tax savings @ 24.0%
- +$757
- After-tax cash flow
- $-481/yr
For passive investors: Depreciation is non-cash, so a rental often shows a tax loss while cash-flowing — sheltering income. Rental losses are passive: they offset passive income freely, and up to $25,000/yr can offset ordinary (W-2) income if you actively participate and your MAGI is under $100k (phasing out to $0 by $150k); unused losses carry forward. On sale, claimed depreciation is recaptured at up to 25%, and gains may owe capital-gains tax (a 1031 exchange can defer both). Figures are a year-1 estimate at your 24.0% rate — not tax advice; consult a CPA.
Schools (NCES district)
- District
- Canby Public School District
- NCES district ID
- 2707470
- Math proficiency
- 52% ▼ -11.00%
- Reading proficiency
- 52% ▼ -16.00%
- Median HH income
- $48,782
- Composite
- 44.34/100
- National rank
- #2823
- State rank
- #99 of 301 in MN
Livability — Canby
- Score
- 79/100
- State rank
- #96
- US rank
- #2152
Category grades
Schools grade is shown separately in the Schools card above.
Census & demographics
- Census place
- Canby, MN
- Population (ZIP)
- 2,705
Population outlook (Yellow Medicine County) Hauer SSP2
- Today (2025)
- 8,959 people
- By 2030
- 8,451 · -5.7%
- By 2040
- 7,514 · -16.1%
- By 2050
- 6,650 · -25.8%
- By 2075
- 5,306 · -40.8%
- By 2100
- 4,453 · -50.3%
Race, ethnicity, and origin ACS 2023
- Neighborhood character
- Predominantly White (95%)
- Race & ethnicity
- White 95% Two or more races 2% Hispanic / Latino 2%
- Common ancestry
- Portuguese 25% Romanian 8% English 3%
- Foreign-born
- 1% · Canada, China
- Languages at home
- 97% English-only · Spanish 2%
Political lean MEDSL · Yellow Medicine
- 2024 margin
- Solid R (+40.6) · D 28.7% · R 69.3% · Other 1.9%
- 2008→2024 swing
- -44.9pp toward R · 2008: 4.3pp · 2024: -40.6pp
- All cycles
- 2024: R+40.6 2020: R+37.0 2016: R+35.4 2012: R+6.3 2008: D+4.3
Not yet ingested
- Civics
- —
Market trends
- HPI YoY
- ▼ -8.64%
- Current HPI
- 218.6092
- Rent YoY
- —
- Metro
- —
- State GDP YoY
- ▲ 2.41%
- F500 in state
- 34
Industry mix (Fortune 500 HQ in MN)
| Industry | F500 HQs | Revenue |
|---|---|---|
| Healthcare | 2 | $407B |
|
||
| Retail | 2 | $150B |
|
||
| Consumer Goods | 2 | $32B |
|
||
| Industrial Machinery | 2 | $6B |
|
||
| Agriculture | 1 | $40B |
|
||
| Healthcare / Medical Devices | 1 | $32B |
|
||
Price history
+81.7% since first listed4 events — show timeline
- 2026-06-12 Pending — NORTHSTARMLS as Distributed by MLS Grid
- 2026-06-04 Contingent — NORTHSTARMLS as Distributed by MLS Grid
- 2026-05-15 Listed $109,000 NORTHSTARMLS as Distributed by MLS Grid
- 2025-01-28 Sold (Public Records) $60,000 Public Records
Property tax history
+6.5%/yrLatest (2026): $1,748 · +4.8% YoY. Source: county tax records.
Cash-flow waterfall
monthlySold comps — $/sqft
last 12 mo · ≤1 miLoading sold comps…