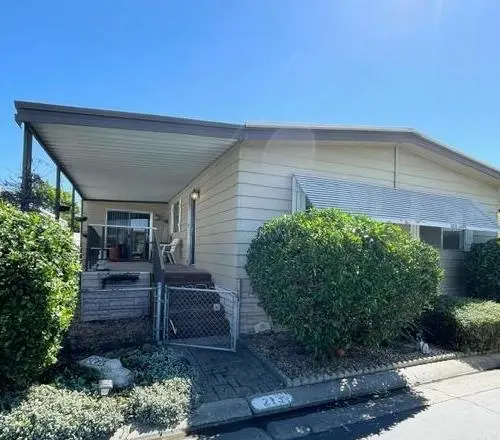
8700 West Ln #213 · Stockton, CA
Flood risk 1/10 · Minimal
- FEMA flood zone
- X
- Chance of flooding over 30 yrs
- 0.0%
- Est. flood insurance / yr
- $507 – $1,088
Fire risk 2/10 · Minimal
- Est. fire insurance / yr
- $659 – $1,223
Heat risk 7/10 · Major
- Hot days now (above 102°F)
- 6 days/yr
- Hot days in 30 yrs
- 13 days/yr
Wind risk 1/10 · Minimal
- Chance of severe wind over 30 yrs
- —
Air-quality risk 10/10 · Severe
- Unhealthy air days now
- 30 days/yr
- Unhealthy air days in 30 yrs
- 30 days/yr
Risk factors via First Street. Map © Google.
Why this score? — see what drove the B+ grade
The composite is a weighted blend of 9 inputs, each scored 0–100. Each bar is that input's sub-score; the figure is the points it added to the 100-point composite (weight × sub-score).
- Cash flow +30.0/30.0
- ARV discount +15.0/15.0
- 1% rule +10.0/10.0
- DSCR +10.0/10.0
- Rent growth +4.3/5.0
- Livability +2.9/5.0
- Schools +2.7/10.0
- Condition / age +2.5/5.0
- Appreciation +0.0/10.0
$85,000
🖨 Deal sheet 📄 Offer letter ✓ Due diligence
Listing remarks
Priced to Sell! Open floor plan, Double Wide 24x56 with 2 sets of expandos extending living room and master bedroom space an additional 400 sq ft totalling 1744. Kitchen has built in dining table, all appliances included (washer dryer fridge dishwasher micro stove), laundry room leads to carport, carport could possibly fit 2 or more vehicles, 2 sheds under carport, large covered entry patio, family room, living room, large master with master bath with double sinks, step in shower, and garden tub. Second bath is used as guest bath and guest room has door to access guest bath. Home has solid bones. Add your magic touch to make it your forever home.
Key facts
- Open floor plan
- Laundry room
- Step in shower
Tags
Neighborhood map
What this means for you Summary
Snapshot
- This is a 2-bed/2.0-bath manufactured listed at $85k.
Deal economics
- At list price, monthly cash flow is $1k ($15k/yr) — positive.
- The deal already cash-flows at list — no discount required.
- Meets the 1% rule at list price ($2k rent vs $85k).
- Recommended offer: $80k (6.0% below list) — sets the bar for market timing.
- Cap rate 23.5% vs local median 3.6% in Stockton — top-decile yield for the area; either an underpriced asset or a hidden risk that comps aren't pricing in. Stress-test before assuming the spread holds.
Location & tenants
- Location reads 57/100 on livability (#734 in CA) — a working-class tenant base; expect higher turnover. Strengths: housing A+, health & safety A, amenities A-; Watch: employment C-, schools D-, crime F.
- Lodi Unified (urban): math 24% / reading 36% proficiency, ranked #325 of 517 in CA (top 63%) — families likely to look elsewhere, expect single-tenant / working-renter base with shorter leases.
- Market conditions: Rents rising fast (+7.1%/yr); 102 active listings in the ZIP; 11 comparable units currently listed for rent nearby; rentals lingering (median 44d on market — plan ~5-8 weeks vacancy on turnover, expect pricing pressure); 73% of comp listings sitting > 30 days — soft ceiling on asking rent; 3,779 units permitted in San Joaquin County in 2024 (0 in 5+ unit buildings).
- This rent runs 40% of the median local income ($68k/yr) — at the standard rent-burdened threshold; future hikes will face affordability resistance.
Forward outlook
- Local home prices are declining (-3.0%/yr); year-one equity from $588 of loan paydown is wiped out by about $3k of value loss. Plan a longer hold.
- San Joaquin County population projected at +17% by 2050 — long-run rental-demand tailwind backs the buy-and-hold thesis.
- At projected returns (-3.0% appreciation + 7.1% rent growth), your $24k cash investment doubles in ~2 years — after that, you're playing with house money.
Negotiation context
- It's been on market 75 days — a 6% lower offer ($80k) is reasonable based on typical stale-listing flexibility.
Risks & watch-outs
- Climate carrying-cost: extreme-heat days projected 6→13/yr by 2055 (HVAC capex compounding) — expect insurance premiums to compound above CPI over the hold.
Questions for the listing agent
- It's been on market 75 days. Have you received any prior offers? Is the seller open to a 6% concession, seller financing, or rate buy-down credit?
- Built in 1976 — when were the roof, HVAC, electrical panel, plumbing, and water heater last replaced?
- Why hasn't it sold? Are there any deal-killer items the seller is aware of (foundation, flood, title, zoning, code violations)?
- Is there a deadline driving the sale (1031 exchange, divorce, estate, relocation)? That informs how much negotiation room exists.
- Schools are D-rated, which usually means shorter tenancies and higher turnover. Who's the typical renter profile here, and what's been the actual vacancy rate?
- Crime grade is F in this area — have there been break-ins, vandalism, or insurance claims at this property in the last 3 years? What carrier currently insures it and at what premium?
- What's the average days-on-market for RENTAL listings here right now (not sales)? A rising rental-DOM trend means longer vacancies and softer asking-rent achievability than the comps imply.
- What's the recent tenant-quality profile in this submarket — average credit score on applications, eviction rate, late-payment / NSF rate, and stable-employment percentage? A property-management company in the area should have these aggregated.
- How much new for-sale + rental construction is in the pipeline within 1–3 miles? Heavy new supply typically softens prices + rents 12–24 months out; constrained supply supports both.
Investment metrics
- 1% rule
- 2.68% ✓
- Cap rate
- 23.45%
- Cash-on-cash
- 61.28%
- DSCR
- 3.73
- GRM
- 3.1
CMA / ARV
- ARV (median comp)
- $114,514
- List price
- $85,000
- Delta
- -25.77%
- Verdict
- UNDERPRICED
- Comps
- 20 within 1.0 mi
Show comp detail 9 sales within ~0.75 mi
| Address | Dist | Beds/Ba | Sqft | Sold | Price | $/sf | Match |
|---|---|---|---|---|---|---|---|
| 8700 West Ln #216 | 0.00mi | 3/2.0 (+1) | 1,682 (-4%) | 13mo | $130,000 | $77 | 78 |
| 8700 West Ln #174 | 0.16mi | 2/2.0 | 1,568 (-10%) | 1mo | $125,000 | $80 | 75 |
| 8700 N West Ln #154 | 0.00mi | 2/2.0 | 1,564 (-10%) | 15mo | $90,000 | $58 | 70 |
| 8700 West Ln #177 | 0.09mi | 3/2.0 (+1) | 1,660 (-5%) | 15mo | $125,000 | $75 | 70 |
| 8700 W West Ln #261 | 0.12mi | 2/2.0 | 1,680 (-4%) | 23mo | $108,000 | $64 | 69 |
| 8700 West Ln #67 | 0.00mi | 2/2.0 | 1,536 (-12%) | 14mo | $130,000 | $85 | 69 |
| 8700 N West Ln #166 | 0.13mi | 3/2.0 (+1) | 1,550 (-11%) | 11mo | $125,000 | $81 | 62 |
| 8700 West Ln #45 | 0.16mi | 2/2.0 | 1,536 (-12%) | 21mo | $102,000 | $66 | 55 |
| 8700 N West Ln #169 | 0.12mi | 2/2.0 | 1,488 (-15%) | 22mo | $150,000 | $101 | 52 |
Match score weights: distance 35% · size 25% · config 20% · recency 20%. Top-matched comps best support the ARV.
Projected returns pro-forma
-3.0% appreciation · 7.09% rent growth · sell at horizon
- IRR
- 64.7%
- Equity multiple
- 4.09×
- Total profit
- $73,441
- Equity at exit
- $12,674
- IRR
- 70.4%
- Equity multiple
- 9.71×
- Total profit
- $207,412
- Equity at exit
- $7,349
Cash invested: $23,800 (down + closing). Projections, not guarantees.
Landlord ↔ Tenant lean methodology
- Overall (STATE)
- 18 Strongly Tenant-Friendly
- State California
- 18 Strongly Tenant-Friendly · D+13
- County
- — inherits STATE
- City
- — inherits STATE
ZIP-level market 95210
- Rents YoY
- 7.1%
- Active inventory
- 102
- Price-to-rent
- 3.1×
Monthly cashflow live
- Estimated rent
- $2,282 high interval (Pro) →
- Mortgage (P&I)
- −$446
- Tax est. 1.5%
- −$106 /mo · $1,275/yr
- Insurance
- −$35
- HOA
- −$0
- Vacancy / Maint / Mgmt
- −$479
- Net cashflow
- $1,215
Break-even live
UW: 25.0% down · 7.5% · 30yr · 1.5% tax · 5.0% vac · 8.0% maint · 8.0% mgmt
Financing live
Cash to close
- Down payment
- $21,250
- Closing costs
- $2,550
- Reserves months
- —
- Total cash needed
- —
Loan-product check · same deal, 3 products live
Conventional
25% down · 7.5% · 30yr
- Down + closing
- —
- Monthly P&I
- —
- Monthly cashflow
- —
- DSCR
- —
- Eligible?
- —
Personal DTI + credit; lowest rate.
DSCR
20% down · 8.5% · 30yr
- Down + closing
- —
- Monthly P&I
- —
- Monthly cashflow
- —
- DSCR
- —
- Eligible?
- —
No personal income docs; deal must DSCR.
Hard money
10% down · 12.0% · 12mo
- Down + closing
- —
- Monthly P&I
- —
- Monthly cashflow
- —
- DSCR
- —
- Eligible?
- —
Short-term bridge; refi at stabilization.
Rent comps 11 comps
| Address | Beds | Baths | Sqft | Rent | $/sqft | DOM | Units | Dist |
|---|---|---|---|---|---|---|---|---|
| 1768 Crestwood Cir Stockton, CA | 3.0 | 2.0 | 1389 | $2,500 | $1.80 | 44d | 1 | 0.17mi |
| 1857 Crestwood Cir Stockton, CA | 3.0 | 2.0 | 1561 | $2,450 | $1.57 | 44d | 1 | 0.18mi |
| 326 Sue Ct Stockton, CA | 3.0 | 2.0 | 1153 | $2,495 | $2.16 | 23d | 1 | 0.90mi |
| 326 Sue Ct Stockton, CA | 3.0 | 2.0 | 1153 | $2,495 | $2.16 | 21d | 1 | 0.90mi |
| 7409 Village Green Dr Stockton, CA | 3.0 | 2.0 | 1141 | $2,000 | $1.75 | 44d | 1 | 1.01mi |
| 6465 West Ln Stockton, CA | 2.0 | 1.0 | 1200 | $1,625 | $1.35 | 44d | 1 | 1.26mi |
| 8446 N El Dorado St Stockton, CA | 3.0 | 2.0 | 1269 | $2,300 | $1.81 | 44d | 1 | 1.27mi |
| 7620 N El Dorado St Stockton, CA | 1.0–3.0 | 1.0–2.0 | 827 | $1,538 | $1.86 | 44d | 1 | 1.38mi |
| 742 Ponce De Leon Ave Apt 2 Stockton, CA | 3.0 | 1.5 | 1200 | $1,825 | $1.52 | 10d | 1 | 1.50mi |
| 8650 Acapulco Way Stockton, CA | 3.0 | 1.5 | 1100 | $2,000 | $1.82 | 44d | 1 | 1.50mi |
| 8626 Acapulco Way Unit 4 Stockton, CA | 3.0 | 2.0 | 1154 | $1,895 | $1.64 | 44d | 1 | 1.50mi |
Listing history 14 events
-
2026-06-18days on market $85,000 Active 75 DOM
-
2026-06-17days on market $85,000 Active 74 DOM
-
2026-06-16days on market $85,000 Active 73 DOM
-
2026-06-15days on market $85,000 Active 72 DOM
-
2026-06-14days on market $85,000 Active 70 DOM
-
2026-06-10days on market $85,000 Active 67 DOM
-
2026-06-09days on market $85,000 Active 66 DOM
-
2026-06-08days on market $85,000 Active 65 DOM
-
2026-06-07days on market $85,000 Active 64 DOM
-
2026-06-05days on market $85,000 Active 61 DOM
-
2026-06-03days on market $85,000 Active 60 DOM
-
2026-06-03days on market $85,000 Active 59 DOM
-
2026-06-01days on market $85,000 Active 58 DOM
-
2026-05-31days on market $85,000 Active 57 DOM
ⓘ Source: listings_history table (triggers on properties + properties_extension) + one-shot
backfill from property_details.listing_events for pre-trigger history.
Climate risk First Street
- Flood 1/10 Low FEMA zone X · 0% chance over 30 yrs
- Wildfire 2/10 Low
- Heat 7/10 Severe 6 d/yr ≥102°F today · 13 d/yr by 30 yrs out
- Wind 1/10 Low
- Air quality 10/10 Extreme 30 unhealthy d/yr today · 30 by 30 yrs out
Nearby sold comps map
Loading sold comps map…
Walkable amenities ~0.75 mi
Loading nearby amenities…
Taxation est. · year 1
- Rental income
- $27,383
- − Mortgage interest
- −$4,761
- − Property taxes
- −$1,275
- − Insurance
- −$425
- − Repairs & maintenance
- −$2,191
- − Management
- −$2,191
- − Depreciation
- −$2,473
- Taxable income
- $14,068
- Est. tax owed @ 24.0%
- −$3,376
- After-tax cash flow
- $11,207/yr
For passive investors: Depreciation is non-cash, so a rental often shows a tax loss while cash-flowing — sheltering income. Rental losses are passive: they offset passive income freely, and up to $25,000/yr can offset ordinary (W-2) income if you actively participate and your MAGI is under $100k (phasing out to $0 by $150k); unused losses carry forward. On sale, claimed depreciation is recaptured at up to 25%, and gains may owe capital-gains tax (a 1031 exchange can defer both). Figures are a year-1 estimate at your 24.0% rate — not tax advice; consult a CPA.
Schools (NCES district)
- District
- Lodi Unified
- NCES district ID
- 0622230
- Math proficiency
- 24% ▼ -8.00%
- Reading proficiency
- 36% ▼ -8.00%
- Median HH income
- $57,165
- Composite
- 26.84/100
- National rank
- #7108
- State rank
- #325 of 517 in CA
Livability — Stockton
- Score
- 57/100
- State rank
- #734
- US rank
- #21638
Category grades
Schools grade is shown separately in the Schools card above.
Census & demographics
- Census place
- Stockton, CA
- County
- San Joaquin County · 729,570 people
- City population
- 332,006
- Metro
- Stockton, CA
- Population (ZIP)
- 41,549
- Household income
- $67,991
- Rent vs Own
- Severe rent burden
- 1817.0
Population outlook (San Joaquin County) Hauer SSP2
- Today (2025)
- 796,965 people
- By 2030
- 828,849 · +4.0%
- By 2040
- 885,611 · +11.1%
- By 2050
- 929,798 · +16.7%
- By 2075
- 994,578 · +24.8%
- By 2100
- 971,291 · +21.9%
Race, ethnicity, and origin ACS 2023
- Neighborhood character
- Highly diverse neighborhood (Simpson 0.73)
- Race & ethnicity
- Hispanic / Latino 38% Asian 31% Two or more races 21% White 13% Black 11% Pacific Islander 1%
- Hispanic origin (detail)
- Mexican 34%
- Common ancestry
- Italian 1% Russian 1%
- Foreign-born
- 27% · Canada, Vietnam, China
- Languages at home
- 49% English-only · Spanish 25% Other Asian/Pacific 12% Other Indo-European 6%
Political lean MEDSL · San Joaquin
- 2024 margin
- Toss-up / Even · D 48.0% · R 48.9% · Other 3.0%
- 2008→2024 swing
- -11.6pp toward R · 2008: 10.7pp · 2024: -0.9pp
- All cycles
- 2024: R+0.9 2020: D+13.9 2016: D+12.9 2012: D+8.9 2008: D+10.7
Not yet ingested
- Civics
- —
Market trends
- HPI YoY
- ▼ -283.31%
- Current HPI
- 349.495
- Rent YoY
- ▲ 7.09%
- Metro
- Stockton, CA
- State GDP YoY
- ▲ 3.21%
- F500 in state
- 116
Industry mix (Fortune 500 HQ in CA)
| Industry | F500 HQs | Revenue |
|---|---|---|
| Technology | 27 | $1,492B |
|
||
| Financial Services | 3 | $174B |
|
||
| Retail | 3 | $44B |
|
||
| Insurance | 3 | $26B |
|
||
| Media / Entertainment | 2 | $115B |
|
||
| Pharmaceuticals / Biotech | 2 | $62B |
|
||
Cash-flow waterfall
monthlySold comps — $/sqft
last 12 mo · ≤1 miLoading sold comps…