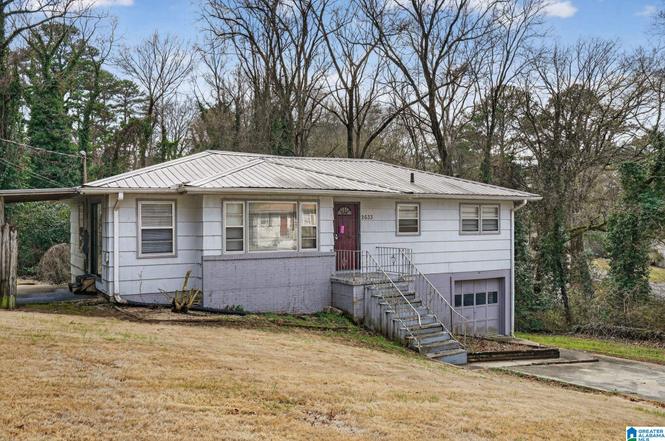
2633 1st St NE · Center Point, AL
Flood risk 1/10 · Minimal
- FEMA flood zone
- X (unshaded)
- Chance of flooding over 30 yrs
- 0.0%
- Est. flood insurance / yr
- $473 – $860
Fire risk 3/10 · Minor
- Est. fire insurance / yr
- $916 – $1,700
Heat risk 5/10 · Moderate
- Hot days now (above 105°F)
- 7 days/yr
- Hot days in 30 yrs
- 18 days/yr
Wind risk 6/10 · Moderate
- Chance of severe wind over 30 yrs
- 27.0%
Air-quality risk 5/10 · Moderate
- Unhealthy air days now
- 6 days/yr
- Unhealthy air days in 30 yrs
- 11 days/yr
Risk factors via First Street. Map © Google.
Why this score? — see what drove the B grade
The composite is a weighted blend of 9 inputs, each scored 0–100. Each bar is that input's sub-score; the figure is the points it added to the 100-point composite (weight × sub-score).
- Cash flow +28.3/30.0
- ARV discount +15.0/15.0
- DSCR +10.0/10.0
- 1% rule +7.5/10.0
- Rent growth +3.3/5.0
- Livability +3.2/5.0
- Condition / age +2.5/5.0
- Schools +1.8/10.0
- Appreciation +0.0/10.0
$109,900
🖨 Deal sheet 📄 Offer letter ✓ Due diligence
Listing remarks
Set on a sloping lot with mature trees, this home offers multiple indoor and outdoor living spaces and a functional layout. The exterior features a covered patio area, elevated deck, and driveway access to a lower-level garage and workspace. Inside, the main living area includes large windows, neutral walls, and carpeted floors with access to the deck through sliding glass doors. The kitchen is equipped with wood cabinetry, laminate countertops, a double-basin sink, and sleek appliances including a range and refrigerator. Several bedrooms provide comfortable space and natural light, while one room features extensive built-in shelving suitable for storage or a home office. A tiled bathroom i
Key facts
- Finished space
- Lower-level garage
- Elevated deck
Tags
Neighborhood map
What this means for you Summary
Snapshot
- This is a 3-bed/2.0-bath single-family listed at $110k.
Deal economics
- At list price, monthly cash flow is $353 ($4k/yr) — positive.
- The deal already cash-flows at list — no discount required.
- Meets the 1% rule at list price ($1k rent vs $110k).
- Recommended offer: $108k (1.5% below list) — sets the bar for market timing.
- Cap rate 10.1% vs local median 7.3% in Center Point — top-decile yield for the area; either an underpriced asset or a hidden risk that comps aren't pricing in. Stress-test before assuming the spread holds.
Location & tenants
- Location reads 63/100 on livability (#193 in AL) — a middle-class / working-renter tenant base. Strengths: cost of living A+, commute A, housing A; Watch: crime D, amenities F, employment F.
- Jefferson County (suburban): math 9% / reading 32% proficiency, ranked #104 of 129 in AL (top 81%) — low school quality limits family demand, transient renter base, plan for 1-2y turnover.
- Zoned schools: Center Point Elementary School (618 students, 82% FRL); Center Point High School (math 2% / reading 2%, grade F, #291 of 305 statewide, top 100%, 774 students, 91% FRL) — zoned schools average 86% FRL vs 49% district-wide (38 pts higher); higher-poverty schools than district average — tighter screening recommended.
- Zoned-school proficiency averages 2% at this address vs 20% district-wide (-18 pts) — the specific schools serving this property underperform the Jefferson County average; the district grade overstates school quality for this exact location.
- Market conditions: Rents rising (+3.0%/yr); 334 active listings in the ZIP; 40 comparable units currently listed for rent nearby; rentals at typical pace (median 24d on market — plan ~3-4 weeks tenant-placement turnaround); 42% of comp listings sitting > 30 days — soft ceiling on asking rent; 2,114 units permitted in Jefferson County in 2024 (556 in 5+ unit buildings).
Forward outlook
- Local home prices are declining (-3.0%/yr); year-one equity from $760 of loan paydown is wiped out by about $3k of value loss. Plan a longer hold.
- Jefferson County population projected to shrink 4% by 2050 — rents likely to lag national; underwrite the cash flow, not the appreciation.
- At projected returns (-3.0% appreciation + 3.0% rent growth), your $31k cash investment doubles in ~9 years — after that, you're playing with house money.
Negotiation context
- It's been on market 15 days — a 2% lower offer ($108k) is reasonable based on typical stale-listing flexibility.
- 2 sale attempts with the ask held roughly flat each time — persistent listings suggest the price (not the market) is what's stuck; bring a comps-based counter.
Risks & watch-outs
- Watch-outs: built in 1955 — expect roof / HVAC / electrical / plumbing capex.
- Climate carrying-cost: major wind risk, 27% chance of damaging wind over 30y; extreme-heat days projected 7→18/yr by 2055 (HVAC capex compounding) — expect insurance premiums to compound above CPI over the hold.
Questions for the listing agent
- Built in 1955 — when were the roof, HVAC, electrical panel, plumbing, and water heater last replaced?
- Is there a deadline driving the sale (1031 exchange, divorce, estate, relocation)? That informs how much negotiation room exists.
- Schools are F-rated, which usually means shorter tenancies and higher turnover. Who's the typical renter profile here, and what's been the actual vacancy rate?
- Crime grade is D in this area — have there been break-ins, vandalism, or insurance claims at this property in the last 3 years? What carrier currently insures it and at what premium?
- What's the average days-on-market for RENTAL listings here right now (not sales)? A rising rental-DOM trend means longer vacancies and softer asking-rent achievability than the comps imply.
- What's the recent tenant-quality profile in this submarket — average credit score on applications, eviction rate, late-payment / NSF rate, and stable-employment percentage? A property-management company in the area should have these aggregated.
- How much new for-sale + rental construction is in the pipeline within 1–3 miles? Heavy new supply typically softens prices + rents 12–24 months out; constrained supply supports both.
Investment metrics
- 1% rule
- 1.25% ✓
- Cap rate
- 10.15%
- Cash-on-cash
- 13.78%
- DSCR
- 1.61
- GRM
- 6.7
CMA / ARV
- ARV (on-the-fly)
- $175,924
- Comps found
- 12
Show comp detail 12 sales within ~0.75 mi
| Address | Dist | Beds/Ba | Sqft | Sold | Price | $/sf | Match |
|---|---|---|---|---|---|---|---|
| 317 26th Ave NE | 0.25mi | 3/1.5 | 1,500 (+4%) | 7mo | $158,500 | $106 | 74 |
| 2532 5th St NE | 0.45mi | 3/2.0 | 1,560 (+8%) | 3mo | $190,000 | $122 | 63 |
| 2620 2nd Way NW | 0.66mi | 4/2.0 (+1) | 1,451 (+1%) | 1mo | $220,000 | $152 | 62 |
| 4558 Cantebury Ln | 0.70mi | 3/2.0 | 1,470 (+2%) | 4mo | $244,900 | $167 | 60 |
| 2505 2nd St NW | 0.51mi | 3/1.0 | 1,386 (-4%) | 7mo | $134,500 | $97 | 60 |
| 2236 2nd Pl NE | 0.69mi | 3/2.0 | 1,392 (-4%) | 3mo | $195,000 | $140 | 60 |
| 613 25th Ave NE | 0.65mi | 3/2.0 | 1,400 (-3%) | 7mo | $93,000 | $66 | 59 |
| 3105 3rd St NE | 0.53mi | 3/2.0 | 1,593 (+10%) | 5mo | $169,500 | $106 | 54 |
| 5111 Cantebury Ct | 0.67mi | 3/2.0 | 1,551 (+8%) | 10mo | $255,000 | $164 | 48 |
| 227 27th Court Cir NW | 0.73mi | 3/2.0 | 1,338 (-7%) | 8mo | $60,000 | $45 | 47 |
| 2276 4th Place Cir NE | 0.69mi | 3/1.5 | 1,334 (-8%) | 9mo | $170,000 | $127 | 46 |
| 217 23rd Ter NW | 0.72mi | 3/1.5 | 1,232 (-15%) | 4mo | $86,000 | $70 | 37 |
Match score weights: distance 35% · size 25% · config 20% · recency 20%. Top-matched comps best support the ARV.
Projected returns pro-forma
-3.0% appreciation · 3.04% rent growth · sell at horizon
- IRR
- 4.0%
- Equity multiple
- 1.15×
- Total profit
- $4,747
- Equity at exit
- $16,386
- IRR
- 13.5%
- Equity multiple
- 2.08×
- Total profit
- $33,337
- Equity at exit
- $9,502
Cash invested: $30,772 (down + closing). Projections, not guarantees.
Landlord ↔ Tenant lean methodology
- Overall (STATE)
- 90 Strongly Landlord-Friendly
- State Alabama
- 90 Strongly Landlord-Friendly · R+15
- County
- — inherits STATE
- City
- — inherits STATE
ZIP-level market 35215
- Home prices YoY
- -34.4%
- Rents YoY
- 3.0%
- Active inventory
- 334
- Price-to-rent
- 6.7×
Monthly cashflow live
- Estimated rent
- $1,370 high interval (Pro) →
- Mortgage (P&I)
- −$576
- Tax from tax record
- −$107 /mo · $1,283/yr
- Insurance
- −$46
- HOA
- −$0
- Vacancy / Maint / Mgmt
- −$288
- Net cashflow
- $353
Break-even live
UW: 25.0% down · 7.5% · 30yr · 1.5% tax · 5.0% vac · 8.0% maint · 8.0% mgmt
Financing live
Cash to close
- Down payment
- $27,475
- Closing costs
- $3,297
- Reserves months
- —
- Total cash needed
- —
Loan-product check · same deal, 3 products live
Conventional
25% down · 7.5% · 30yr
- Down + closing
- —
- Monthly P&I
- —
- Monthly cashflow
- —
- DSCR
- —
- Eligible?
- —
Personal DTI + credit; lowest rate.
DSCR
20% down · 8.5% · 30yr
- Down + closing
- —
- Monthly P&I
- —
- Monthly cashflow
- —
- DSCR
- —
- Eligible?
- —
No personal income docs; deal must DSCR.
Hard money
10% down · 12.0% · 12mo
- Down + closing
- —
- Monthly P&I
- —
- Monthly cashflow
- —
- DSCR
- —
- Eligible?
- —
Short-term bridge; refi at stabilization.
Rent comps 40 comps
| Address | Beds | Baths | Sqft | Rent | $/sqft | DOM | Units | Dist |
|---|---|---|---|---|---|---|---|---|
| 2629 Wood Dr NE Center Point, AL | 3.0 | 1.0 | 1203 | $1,250 | $1.04 | 43d | 1 | 0.05mi |
| 2537 3rd St NE Center Point, AL | 3.0 | 2.0 | 1040 | $1,350 | $1.30 | 23d | 1 | 0.16mi |
| 127 Fox Hill Ct Center Point, AL | 3.0 | 2.0 | 1418 | $1,545 | $1.09 | 43d | 1 | 0.33mi |
| 2324 3rd St NE Center Point, AL | 3.0 | 2.0 | 1329 | $1,300 | $0.98 | 23d | 1 | 0.44mi |
| 3309 Chase Ln Unit 3309 Birmingham, AL | 2.0 | 2.0 | 1068 | $1,000 | $0.94 | 43d | 1 | 0.46mi |
| 109 24th Ave NW Center Point, AL | 3.0 | 1.5 | 1023 | $1,215 | $1.19 | 43d | 1 | 0.48mi |
| 2655 6th St NE Center Point, AL | 3.0 | 2.0 | 1600 | $1,390 | $0.87 | 2d | 1 | 0.53mi |
| 2708 7th St NE Center Point, AL | 3.0 | 1.0 | 1451 | $1,150 | $0.79 | 43d | 1 | 0.55mi |
| 605 Country View Dr Birmingham, AL | 3.0 | 2.0 | 1698 | $1,560 | $0.92 | 43d | 1 | 0.55mi |
| 607 Country View Dr Birmingham, AL | 4.0 | 2.0 | 1568 | $1,550 | $0.99 | 23d | 1 | 0.57mi |
| 3073 Panorama E Birmingham, AL | 1.0–3.0 | 1.0–2.0 | 975 | $1,275 | $1.31 | 1d | 20 | 0.61mi |
| 332 23rd Ave NE Center Point, AL | 3.0 | 1.0 | 1100 | $1,350 | $1.23 | 2d | 1 | 0.61mi |
| 2245 3rd St NE Center Point, AL | 3.0 | 1.0 | 1150 | $1,100 | $0.96 | 23d | 1 | 0.63mi |
| 2318 Raintree Ct Center Point, AL | 2.0 | 1.0 | 975 | $1,100 | $1.13 | 2d | 2 | 0.66mi |
| 2229 3rd St NE Center Point, AL | 3.0 | 1.0 | 1215 | $1,125 | $0.93 | 23d | 1 | 0.73mi |
| 202 Westchester Dr Birmingham, AL | 4.0 | 2.0 | 1374 | $1,300 | $0.95 | 23d | 1 | 0.78mi |
| 2249 4th Place Cir NE Center Point, AL | 3.0 | 1.5 | 1400 | $1,400 | $1.00 | 43d | 1 | 0.79mi |
| 232 Glenvalley Ln NW Birmingham, AL | 4.0 | 2.0 | 954 | $1,610 | $1.69 | 2d | 1 | 0.80mi |
| 408 Sunhill Rd NW Center Point, AL | 3.0 | 1.5 | 1290 | $1,355 | $1.05 | 43d | 1 | 0.80mi |
| 2245 3rd St NW Center Point, AL | 3.0 | 1.0 | 1156 | $1,100 | $0.95 | 23d | 1 | 0.89mi |
| 2232 6th St NE Center Point, AL | 3.0 | 1.0 | 1550 | $1,150 | $0.74 | 43d | 1 | 0.91mi |
| 2416 4th St NW Center Point, AL | 4.0 | 2.0 | 1400 | $1,500 | $1.07 | 23d | 1 | 0.93mi |
| 2412 4th St NW Center Point, AL | 3.0 | 1.0 | 1224 | $1,150 | $0.94 | 16d | 1 | 0.93mi |
| 319 23rd Ave NW Center Point, AL | 3.0 | 2.0 | 1284 | $1,395 | $1.09 | 43d | 1 | 0.95mi |
| 2323 4th St NW Center Point, AL | 3.0 | 1.0 | 1038 | $1,305 | $1.26 | 2d | 1 | 0.95mi |
| 2613 5th St NW Center Point, AL | 3.0 | 1.0 | 1170 | $1,150 | $0.98 | 11d | 1 | 0.99mi |
| 413 20th Ct NE Center Point, AL | 3.0 | 1.5 | 1540 | $1,375 | $0.89 | 43d | 1 | 1.02mi |
| 2320 5th St NW Center Point, AL | 3.0 | 1.0 | 1098 | $1,150 | $1.05 | 43d | 1 | 1.07mi |
| 509 20th Ave NE Center Point, AL | 3.0 | 1.5 | 1008 | $1,200 | $1.19 | 23d | 1 | 1.14mi |
| 532 26th Ave NW Center Point, AL | 4.0 | 1.0 | 1644 | $1,250 | $0.76 | 43d | 1 | 1.15mi |
| 2415 Ormond Dr Center Point, AL | 3.0 | 1.5 | 1194 | $1,295 | $1.08 | 43d | 1 | 1.19mi |
| 149 Martin Dr Birmingham, AL | 3.0 | 2.0 | 1164 | $1,485 | $1.28 | 23d | 1 | 1.21mi |
| 107 Sterling Ct NW Center Point, AL | 2.0 | 1.5–2.0 | 1026 | $1,062 | $1.04 | 2d | 4 | 1.22mi |
| 1104 Oak Creek Trl NE Birmingham, AL | 3.0 | 2.0 | 1233 | $1,543 | $1.25 | 2d | 1 | 1.23mi |
| 856 Parkbrook Trl Birmingham, AL | 1.0–3.0 | 1.0–2.0 | 925 | $1,180 | $1.28 | 2d | 10 | 1.24mi |
| 424 Tupelo Way Center Point, AL | 4.0 | 2.0 | 1233 | $1,300 | $1.05 | 43d | 1 | 1.27mi |
| 4464 Winchester Hills Way Birmingham, AL | 3.0 | 2.0 | 1178 | $1,750 | $1.49 | 43d | 1 | 1.28mi |
| 1905 2nd St NW Center Point, AL | 3.0 | 1.0 | 1258 | $1,395 | $1.11 | 43d | 1 | 1.28mi |
| 4464 Winchester Hills Ln Pinson, AL | 3.0 | 2.0 | 1500 | $1,750 | $1.17 | 11d | 1 | 1.28mi |
| 113 19th Ave NW Center Point, AL | 3.0 | 2.0 | 1407 | $1,250 | $0.89 | 11d | 1 | 1.31mi |
Listing history 9 events
-
2026-04-20status Pending
-
2026-04-11price $109,900
-
2026-04-10status Active
-
2026-03-11status Pending
-
2026-03-06$114,900 Active
-
2024-03-11soldstatus $406,018,000
-
2016-09-13soldstatus $8,083,550
-
2015-07-17soldstatus $69,000
-
1999-04-01soldstatus $76,000
ⓘ Source: listings_history table (triggers on properties + properties_extension) + one-shot
backfill from property_details.listing_events for pre-trigger history.
Tax reassessment forecast AL · Resets to sale price
- Current annual tax
- $1,283 · $107/mo
- Projected year-2 tax
- $1,283 · $107/mo
- Expected delta
- $0/yr ($0/mo · 0.0%)
ⓘ Screening estimate from a state-policy table — verify with the county assessor before closing.
Climate risk First Street
- Flood 1/10 Low FEMA zone X (unshaded) · 0% chance over 30 yrs
- Wildfire 3/10 Moderate
- Heat 5/10 Major 7 d/yr ≥105°F today · 18 d/yr by 30 yrs out
- Wind 6/10 Major 27% chance of damaging wind over 30 yrs
- Air quality 5/10 Major 6 unhealthy d/yr today · 11 by 30 yrs out
Nearby sold comps map
Loading sold comps map…
Walkable amenities ~0.75 mi
Loading nearby amenities…
Taxation est. · year 1
- Rental income
- $16,439
- − Mortgage interest
- −$6,156
- − Property taxes
- −$1,283
- − Insurance
- −$550
- − Repairs & maintenance
- −$1,315
- − Management
- −$1,315
- − Depreciation
- −$3,197
- Taxable income
- $2,624
- Est. tax owed @ 24.0%
- −$630
- After-tax cash flow
- $3,609/yr
For passive investors: Depreciation is non-cash, so a rental often shows a tax loss while cash-flowing — sheltering income. Rental losses are passive: they offset passive income freely, and up to $25,000/yr can offset ordinary (W-2) income if you actively participate and your MAGI is under $100k (phasing out to $0 by $150k); unused losses carry forward. On sale, claimed depreciation is recaptured at up to 25%, and gains may owe capital-gains tax (a 1031 exchange can defer both). Figures are a year-1 estimate at your 24.0% rate — not tax advice; consult a CPA.
Schools (NCES district)
- District
- Jefferson County
- NCES district ID
- 0101920
- Math proficiency
- 9% ▼ -24.00%
- Reading proficiency
- 32% ▼ -5.00%
- Median HH income
- $51,712
- Composite
- 18.4/100
- National rank
- #8937
- State rank
- #104 of 129 in AL
Livability — Center Point
- Score
- 63/100
- State rank
- #193
- US rank
- #15671
Category grades
Schools grade is shown separately in the Schools card above.
Census & demographics
- Census place
- Center Point, AL
- County
- Jefferson County · 527,445 people
- City population
- 43,903
- Metro
- Birmingham-Hoover, AL
- Population (ZIP)
- 43,903
- Household income
- $52,793
- Rent vs Own
- Severe rent burden
- 1729.0
Population outlook (Jefferson County) Hauer SSP2
- Today (2025)
- 669,185 people
- By 2030
- 669,694 · +0.1%
- By 2040
- 661,388 · -1.2%
- By 2050
- 643,086 · -3.9%
- By 2075
- 577,267 · -13.7%
- By 2100
- 474,758 · -29.1%
Race, ethnicity, and origin ACS 2023
- Neighborhood character
- Predominantly Black (75%)
- Race & ethnicity
- Black 75% White 15% Hispanic / Latino 7% Two or more races 3%
- Hispanic origin (detail)
- Mexican 4%
- Common ancestry
- Lithuanian 1% Italian 1% Slovak 1%
- Foreign-born
- 4% · Canada
- Languages at home
- 92% English-only · Spanish 7%
Political lean MEDSL · Jefferson
- 2024 margin
- D (+10.4) · D 54.6% · R 44.2% · Other 1.2%
- 2008→2024 swing
- +5.4pp toward D · 2008: 5.1pp · 2024: 10.4pp
- All cycles
- 2024: D+10.4 2020: D+13.2 2016: D+7.2 2012: D+6.0 2008: D+5.1
Not yet ingested
- Civics
- —
Market trends
- HPI YoY
- ▼ -112.97%
- Current HPI
- 215.0607
- Rent YoY
- ▲ 3.04%
- Metro
- Birmingham-Hoover, AL
- State GDP YoY
- ▲ 2.94%
- F500 in state
- 4
Industry mix (Fortune 500 HQ in AL)
| Industry | F500 HQs | Revenue |
|---|---|---|
| Financial Services | 1 | $8B |
|
||
| Healthcare | 1 | $5B |
|
||
Price history
+44.6% since first listed9 events — show timeline
- 2026-04-20 Pending — Greater Alabama MLS
- 2026-04-11 Price Changed $109,900 Greater Alabama MLS
- 2026-04-10 Relisted — Greater Alabama MLS
- 2026-03-11 Pending — Greater Alabama MLS
- 2026-03-06 Listed $114,900 Greater Alabama MLS
- 2024-03-11 Sold (Public Records) $406,018,000 Public Records
- 2016-09-13 Sold (Public Records) $8,083,550 Public Records
- 2015-07-17 Sold (Public Records) $69,000 Public Records
- 1999-04-01 Sold (Public Records) $76,000 Public Records
Property tax history
+12.1%/yrLatest (2025): $1,283 · +0.0% YoY. Source: county tax records.
Cash-flow waterfall
monthlySold comps — $/sqft
last 12 mo · ≤1 miLoading sold comps…