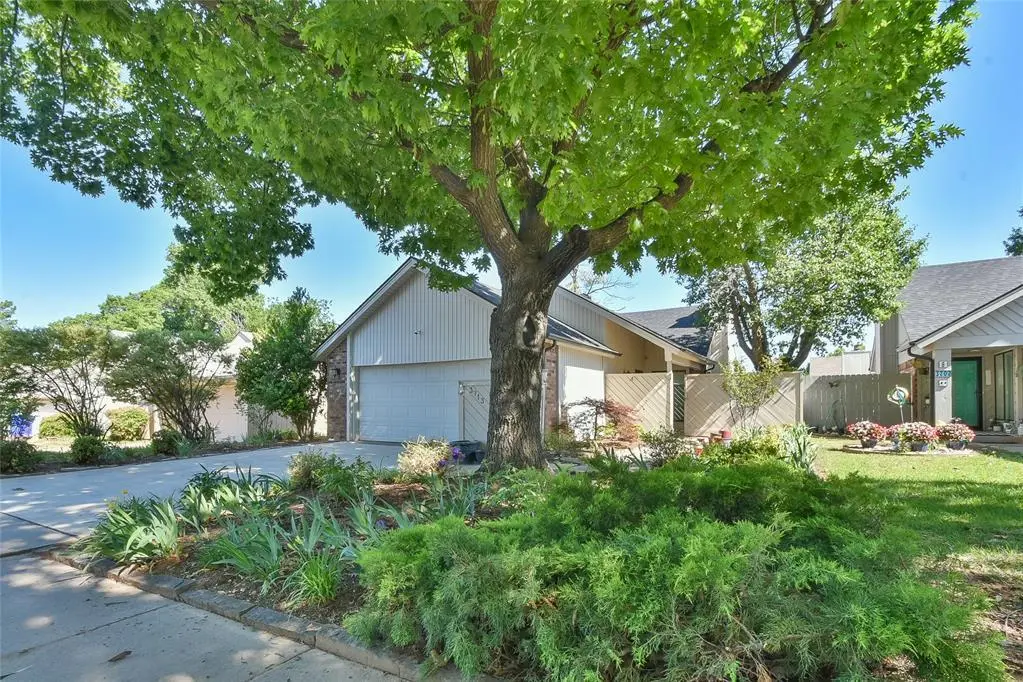
3713 River Oaks Dr · Norman, OK
Flood risk 1/10 · Minimal
- FEMA flood zone
- X (unshaded)
- Chance of flooding over 30 yrs
- 0.0%
- Est. flood insurance / yr
- $507 – $1,088
Fire risk 3/10 · Minor
- Est. fire insurance / yr
- $2,463 – $4,575
Heat risk 6/10 · Moderate
- Hot days now (above 109°F)
- 7 days/yr
- Hot days in 30 yrs
- 19 days/yr
Wind risk 2/10 · Minimal
- Chance of severe wind over 30 yrs
- 4.0%
Air-quality risk 2/10 · Minimal
- Unhealthy air days now
- 1 days/yr
- Unhealthy air days in 30 yrs
- 1 days/yr
Risk factors via First Street. Map © Google.
Why this score? — see what drove the D grade
The composite is a weighted blend of 9 inputs, each scored 0–100. Each bar is that input's sub-score; the figure is the points it added to the 100-point composite (weight × sub-score).
- Cash flow +12.8/30.0
- ARV discount +9.5/15.0
- Livability +4.2/5.0
- DSCR +3.8/10.0
- Rent growth +3.7/5.0
- 1% rule +2.9/10.0
- Schools +2.6/10.0
- Condition / age +2.5/5.0
- Appreciation +0.0/10.0
$199,900
🖨 Deal sheet 📄 Offer letter ✓ Due diligence
Listing remarks MLS
THIS IS THE ONE YOU'RE LOOKING FOR! ONE FLOOR, FIREPLACE, GREAT PATIO AREA, SOME NEW CARPET. BRIGHT! BACK GARDEN AREA IS NEGLECTED, BUT COULD BE CHARMING. PRIVATE AND COZY!
Key facts
- Private bath
- Natural light
- Wet bar feature
Tags
Property features AI
Finance
- Other: Located in the Cedar Ridge addition; Interior living area reported as 1,375 (assessor); Occupied; No storm shelter; Not historically designated
- Financial info: Loan financing available; Not assumable
- HOA & community: No mandatory association dues
Exterior
- Parking: Attached 2-car garage
- Utilities: Electricity available; Natural gas available
- Home design: Single-family residence; One level; Residential property
- Construction: Brick and frame with vinyl siding; Composition roof; Slab foundation; Existing property
- Exterior features: Covered patio; Interior lot
Interior
- Kitchen: Free-standing electric range/oven
- Bedrooms: 3 bedrooms
- Flooring: Combo flooring; Tile flooring; Wood flooring
- Bathrooms: 2 full bathrooms
- Interior features: One living area; Dining area; Gas log fireplace; Combination, tile, and wood flooring
Neighborhood map
What this means for you Summary
Snapshot
- This is a 3-bed/2.0-bath single-family listed at $200k.
Deal economics
- At list price, monthly cash flow is $-19 ($-224/yr) — negative.
- To cash-flow at today's rent, offer at most $197k (1.6% below list).
- To meet the 1% rule (rent ≥ 1% of price), the offer needs to be $158k (21.0% below list).
- Recommended offer: $158k (21.0% below list) — sets the bar for 1% rule.
- Cap rate 6.2% vs local median 3.6% in Norman — top-decile yield for the area; either an underpriced asset or a hidden risk that comps aren't pricing in. Stress-test before assuming the spread holds.
Location & tenants
- Location reads 85/100 on livability (#1 in OK, #557 nationally) — a professional / high-income tenant draw. Strengths: amenities A+, commute A+, cost of living A+.
- Norman (suburban): math 27% / reading 32% proficiency, ranked #61 of 270 in OK (top 23%) — low school quality limits family demand, transient renter base, plan for 1-2y turnover.
- Zoned schools: Truman Es (math 30% / reading 29%, grade F, #255 of 845 statewide, top 35%, 333 students, 0% FRL); Norman North Hs (math 45% / reading 57%, grade D+, #2 of 447 statewide, top 0%, 2,401 students, 0% FRL) — zoned schools average 0% FRL vs 39% district-wide (39 pts lower); this property's tenant base skews higher-income than the district average.
- Market conditions: Rents rising fast (+4.8%/yr); 377 active listings in the ZIP; 23 comparable units currently listed for rent nearby; rentals at typical pace (median 24d on market — plan ~3-4 weeks tenant-placement turnaround); solid renter incomes; 592 units permitted in Cleveland County in 2024 (12 in 5+ unit buildings).
Forward outlook
- Local home prices are declining (-3.0%/yr); year-one equity from $1k of loan paydown is wiped out by about $6k of value loss. Plan a longer hold.
- Cleveland County population projected at +40% by 2050 — long-run rental-demand tailwind backs the buy-and-hold thesis.
Negotiation context
- Only 2 days on market — expect competitive offers; lowballing is unlikely to land.
- 2 sale attempts since 21y ago with the ask held roughly flat each time — persistent listings suggest the price (not the market) is what's stuck; bring a comps-based counter.
- Current owner paid $120k; list at $200k implies a 67% gain — meaningful room to come down on a strong offer.
Risks & watch-outs
- Climate carrying-cost: extreme-heat days projected 7→19/yr by 2055 (HVAC capex compounding) — expect insurance premiums to compound above CPI over the hold.
Questions for the listing agent
- What do current leases actually rent for vs. the listed asking? Can we see a recent rent roll and the last 12 months of T-12 income?
- Is there a deadline driving the sale (1031 exchange, divorce, estate, relocation)? That informs how much negotiation room exists.
- The area grade is low — what's the realistic commute time and amenity access for the typical tenant pool here? Any planned neighborhood developments (good or bad) we should know about?
- What's the average days-on-market for RENTAL listings here right now (not sales)? A rising rental-DOM trend means longer vacancies and softer asking-rent achievability than the comps imply.
- What's the recent tenant-quality profile in this submarket — average credit score on applications, eviction rate, late-payment / NSF rate, and stable-employment percentage? A property-management company in the area should have these aggregated.
- How much new for-sale + rental construction is in the pipeline within 1–3 miles? Heavy new supply typically softens prices + rents 12–24 months out; constrained supply supports both.
Investment metrics
- 1% rule
- 0.79% ✗
- Cap rate
- 6.18%
- Cash-on-cash
- -0.40%
- DSCR
- 0.98
- GRM
- 10.6
CMA / ARV
- ARV (on-the-fly)
- $209,000
- Comps found
- 12
Show comp detail 12 sales within ~0.75 mi
| Address | Dist | Beds/Ba | Sqft | Sold | Price | $/sf | Match |
|---|---|---|---|---|---|---|---|
| 510 Rambling Oaks Dr | 0.46mi | 3/2.0 | 1,394 (+1%) | 1mo | $325,000 | $233 | 76 |
| 3799 Apex Ct | 0.34mi | 2/2.0 (-1) | 1,460 (+6%) | 2mo | $222,000 | $152 | 67 |
| 505 Trinidad Dr | 0.62mi | 3/2.0 | 1,422 (+3%) | 0mo | $210,000 | $148 | 66 |
| 4027 Green Hills Dr | 0.41mi | 3/2.0 | 1,408 (+2%) | 14mo | $193,000 | $137 | 65 |
| 115 Willoway Dr | 0.53mi | 3/2.0 | 1,354 (-2%) | 9mo | $205,000 | $151 | 65 |
| 408 Midland Dr | 0.53mi | 3/2.0 | 1,337 (-3%) | 11mo | $205,000 | $153 | 62 |
| 805 Bass Ct | 0.57mi | 3/2.0 | 1,495 (+9%) | 3mo | $225,000 | $151 | 57 |
| 3786 Apex Ct | 0.35mi | 2/2.0 (-1) | 1,487 (+8%) | 14mo | $235,000 | $158 | 53 |
| 3805 Tudor Cir | 0.72mi | 3/2.0 | 1,459 (+6%) | 6mo | $209,900 | $144 | 51 |
| 817 Branchwood Ct | 0.53mi | 3/2.0 | 1,225 (-11%) | 13mo | $205,000 | $167 | 46 |
| 3313 Resh Ct | 0.45mi | 3/1.5 | 1,182 (-14%) | 10mo | $140,000 | $118 | 46 |
| 4404 Midway St | 0.65mi | 3/2.0 | 1,566 (+14%) | 5mo | $245,000 | $156 | 43 |
Match score weights: distance 35% · size 25% · config 20% · recency 20%. Top-matched comps best support the ARV.
Projected returns pro-forma
-3.0% appreciation · 4.77% rent growth · sell at horizon
- IRR
- -15.2%
- Equity multiple
- 0.45×
- Total profit
- $-30,767
- Equity at exit
- $29,806
- IRR
- -4.1%
- Equity multiple
- 0.71×
- Total profit
- $-16,342
- Equity at exit
- $17,284
Cash invested: $55,972 (down + closing). Projections, not guarantees.
Landlord ↔ Tenant lean methodology
- Overall (STATE)
- 83 Strongly Landlord-Friendly
- State Oklahoma
- 83 Strongly Landlord-Friendly · R+20
- County
- — inherits STATE
- City
- — inherits STATE
ZIP-level market 73072
- Rents YoY
- 4.8%
- Active inventory
- 377
- Price-to-rent
- 10.6×
Monthly cashflow live
- Estimated rent
- $1,579 high interval (Pro) →
- Mortgage (P&I)
- −$1,048
- Tax from tax record
- −$134 /mo · $1,611/yr
- Insurance
- −$83
- HOA
- −$0
- Vacancy / Maint / Mgmt
- −$332
- Net cashflow
- $-19
Break-even live
UW: 25.0% down · 7.5% · 30yr · 1.5% tax · 5.0% vac · 8.0% maint · 8.0% mgmt
Financing live
Cash to close
- Down payment
- $49,975
- Closing costs
- $5,997
- Reserves months
- —
- Total cash needed
- —
Loan-product check · same deal, 3 products live
Conventional
25% down · 7.5% · 30yr
- Down + closing
- —
- Monthly P&I
- —
- Monthly cashflow
- —
- DSCR
- —
- Eligible?
- —
Personal DTI + credit; lowest rate.
DSCR
20% down · 8.5% · 30yr
- Down + closing
- —
- Monthly P&I
- —
- Monthly cashflow
- —
- DSCR
- —
- Eligible?
- —
No personal income docs; deal must DSCR.
Hard money
10% down · 12.0% · 12mo
- Down + closing
- —
- Monthly P&I
- —
- Monthly cashflow
- —
- DSCR
- —
- Eligible?
- —
Short-term bridge; refi at stabilization.
Rent comps 23 comps
| Address | Beds | Baths | Sqft | Rent | $/sqft | DOM | Units | Dist |
|---|---|---|---|---|---|---|---|---|
| 717 36th Ave NW Norman, OK | 3.0 | 2.0 | 1520 | $1,395 | $0.92 | 11d | 1 | 0.36mi |
| 300 36th Ave SW Norman, OK | 1.0–3.0 | 1.0–2.5 | 969 | $1,848 | $1.91 | 1d | 1 | 0.41mi |
| 612 Springwood St Norman, OK | 3.0 | 2.0 | 1268 | $1,395 | $1.10 | 14d | 1 | 0.43mi |
| 4201 Colony Dr Norman, OK | 3.0 | 2.0 | 1520 | $1,395 | $0.92 | 23d | 1 | 0.48mi |
| 847 Rambling Oaks Dr Norman, OK | 3.0 | 2.5 | 1469 | $1,700 | $1.16 | 23d | 1 | 0.56mi |
| 4307 Monticello Rd Norman, OK | 2.0 | 2.0 | 1117 | $1,275 | $1.14 | 3d | 1 | 0.57mi |
| 3213 Barley Ct Norman, OK | 3.0 | 2.5 | 1695 | $1,680 | $0.99 | 23d | 1 | 0.60mi |
| 102 Harvard Rd Unit 102 Norman, OK | 2.0 | 2.5 | 1100 | $1,200 | $1.09 | 23d | 1 | 0.64mi |
| 304 Eccell Ct Norman, OK | 3.0 | 2.0 | 1573 | $1,750 | $1.11 | 3d | 1 | 0.72mi |
| 4222 Willowisp Dr Norman, OK | 2.0 | 1.0 | 885 | $1,100 | $1.24 | 23d | 1 | 0.74mi |
| 309 Hood Ct Norman, OK | 3.0 | 2.0 | 1576 | $1,750 | $1.11 | 23d | 1 | 0.74mi |
| 4517 Newport Dr Norman, OK | 3.0 | 2.0 | 1810 | $1,800 | $0.99 | 23d | 1 | 0.77mi |
| 213 Pinafore Dr Norman, OK | 3.0 | 2.0 | 1404 | $1,800 | $1.28 | 23d | 1 | 0.82mi |
| 2313 Crestmont St Norman, OK | 2.0 | 2.0 | 900 | $975 | $1.08 | 23d | 1 | 1.05mi |
| 515 24th Ave NW Norman, OK | 2.0 | 1.0–1.5 | 975 | $1,034 | $1.06 | 3d | 2 | 1.08mi |
| 4917 Baker St Norman, OK | 3.0 | 2.0 | 1745 | $2,000 | $1.15 | 23d | 1 | 1.16mi |
| 4917 Baker St Norman, OK | 3.0 | 2.0 | 1745 | $2,000 | $1.15 | 3d | 1 | 1.16mi |
| 3001 Pheasant Run Rd Norman, OK | 1.0–2.0 | 1.0–2.0 | 700 | $1,189 | $1.70 | 3d | 8 | 1.20mi |
| 301 Hal Muldrow Dr Norman, OK | 1.0–2.0 | 1.0–2.0 | 857 | $1,100 | $1.28 | 1d | 6 | 1.33mi |
| 4721 Persimmon Ct Norman, OK | 3.0 | 2.0 | 1584 | $1,800 | $1.14 | 3d | 1 | 1.41mi |
| 202 Thompson Dr Norman, OK | 3.0 | 1.5 | 942 | $1,600 | $1.70 | 23d | 1 | 1.42mi |
| 208 Thompson Dr Norman, OK | 2.0 | 1.5 | 982 | $1,400 | $1.43 | 23d | 1 | 1.42mi |
| 214 Thompson Dr Norman, OK | 3.0 | 1.5 | 922 | $1,600 | $1.74 | 23d | 1 | 1.43mi |
Listing history 7 events
-
2026-05-15status Pending
-
2026-05-13$199,900 Active
-
2005-10-26soldstatus $119,500
-
2005-10-25soldstatus $119,500 172-char remark
Show marketing remark (172 chars)
THIS IS THE ONE YOU'RE LOOKING FOR! ONE FLOOR, FIREPLACE, GREAT PATIO AREA, SOME NEW CARPET. BRIGHT! BACK GARDEN AREA IS NEGLECTED, BUT COULD BE CHARMING. PRIVATE AND COZY!
-
2005-08-29historical 172-char remark
Show marketing remark (172 chars)
THIS IS THE ONE YOU'RE LOOKING FOR! ONE FLOOR, FIREPLACE, GREAT PATIO AREA, SOME NEW CARPET. BRIGHT! BACK GARDEN AREA IS NEGLECTED, BUT COULD BE CHARMING. PRIVATE AND COZY!
-
2005-08-20$119,500 172-char remark
Show marketing remark (172 chars)
THIS IS THE ONE YOU'RE LOOKING FOR! ONE FLOOR, FIREPLACE, GREAT PATIO AREA, SOME NEW CARPET. BRIGHT! BACK GARDEN AREA IS NEGLECTED, BUT COULD BE CHARMING. PRIVATE AND COZY!
-
2000-11-09soldstatus $98,000
ⓘ Source: listings_history table (triggers on properties + properties_extension) + one-shot
backfill from property_details.listing_events for pre-trigger history.
Tax reassessment forecast OK · Resets to sale price
- Current annual tax
- $1,611 · $134/mo
- Projected year-2 tax
- $1,799 · $150/mo
- Expected delta
- +$188/yr (+$16/mo · 11.7%)
ⓘ Screening estimate from a state-policy table — verify with the county assessor before closing.
Climate risk First Street
- Flood 1/10 Low FEMA zone X (unshaded) · 0% chance over 30 yrs
- Wildfire 3/10 Moderate
- Heat 6/10 Major 7 d/yr ≥109°F today · 19 d/yr by 30 yrs out
- Wind 2/10 Low 4% chance of damaging wind over 30 yrs
- Air quality 2/10 Low 1 unhealthy d/yr today · 1 by 30 yrs out
Nearby sold comps map
Loading sold comps map…
Walkable amenities ~0.75 mi
Loading nearby amenities…
Taxation est. · year 1
- Rental income
- $18,944
- − Mortgage interest
- −$11,198
- − Property taxes
- −$1,611
- − Insurance
- −$1,000
- − Repairs & maintenance
- −$1,516
- − Management
- −$1,516
- − Depreciation
- −$5,815
- Taxable loss
- −$3,710
- Est. tax savings @ 24.0%
- +$890
- After-tax cash flow
- $666/yr
For passive investors: Depreciation is non-cash, so a rental often shows a tax loss while cash-flowing — sheltering income. Rental losses are passive: they offset passive income freely, and up to $25,000/yr can offset ordinary (W-2) income if you actively participate and your MAGI is under $100k (phasing out to $0 by $150k); unused losses carry forward. On sale, claimed depreciation is recaptured at up to 25%, and gains may owe capital-gains tax (a 1031 exchange can defer both). Figures are a year-1 estimate at your 24.0% rate — not tax advice; consult a CPA.
Schools (NCES district)
- District
- Norman
- NCES district ID
- 4021720
- Math proficiency
- 27% ▼ -9.00%
- Reading proficiency
- 32% ▼ -8.00%
- Median HH income
- $48,940
- Composite
- 25.67/100
- National rank
- #7395
- State rank
- #61 of 270 in OK
Livability — Norman
- Score
- 85/100
- State rank
- #1
- US rank
- #557
Category grades
Schools grade is shown separately in the Schools card above.
Census & demographics
- Census place
- Norman, OK
- County
- Cleveland County · 239,547 people
- City population
- 123,141
- Metro
- Oklahoma City, OK
- Population (ZIP)
- 50,881
- Household income
- $78,546
- Rent vs Own
- Severe rent burden
- 2491.0
Population outlook (Cleveland County) Hauer SSP2
- Today (2025)
- 323,621 people
- By 2030
- 349,070 · +7.9%
- By 2040
- 400,168 · +23.7%
- By 2050
- 454,101 · +40.3%
- By 2075
- 602,926 · +86.3%
- By 2100
- 734,485 · +127.0%
Race, ethnicity, and origin ACS 2023
- Neighborhood character
- Predominantly White (72%)
- Race & ethnicity
- White 72% Two or more races 10% Hispanic / Latino 8% Asian 6% Native American 4% Black 3%
- Hispanic origin (detail)
- Mexican 5%
- Common ancestry
- Slovak 2% Italian 2% Lithuanian 2%
- Foreign-born
- 7% · China, Canada, Dominican Republic
- Languages at home
- 89% English-only · Spanish 4% Chinese 3% Other Indo-European 1%
Political lean MEDSL · Cleveland
- 2024 margin
- R (+14.9) · D 41.4% · R 56.4% · Other 2.2%
- 2008→2024 swing
- +9.1pp toward D · 2008: -24.0pp · 2024: -14.9pp
- All cycles
- 2024: R+14.9 2020: R+14.1 2016: R+21.7 2012: R+25.9 2008: R+24.0
Not yet ingested
- Civics
- —
Market trends
- HPI YoY
- ▼ -190.27%
- Current HPI
- 221.8007
- Rent YoY
- ▲ 4.77%
- Metro
- Oklahoma City, OK
- State GDP YoY
- ▲ 1.55%
- F500 in state
- 6
Industry mix (Fortune 500 HQ in OK)
| Industry | F500 HQs | Revenue |
|---|---|---|
| Energy | 3 | $48B |
|
||
Price history
+104.0% since first listed7 events — show timeline
- 2026-05-15 Pending — MLSOK
- 2026-05-13 Listed $199,900 MLSOK
- 2005-10-26 Sold (Public Records) $119,500 Public Records
- 2005-10-25 Sold (MLS) $119,500 MLSOK
- 2005-08-29 Listing Removed — MLSOK
- 2005-08-20 Listed $119,500 MLSOK
- 2000-11-09 Sold (Public Records) $98,000 Public Records
Property tax history
+2.2%/yrLatest (2024): $1,611 · +2.9% YoY. Source: county tax records.
Cash-flow waterfall
monthlySold comps — $/sqft
last 12 mo · ≤1 miLoading sold comps…