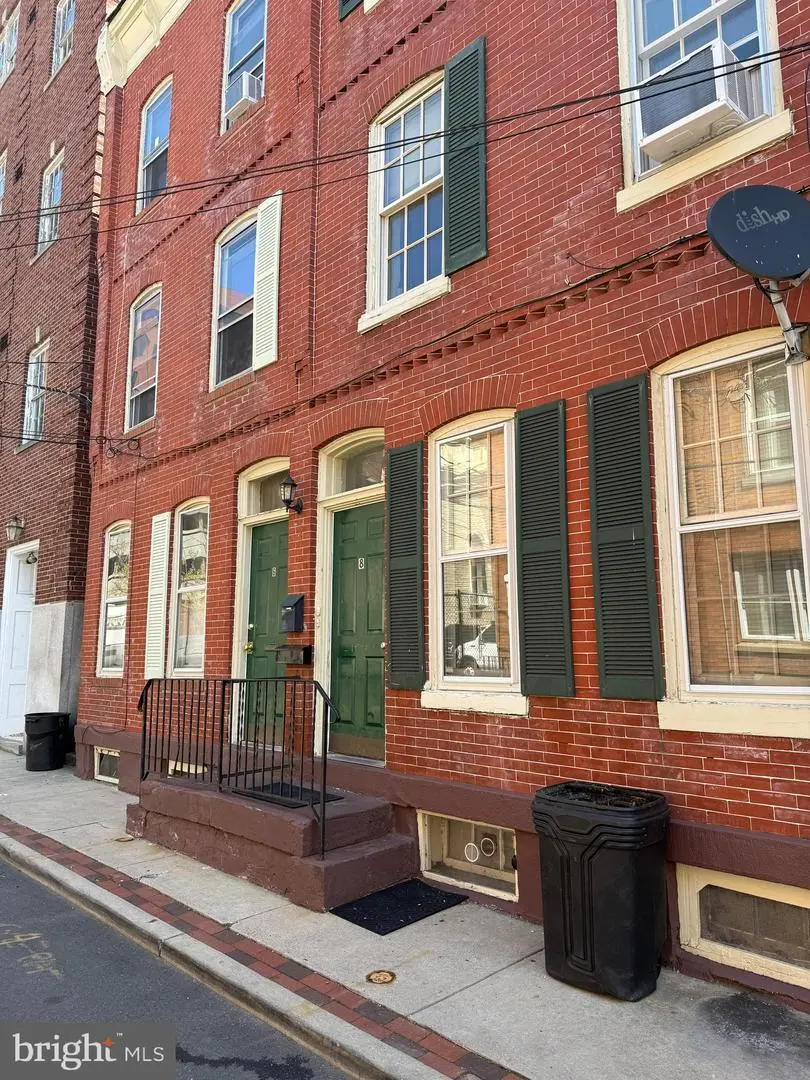
8 Peace St · Trenton, NJ
Flood risk 5/10 · Moderate
- FEMA flood zone
- X (unshaded)
- Chance of flooding over 30 yrs
- 0.24%
- Est. flood insurance / yr
- $507 – $1,088
Fire risk 1/10 · Minimal
- Est. fire insurance / yr
- $526 – $976
Heat risk 7/10 · Major
- Hot days now (above 103°F)
- 7 days/yr
- Hot days in 30 yrs
- 15 days/yr
Wind risk 6/10 · Moderate
- Chance of severe wind over 30 yrs
- 27.0%
Air-quality risk 5/10 · Moderate
- Unhealthy air days now
- 6 days/yr
- Unhealthy air days in 30 yrs
- 8 days/yr
Risk factors via First Street. Map © Google.
Why this score? — see what drove the D+ grade
The composite is a weighted blend of 9 inputs, each scored 0–100. Each bar is that input's sub-score; the figure is the points it added to the 100-point composite (weight × sub-score).
- Cash flow +18.2/30.0
- ARV discount +6.4/15.0
- DSCR +5.7/10.0
- Appreciation +5.0/10.0
- 1% rule +4.8/10.0
- Livability +3.8/5.0
- Rent growth +2.5/5.0
- Condition / age +2.5/5.0
- Schools +0.7/10.0
$280,000
🖨 Deal sheet 📄 Offer letter ✓ Due diligence
Listing remarks MLS
Maximize your ROI from day one with this meticulously maintained, cash-flowing two-family property. Located in the desireable downtown area and steps away form the capital building. Boasting an optimal layout and highly favorable landlord terms, this building is a dream addition to any investment portfolio.Unit 1: A welcoming first-floor layout featuring gleaming hardwood floors, a beautifully appointed kitchen, a comfortable bedroom, and a full bathroom.Unit 2: A sprawling, multi-level living space designed for modern comfort. The main level showcases continued gleaming hardwood floors, a convenient half bath, and an open-concept kitchen that flows seamlessly into a sunlit living area. The private top floor hosts two nice sized bedrooms and a full, spacious bathroom. What truly sets this property apart is its low overhead. Both units are occupied by outstanding, highly reliable tenants with a flawless payment history. Furthermore, tenants pay their own utilities, drastically minimizing your operating expenses and guaranteeing a strong, predictable return on investment right out of the gate.
Key facts
- Hardwood floor
- Open concept kitchen
- Two family property
Tags
Property features AI
Exterior
- Utilities: Public water; Public septic; Natural gas available
- Home design: End of row townhouse; Fee simple ownership
- Construction: Brick construction; Concrete perimeter foundation; Above-grade and below-grade structures
- Exterior features: Lot dimensions approximately 16.3 x 60.0; No tidal water
Interior
- Bedrooms: One 1-bedroom unit; One 2-bedroom unit
- Heating & cooling: Baseboard electric heat; Natural gas heating and hot water
- Interior features: Full poured concrete basement; Multiple access exits (2+)
Neighborhood map
What this means for you Summary
Snapshot
- This is a 6-bed/?-bath single-family listed at $280k.
Deal economics
- At list price, monthly cash flow is $251 ($3k/yr) — positive.
- The deal already cash-flows at list — no discount required.
- To meet the 1% rule (rent ≥ 1% of price), the offer needs to be $275k (1.6% below list).
- Recommended offer: $272k (3.0% below list) — sets the bar for market timing.
Location & tenants
- Location reads 76/100 on livability (#133 in NJ, #3,533 nationally) — a middle-class / working-renter tenant base. Strengths: amenities A+, commute A+, health & safety A+; Watch: schools F, crime F, employment F.
- Trenton Public School District (urban): math 2% / reading 16% proficiency, ranked #471 of 472 in NJ (top 100%) — low school quality limits family demand, transient renter base, plan for 1-2y turnover; 80% free/reduced lunch — lower-income household profile, screen leases tightly.
- Market conditions: 4 active listings in the ZIP; 3 comparable units currently listed for rent nearby; rentals leasing fast (median 13d on market — plan ~1-2 weeks tenant-placement turnaround); 2,256 units permitted in Mercer County in 2024 (1,303 in 5+ unit buildings).
- At $2,754/mo this rent would consume 54% of the median local household income ($61k/yr) (locally 107% of renters already pay >50% of income on rent) — very limited rent-growth headroom before tenants either downsize or default.
Forward outlook
- In year one you build about $10k of equity ($2k loan paydown + $8k appreciation (3.0% local appreciation)).
- Mercer County population projected at +4% by 2050 — modest demand growth; plan on rents tracking national, not racing it.
- At projected returns (3.0% appreciation + 3.0% rent growth), your $78k cash investment doubles in ~6 years — after that, you're playing with house money.
- By year 4, paydown + projected appreciation supports a ~$35k cash-out refi (75% LTV) — recoverable capital for the next deal without selling this one.
Negotiation context
- It's been on market 46 days — a 3% lower offer ($272k) is reasonable based on typical stale-listing flexibility.
- 12 sale attempts since 25y ago; this cycle's ask has dropped $50k (15%) from the opening price — seller is motivated, your offer sets the floor, not the list.
- Current owner paid $99k; list at $280k implies a 183% gain — meaningful room to come down on a strong offer.
Risks & watch-outs
- Watch-outs: built in 1887 — expect roof / HVAC / electrical / plumbing capex.
- Climate carrying-cost: moderate flood risk; major wind risk, 27% chance of damaging wind over 30y; extreme-heat days projected 7→15/yr by 2055 (HVAC capex compounding) — expect insurance premiums to compound above CPI over the hold.
Questions for the listing agent
- It's been on market 46 days. Have you received any prior offers? Is the seller open to a 3% concession, seller financing, or rate buy-down credit?
- Built in 1887 — when were the roof, HVAC, electrical panel, plumbing, and water heater last replaced?
- Is there a deadline driving the sale (1031 exchange, divorce, estate, relocation)? That informs how much negotiation room exists.
- Schools are F-rated, which usually means shorter tenancies and higher turnover. Who's the typical renter profile here, and what's been the actual vacancy rate?
- Crime grade is F in this area — have there been break-ins, vandalism, or insurance claims at this property in the last 3 years? What carrier currently insures it and at what premium?
- The area grade is low — what's the realistic commute time and amenity access for the typical tenant pool here? Any planned neighborhood developments (good or bad) we should know about?
- What's the average days-on-market for RENTAL listings here right now (not sales)? A rising rental-DOM trend means longer vacancies and softer asking-rent achievability than the comps imply.
- What's the recent tenant-quality profile in this submarket — average credit score on applications, eviction rate, late-payment / NSF rate, and stable-employment percentage? A property-management company in the area should have these aggregated.
- How much new for-sale + rental construction is in the pipeline within 1–3 miles? Heavy new supply typically softens prices + rents 12–24 months out; constrained supply supports both.
Investment metrics
- 1% rule
- 0.98% ✗
- Cap rate
- 7.37%
- Cash-on-cash
- 3.85%
- DSCR
- 1.17
- GRM
- 8.5
CMA / ARV
- ARV (on-the-fly)
- $273,504
- Comps found
- 2
Show comp detail 2 sales within ~0.75 mi
| Address | Dist | Beds/Ba | Sqft | Sold | Price | $/sf | Match |
|---|---|---|---|---|---|---|---|
| 216 Brunswick Ave | 0.66mi | 5/3.0 (-1) | 1,704 (-4%) | 6mo | $130,000 | $76 | 52 |
| 423 N Delmorr Ave | 0.57mi | 5/3.0 (-1) | 1,910 (+8%) | 22mo | $294,000 | $154 | 38 |
Match score weights: distance 35% · size 25% · config 20% · recency 20%. Top-matched comps best support the ARV.
Projected returns pro-forma
3.0% appreciation · 3.0% rent growth · sell at horizon
- IRR
- 11.1%
- Equity multiple
- 1.63×
- Total profit
- $49,773
- Equity at exit
- $125,900
- IRR
- 13.3%
- Equity multiple
- 2.98×
- Total profit
- $154,846
- Equity at exit
- $194,027
Cash invested: $78,400 (down + closing). Projections, not guarantees.
Landlord ↔ Tenant lean methodology
- Overall (STATE)
- 21 Tenant-Leaning
- State New Jersey
- 21 Tenant-Leaning · D+6
- County
- — inherits STATE
- City
- — inherits STATE
ZIP-level market 08608
- Active inventory
- 4
- Price-to-rent
- 8.5×
Monthly cashflow live
- Estimated rent
- $2,754 medium interval (Pro) →
- Mortgage (P&I)
- −$1,468
- Tax from tax record
- −$340 /mo · $4,076/yr
- Insurance
- −$117
- HOA
- −$0
- Vacancy / Maint / Mgmt
- −$578
- Net cashflow
- $251
Break-even live
UW: 25.0% down · 7.5% · 30yr · 1.5% tax · 5.0% vac · 8.0% maint · 8.0% mgmt
Financing live
Cash to close
- Down payment
- $70,000
- Closing costs
- $8,400
- Reserves months
- —
- Total cash needed
- —
Loan-product check · same deal, 3 products live
Conventional
25% down · 7.5% · 30yr
- Down + closing
- —
- Monthly P&I
- —
- Monthly cashflow
- —
- DSCR
- —
- Eligible?
- —
Personal DTI + credit; lowest rate.
DSCR
20% down · 8.5% · 30yr
- Down + closing
- —
- Monthly P&I
- —
- Monthly cashflow
- —
- DSCR
- —
- Eligible?
- —
No personal income docs; deal must DSCR.
Hard money
10% down · 12.0% · 12mo
- Down + closing
- —
- Monthly P&I
- —
- Monthly cashflow
- —
- DSCR
- —
- Eligible?
- —
Short-term bridge; refi at stabilization.
Rent comps 3 comps
| Address | Beds | Baths | Sqft | Rent | $/sqft | DOM | Units | Dist |
|---|---|---|---|---|---|---|---|---|
| 223 Spring St Trenton, NJ | 6.0 | 2.0 | 1490 | $2,700 | $1.81 | 4d | 1 | 0.54mi |
| 649 W State St Trenton, NJ | 5.0 | 2.0 | 1870 | $2,900 | $1.55 | 12d | 1 | 1.14mi |
| 510 N Hermitage Ave Trenton, NJ | 5.0 | 1.5 | 1316 | $2,500 | $1.90 | 12d | 1 | 1.21mi |
Listing history 31 events
-
2026-05-30status $280,000 Pending 46 DOM
-
2026-05-20price $280,000
-
2026-05-08price $280,000 1108-char remark
Show marketing remark (1108 chars)
Maximize your ROI from day one with this meticulously maintained, cash-flowing two-family property. Located in the desireable downtown area and steps away form the capital building. Boasting an optimal layout and highly favorable landlord terms, this building is a dream addition to any investment portfolio.Unit 1: A welcoming first-floor layout featuring gleaming hardwood floors, a beautifully appointed kitchen, a comfortable bedroom, and a full bathroom.Unit 2: A sprawling, multi-level living space designed for modern comfort. The main level showcases continued gleaming hardwood floors, a convenient half bath, and an open-concept kitchen that flows seamlessly into a sunlit living area. The private top floor hosts two nice sized bedrooms and a full, spacious bathroom. What truly sets this property apart is its low overhead. Both units are occupied by outstanding, highly reliable tenants with a flawless payment history. Furthermore, tenants pay their own utilities, drastically minimizing your operating expenses and guaranteeing a strong, predictable return on investment right out of the gate.
-
2026-04-23price $300,000 1108-char remark
Show marketing remark (1108 chars)
Maximize your ROI from day one with this meticulously maintained, cash-flowing two-family property. Located in the desireable downtown area and steps away form the capital building. Boasting an optimal layout and highly favorable landlord terms, this building is a dream addition to any investment portfolio.Unit 1: A welcoming first-floor layout featuring gleaming hardwood floors, a beautifully appointed kitchen, a comfortable bedroom, and a full bathroom.Unit 2: A sprawling, multi-level living space designed for modern comfort. The main level showcases continued gleaming hardwood floors, a convenient half bath, and an open-concept kitchen that flows seamlessly into a sunlit living area. The private top floor hosts two nice sized bedrooms and a full, spacious bathroom. What truly sets this property apart is its low overhead. Both units are occupied by outstanding, highly reliable tenants with a flawless payment history. Furthermore, tenants pay their own utilities, drastically minimizing your operating expenses and guaranteeing a strong, predictable return on investment right out of the gate.
-
2026-04-13$330,000 Active
-
2026-04-10$330,000 Active 1108-char remark
Show marketing remark (1108 chars)
Maximize your ROI from day one with this meticulously maintained, cash-flowing two-family property. Located in the desireable downtown area and steps away form the capital building. Boasting an optimal layout and highly favorable landlord terms, this building is a dream addition to any investment portfolio.Unit 1: A welcoming first-floor layout featuring gleaming hardwood floors, a beautifully appointed kitchen, a comfortable bedroom, and a full bathroom.Unit 2: A sprawling, multi-level living space designed for modern comfort. The main level showcases continued gleaming hardwood floors, a convenient half bath, and an open-concept kitchen that flows seamlessly into a sunlit living area. The private top floor hosts two nice sized bedrooms and a full, spacious bathroom. What truly sets this property apart is its low overhead. Both units are occupied by outstanding, highly reliable tenants with a flawless payment history. Furthermore, tenants pay their own utilities, drastically minimizing your operating expenses and guaranteeing a strong, predictable return on investment right out of the gate.
-
2020-02-14status Pending
-
2020-02-14historical
-
2020-02-07$125,000 Active
-
2018-02-05soldstatus $99,000
-
2018-01-31soldstatus $99,000
-
2018-01-31soldstatus $99,000 Sold
-
2017-08-24historical Contingent - Other
-
2017-07-28status Active
-
2017-07-24historical Contingent - Other
-
2017-06-21$105,000 Active
-
2017-06-20$105,000
-
2014-12-31historical
-
2014-02-01$110,000
-
2013-08-22historical
-
2013-01-22$120,000
-
2012-08-29historical
-
2012-02-29$120,000
-
2011-11-20historical
-
2011-04-23$139,000
-
2010-07-31historical
-
2010-01-31$150,000
-
2002-09-16soldstatus $50,000
-
2002-09-05soldstatus $50,000
-
2002-05-02historical
-
2001-11-01$50,000
ⓘ Source: listings_history table (triggers on properties + properties_extension) + one-shot
backfill from property_details.listing_events for pre-trigger history.
Tax reassessment forecast NJ · Partial reset (capped growth)
- Current annual tax
- $4,076 · $340/mo
- Projected year-2 tax
- $5,524 · $460/mo
- Expected delta
- +$1,448/yr (+$121/mo · 35.5%)
ⓘ Screening estimate from a state-policy table — verify with the county assessor before closing.
Climate risk First Street
- Flood 5/10 Major FEMA zone X (unshaded) · 24% chance over 30 yrs
- Wildfire 1/10 Low
- Heat 7/10 Severe 7 d/yr ≥103°F today · 15 d/yr by 30 yrs out
- Wind 6/10 Major 27% chance of damaging wind over 30 yrs
- Air quality 5/10 Major 6 unhealthy d/yr today · 8 by 30 yrs out
Nearby sold comps map
Loading sold comps map…
Walkable amenities ~0.75 mi
Loading nearby amenities…
Taxation est. · year 1
- Rental income
- $33,053
- − Mortgage interest
- −$15,684
- − Property taxes
- −$4,076
- − Insurance
- −$1,400
- − Repairs & maintenance
- −$2,644
- − Management
- −$2,644
- − Depreciation
- −$8,145
- Taxable loss
- −$1,541
- Est. tax savings @ 24.0%
- +$370
- After-tax cash flow
- $3,386/yr
For passive investors: Depreciation is non-cash, so a rental often shows a tax loss while cash-flowing — sheltering income. Rental losses are passive: they offset passive income freely, and up to $25,000/yr can offset ordinary (W-2) income if you actively participate and your MAGI is under $100k (phasing out to $0 by $150k); unused losses carry forward. On sale, claimed depreciation is recaptured at up to 25%, and gains may owe capital-gains tax (a 1031 exchange can defer both). Figures are a year-1 estimate at your 24.0% rate — not tax advice; consult a CPA.
Schools (NCES district)
- District
- Trenton Public School District
- NCES district ID
- 3416290
- Math proficiency
- 2% ▼ -8.00%
- Reading proficiency
- 16% ▼ -4.00%
- Median HH income
- $35,078
- Composite
- 7.31/100
- National rank
- #9956
- State rank
- #471 of 472 in NJ
Livability — Trenton
- Score
- 76/100
- State rank
- #133
- US rank
- #3533
Category grades
Schools grade is shown separately in the Schools card above.
Census & demographics
- Census place
- Trenton, NJ
- County
- Mercer County · 327,655 people
- City population
- 177,819
- Metro
- Trenton-Princeton, NJ
- Population (ZIP)
- 1,250
- Household income
- $61,201
- Rent vs Own
- Severe rent burden
- 107.0
Population outlook (Mercer County) Hauer SSP2
- Today (2025)
- 381,395 people
- By 2030
- 384,640 · +0.9%
- By 2040
- 391,431 · +2.6%
- By 2050
- 397,845 · +4.3%
- By 2075
- 417,281 · +9.4%
- By 2100
- 420,327 · +10.2%
Race, ethnicity, and origin ACS 2023
- Neighborhood character
- Diverse neighborhood (Simpson 0.57)
- Race & ethnicity
- Black 57% Hispanic / Latino 31% Two or more races 7% White 5% Native American 2%
- Hispanic origin (detail)
- Puerto Rican 3% Dominican 8%
- Common ancestry
- Hispanic 12%
- Foreign-born
- 27% · Canada, Jamaica
- Languages at home
- 70% English-only · Spanish 24% Arabic 6%
Political lean MEDSL · Mercer
- 2024 margin
- Solid D (+33.9) · D 65.9% · R 32.0% · Other 2.1%
- 2008→2024 swing
- -2.2pp toward R · 2008: 36.1pp · 2024: 33.9pp
- All cycles
- 2024: D+33.9 2020: D+40.0 2016: D+36.2 2012: D+36.8 2008: D+36.1
Not yet ingested
- Civics
- —
Market trends
- HPI YoY
- —
- Current HPI
- —
- Rent YoY
- —
- Metro
- Trenton-Princeton, NJ
- State GDP YoY
- ▲ 2.05%
- F500 in state
- 34
Industry mix (Fortune 500 HQ in NJ)
| Industry | F500 HQs | Revenue |
|---|---|---|
| Consumer Goods | 3 | $31B |
|
||
| Pharmaceuticals | 2 | $153B |
|
||
| Technology | 2 | $21B |
|
||
| Insurance | 2 | $20B |
|
||
| Healthcare | 2 | $19B |
|
||
| Financial Services | 1 | $70B |
|
||
Price history
+460.0% since first listed30 events — show timeline
- 2026-05-20 Price Changed $280,000 BRIGHT MLS
- 2026-05-08 Price Changed $280,000 GSMLS
- 2026-04-23 Price Changed $300,000 GSMLS
- 2026-04-13 Listed $330,000 BRIGHT MLS
- 2026-04-10 Listed $330,000 GSMLS
- 2020-02-14 Pending — BRIGHT MLS
- 2020-02-14 Listing Removed — BRIGHT MLS
- 2020-02-07 Listed $125,000 BRIGHT MLS
- 2018-02-05 Sold (Public Records) $99,000 Public Records
- 2018-01-31 Sold (MLS) $99,000 TREND
- 2018-01-31 Sold (MLS) $99,000 BRIGHT MLS
- 2017-08-24 Contingent — TREND
- 2017-07-28 Relisted — TREND
- 2017-07-24 Contingent — TREND
- 2017-06-21 Listed $105,000 TREND
- 2017-06-20 Listed $105,000 BRIGHT MLS
- 2014-12-31 Listing Removed — BRIGHT MLS
- 2014-02-01 Listed $110,000 BRIGHT MLS
- 2013-08-22 Listing Removed — BRIGHT MLS
- 2013-01-22 Listed $120,000 BRIGHT MLS
- 2012-08-29 Listing Removed — BRIGHT MLS
- 2012-02-29 Listed $120,000 BRIGHT MLS
- 2011-11-20 Listing Removed — BRIGHT MLS
- 2011-04-23 Listed $139,000 BRIGHT MLS
- 2010-07-31 Listing Removed — BRIGHT MLS
- 2010-01-31 Listed $150,000 BRIGHT MLS
- 2002-09-16 Sold (Public Records) $50,000 Public Records
- 2002-09-05 Sold (MLS) $50,000 BRIGHT MLS
- 2002-05-02 Listing Removed — BRIGHT MLS
- 2001-11-01 Listed $50,000 BRIGHT MLS
Property tax history
+0.4%/yrLatest (2025): $4,076 · +1.5% YoY. Source: county tax records.
Cash-flow waterfall
monthlySold comps — $/sqft
last 12 mo · ≤1 miLoading sold comps…