 Triplex
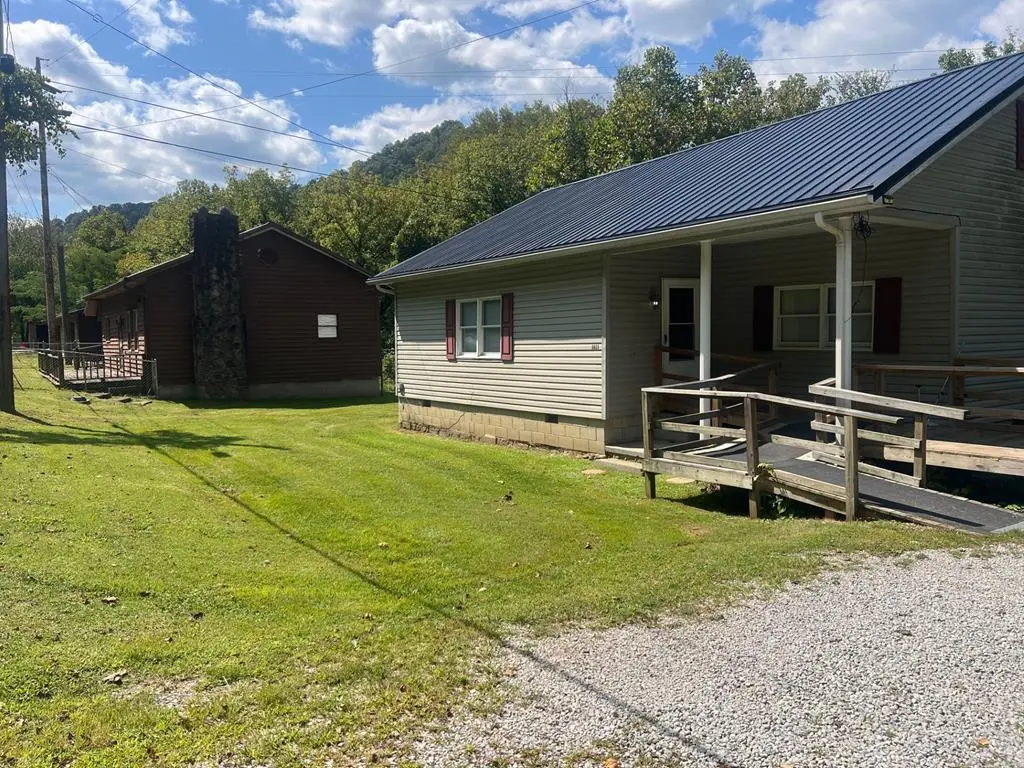
3023 Ky Hwy 7 · Wayland, KY
Flood risk 8/10 · Major
- FEMA flood zone
- AE
- Chance of flooding over 30 yrs
- 0.78%
- Est. flood insurance / yr
- $1,737 – $8,500
Fire risk 4/10 · Minor
- Est. fire insurance / yr
- $839 – $1,559
Heat risk 4/10 · Minor
- Hot days now (above 100°F)
- 7 days/yr
- Hot days in 30 yrs
- 20 days/yr
Wind risk 2/10 · Minimal
- Chance of severe wind over 30 yrs
- 1.0%
Air-quality risk 1/10 · Minimal
- Unhealthy air days now
- 0 days/yr
- Unhealthy air days in 30 yrs
- 0 days/yr
Risk factors via First Street. Map © Google.
Why this score? — see what drove the B- grade
The composite is a weighted blend of 9 inputs, each scored 0–100. Each bar is that input's sub-score; the figure is the points it added to the 100-point composite (weight × sub-score).
- Cash flow +30.0/30.0
- 1% rule +10.0/10.0
- DSCR +10.0/10.0
- ARV discount +7.5/15.0
- Condition / age +2.8/5.0
- Livability +2.7/5.0
- Rent growth +2.5/5.0
- Schools +1.8/10.0
- Appreciation +0.9/10.0
$159,900
🖨 Deal sheet 📄 Offer letter ✓ Due diligence
Multi-family units
County records classify this as Multi-Family (2-4 Unit). Listing-text estimate: 3 units. confirmed
Listing remarks
Endless possibilities! This unique 3- unit property offers both commercial and residential potential- perfect for an investor, business owner, or multi-family setup. Featuring flexible living space, multiple income producing options, and a 4- car garage, this property has something for everyone!
Key facts
- 3 unit property
- Commercial potential
- 1 acre lot
Tags
Property features AI
Exterior
- Parking: Attached garage with 3 spaces
- Utilities: Public water; Septic tank sewer
- Home design: Residential income property; Multi-family; Mixed zoning
- Construction: Vinyl siding; Wood siding; Metal roof
- Exterior features: Garden; Porch; Fenced yard; Additional storage
Interior
- Kitchen: Refrigerator; Cooktop
- Heating & cooling: Central air conditioning; Natural gas heating
- Interior features: Accessible entrance; Garden; Porch; Fenced yard; Storage structure
Neighborhood map
What this means for you Summary
Snapshot
- This is a 3 × 3-bed/1.2-bath units multifamily listed at $160k. Condition is rated average.
Deal economics
- At list price, monthly cash flow is $845 ($10k/yr) — positive. Per door: $282/mo.
- The deal already cash-flows at list — no discount required.
- Meets the 1% rule at list price ($3k rent vs $160k).
Location & tenants
- Location reads 54/100 on livability (#475 in KY) — a working-class tenant base; expect higher turnover. Strengths: crime A+, cost of living A+; Watch: housing D, amenities F, commute F.
- Floyd County (rural): math 13% / reading 32% proficiency, ranked #157 of 165 in KY (top 95%) — low school quality limits family demand, transient renter base, plan for 1-2y turnover; 63% free/reduced lunch — lower-income household profile, screen leases tightly.
- Zoned schools: Floyd Central High School (math 17% / reading 37%, grade F, #158 of 254 statewide, top 68%, 552 students, 72% FRL).
- Market conditions: 7 active listings in the ZIP; 5 units permitted in Floyd County in 2024 (0 in 5+ unit buildings).
Forward outlook
- Local home prices are declining (-3.0%/yr); year-one equity from $1k of loan paydown is wiped out by about $5k of value loss. Plan a longer hold.
- Floyd County population projected at -36% by 2050 — secular population decline; favor cash flow + early exit over multi-decade hold.
- At projected returns (-3.0% appreciation + 3.0% rent growth), your $45k cash investment doubles in ~6 years — after that, you're playing with house money.
Negotiation context
- Only 10 days on market — expect competitive offers; lowballing is unlikely to land.
- 2 sale attempts with the ask held roughly flat each time — persistent listings suggest the price (not the market) is what's stuck; bring a comps-based counter.
Risks & watch-outs
- Watch-outs: flood insurance adds $427/mo.
- Climate carrying-cost: in FEMA flood zone AE (mandatory federal flood insurance) — expect insurance premiums to compound above CPI over the hold.
Questions for the listing agent
- Can we see the unit-by-unit rent roll, current vacancy, and any below-market leases? What's the average tenancy length?
- What capital expenditures (roof, boiler, parking lot, exteriors) have been made in the last 5 years, and what's planned in the next 2?
- What's the actual annual flood-insurance premium (NFIP or private), and is the property in a SFHA with mandatory coverage?
- Is there a deadline driving the sale (1031 exchange, divorce, estate, relocation)? That informs how much negotiation room exists.
- Schools are F-rated, which usually means shorter tenancies and higher turnover. Who's the typical renter profile here, and what's been the actual vacancy rate?
- What's the average days-on-market for RENTAL listings here right now (not sales)? A rising rental-DOM trend means longer vacancies and softer asking-rent achievability than the comps imply.
- What's the recent tenant-quality profile in this submarket — average credit score on applications, eviction rate, late-payment / NSF rate, and stable-employment percentage? A property-management company in the area should have these aggregated.
- How much new apartment / multifamily construction is in the pipeline within 1–3 miles? Heavy new supply (>2% of stock underway) typically softens rents 12–24 months out; light construction supports rent growth.
Investment metrics
- 1% rule
- 1.88% ✓
- Cap rate
- 15.83%
- Cash-on-cash
- 34.07%
- DSCR
- 2.52
- GRM
- 4.4
CMA / ARV
No comps found within radius.
Projected returns pro-forma
-3.0% appreciation · 3.0% rent growth · sell at horizon
- IRR
- 15.7%
- Equity multiple
- 1.63×
- Total profit
- $28,199
- Equity at exit
- $23,842
- IRR
- 24.4%
- Equity multiple
- 3.12×
- Total profit
- $95,084
- Equity at exit
- $13,825
Cash invested: $44,772 (down + closing). Projections, not guarantees.
Landlord ↔ Tenant lean methodology
- Overall (STATE)
- 83 Strongly Landlord-Friendly
- State Kentucky
- 83 Strongly Landlord-Friendly · R+16
- County
- — inherits STATE
- City
- — inherits STATE
ZIP-level market 41666
- Home prices YoY
- -7.9%
- Active inventory
- 7
- Price-to-rent
- 13.3×
Monthly cashflow live
- Estimated rent
- $3,008 medium interval (Pro) →
- Mortgage (P&I)
- −$839
- Tax est. 1.5%
- −$200 /mo · $2,398/yr
- Insurance
- −$67
- Flood insurance flood zone
- −$427 /mo · $5,118/yr
- HOA
- −$0
- Vacancy / Maint / Mgmt
- −$632
- Net cashflow
- $845
Break-even live
3-unit breakdown (identical units grouped — click to expand)
| Units | Beds | Baths | Est. rent |
|---|---|---|---|
| 3× units | 3 | 1.2 | $3,009 |
| #1 | 3 | 1.2 | $1,003 |
| #2 | 3 | 1.2 | $1,003 |
| #3 | 3 | 1.2 | $1,003 |
| Total (3 units) | $3,008 | ||
UW: 25.0% down · 7.5% · 30yr · 1.5% tax · 5.0% vac · 8.0% maint · 8.0% mgmt
Financing live
Cash to close
- Down payment
- $39,975
- Closing costs
- $4,797
- Reserves months
- —
- Total cash needed
- —
Loan-product check · same deal, 3 products live
Conventional
25% down · 7.5% · 30yr
- Down + closing
- —
- Monthly P&I
- —
- Monthly cashflow
- —
- DSCR
- —
- Eligible?
- —
Personal DTI + credit; lowest rate.
DSCR
20% down · 8.5% · 30yr
- Down + closing
- —
- Monthly P&I
- —
- Monthly cashflow
- —
- DSCR
- —
- Eligible?
- —
No personal income docs; deal must DSCR.
Hard money
10% down · 12.0% · 12mo
- Down + closing
- —
- Monthly P&I
- —
- Monthly cashflow
- —
- DSCR
- —
- Eligible?
- —
Short-term bridge; refi at stabilization.
Listing history 8 events
-
2026-06-18days on market $159,900 Active 10 DOM
-
2026-06-17days on market $159,900 Active 9 DOM
-
2026-06-16days on market $159,900 Active 8 DOM
-
2026-06-15days on market $159,900 Active 7 DOM
-
2026-06-13days on market $159,900 Active 5 DOM
-
2026-06-12days on market $159,900 Active 4 DOM
-
2026-06-09remarks 296-char remark
-
2026-06-09$159,900 Active 1 DOM
ⓘ Source: listings_history table (triggers on properties + properties_extension) + one-shot
backfill from property_details.listing_events for pre-trigger history.
Climate risk First Street
- Flood 8/10 Severe FEMA zone AE · 78% chance over 30 yrs
- Wildfire 4/10 Moderate
- Heat 4/10 Moderate 7 d/yr ≥100°F today · 20 d/yr by 30 yrs out
- Wind 2/10 Low 100% chance of damaging wind over 30 yrs
- Air quality 1/10 Low 0 unhealthy d/yr today · 0 by 30 yrs out
Nearby sold comps map
Loading sold comps map…
Walkable amenities ~0.75 mi
Loading nearby amenities…
Taxation est. · year 1
- Rental income
- $36,096
- − Mortgage interest
- −$8,957
- − Property taxes
- −$2,398
- − Insurance
- −$5,918
- − Repairs & maintenance
- −$2,888
- − Management
- −$2,888
- − Depreciation
- −$4,652
- Taxable income
- $8,396
- Est. tax owed @ 24.0%
- −$2,015
- After-tax cash flow
- $8,122/yr
For passive investors: Depreciation is non-cash, so a rental often shows a tax loss while cash-flowing — sheltering income. Rental losses are passive: they offset passive income freely, and up to $25,000/yr can offset ordinary (W-2) income if you actively participate and your MAGI is under $100k (phasing out to $0 by $150k); unused losses carry forward. On sale, claimed depreciation is recaptured at up to 25%, and gains may owe capital-gains tax (a 1031 exchange can defer both). Figures are a year-1 estimate at your 24.0% rate — not tax advice; consult a CPA.
Condition & rehab AI · 12 photos
This 3-unit property offers moderate rehab potential with dated interiors and basic landscaping. Updates to kitchens and bathrooms, along with painting and landscaping, can significantly enhance its resale and rental value.
Repairs flagged
- Moderate Kitchen cabinets — Dated appearance
- Moderate Bathroom fixtures — Need updating for modern look
- Minor Exterior siding — Some wear
Value-add opportunities
- Both Updating kitchen cabinets and countertops — Modernizes kitchen and increases appeal
- Both Updating bathroom fixtures and tubs — Modernizes bathrooms and increases appeal
- Both Painting interior walls — Freshens up interior and improves curb appeal
- Both Landscaping improvements — Enhances curb appeal and property value
Renovation cost estimate screening
| Repair item | Severity | Est. cost |
|---|---|---|
| Kitchen cabinets · Dated appearance | Moderate | $3,000–15,000 |
| Bathroom fixtures · Need updating for modern look | Moderate | $3,000–15,000 |
| Exterior siding · Some wear | Minor | $500–3,000 |
| Total estimated repair cost · 3 items | $6,500–33,000 |
Value-add ROI direction
- Both Updating kitchen cabinets and countertops — Modernizes kitchen and increases appeal ↑
- Both Updating bathroom fixtures and tubs — Modernizes bathrooms and increases appeal ↑
- Both Painting interior walls — Freshens up interior and improves curb appeal ↑
- Both Landscaping improvements — Enhances curb appeal and property value ↑
ⓘ Cost ranges are severity-bucket heuristics (US national rule-of-thumb). Get contractor quotes + a written scope before underwriting a rehab budget.
Schools (NCES district)
- District
- Floyd County
- NCES district ID
- 2101950
- Math proficiency
- 13% ▼ -24.00%
- Reading proficiency
- 32% ▼ -25.00%
- Median HH income
- $29,638
- Composite
- 17.97/100
- National rank
- #8988
- State rank
- #157 of 165 in KY
Livability — Wayland
- Score
- 54/100
- State rank
- #475
- US rank
- #23803
Category grades
Schools grade is shown separately in the Schools card above.
Census & demographics
- Census place
- Wayland, KY
- Population (ZIP)
- 917
Population outlook (Floyd County) Hauer SSP2
- Today (2025)
- 33,016 people
- By 2030
- 30,683 · -7.1%
- By 2040
- 25,378 · -23.1%
- By 2050
- 21,013 · -36.4%
- By 2075
- 14,361 · -56.5%
- By 2100
- 10,464 · -68.3%
Race, ethnicity, and origin ACS 2023
- Neighborhood character
- Predominantly White (97%)
- Race & ethnicity
- White 97% Hispanic / Latino 2% Two or more races 2%
- Common ancestry
- Serbian 3%
Political lean MEDSL · Floyd
- 2024 margin
- Solid R (+59.2) · D 19.6% · R 78.8% · Other 1.7%
- 2008→2024 swing
- -57.9pp toward R · 2008: -1.3pp · 2024: -59.2pp
- All cycles
- 2024: R+59.2 2020: R+51.2 2016: R+48.3 2012: R+33.9 2008: R+1.3
Not yet ingested
- Civics
- —
Market trends
- HPI YoY
- ▼ -8.22%
- Current HPI
- 95.4968
- Rent YoY
- —
- Metro
- —
- State GDP YoY
- ▲ 1.81%
- F500 in state
- 4
Industry mix (Fortune 500 HQ in KY)
| Industry | F500 HQs | Revenue |
|---|---|---|
| Healthcare | 1 | $118B |
|
||
| Food / Beverage | 1 | $7B |
|
||
Price history
-23.9% since first listed4 events — show timeline
- 2026-06-08 Listed $159,900 EKAR
- 2026-01-27 Price Changed $185,000 EKAR
- 2025-11-22 Price Changed $195,000 EKAR
- 2025-09-16 Listed $210,000 EKAR
Cash-flow waterfall
monthlySold comps — $/sqft
last 12 mo · ≤1 miLoading sold comps…