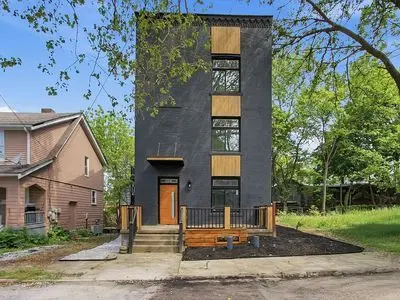
 Triplex
931 Ramsey St · Wilkinsburg, PA
Flood risk 7/10 · Major
- FEMA flood zone
- X (unshaded)
- Chance of flooding over 30 yrs
- 0.75%
- Est. flood insurance / yr
- $473 – $860
Fire risk 1/10 · Minimal
- Est. fire insurance / yr
- $511 – $949
Heat risk 4/10 · Minor
- Hot days now (above 98°F)
- 7 days/yr
- Hot days in 30 yrs
- 17 days/yr
Wind risk 2/10 · Minimal
- Chance of severe wind over 30 yrs
- 0.0%
Air-quality risk 4/10 · Minor
- Unhealthy air days now
- 4 days/yr
- Unhealthy air days in 30 yrs
- 5 days/yr
Risk factors via First Street. Map © Google.
Why this score? — see what drove the D- grade
The composite is a weighted blend of 9 inputs, each scored 0–100. Each bar is that input's sub-score; the figure is the points it added to the 100-point composite (weight × sub-score).
- Cash flow +13.1/30.0
- ARV discount +7.5/15.0
- DSCR +3.9/10.0
- Livability +3.8/5.0
- Rent growth +3.5/5.0
- 1% rule +2.5/10.0
- Condition / age +2.5/5.0
- Schools +1.5/10.0
- Appreciation +0.0/10.0
$700,000
🖨 Deal sheet 📄 Offer letter ✓ Due diligence
Multi-family units
County records classify this as Multi-Family (2-4 Unit). Listing-text estimate: 3 units. confirmed
Listing remarks MLS
GREAT BUY WON'T LAST LONG BRICK TRIPLEX 3 LEGAL UNITS ALWAYS RENTED SEC-8-APPROVED SEP UTLS 3-NEW-BK-PORCHES/ STEPS 2-NEW-W-HTRS F-BSMT-L-STORAGE
Key facts
- Newly constructed
- Modern appeal
- Premium finishes
Tags
Neighborhood map
What this means for you Summary
Snapshot
- This is a 3 × 4-bed/1.3-bath units multifamily listed at $700k.
Deal economics
- At list price, monthly cash flow is $-76 ($-916/yr) — negative. Per door: $-25/mo.
- To cash-flow at today's rent, offer at most $687k (1.9% below list).
- To meet the 1% rule (rent ≥ 1% of price), the offer needs to be $527k (24.7% below list).
- Recommended offer: $527k (24.7% below list) — sets the bar for 1% rule.
- Cap rate 6.3% vs local median 11.3% in Wilkinsburg — below-typical yield; the buyer is paying a premium for something (appreciation thesis, condition, location) that the cap rate doesn't capture.
Location & tenants
- Location reads 76/100 on livability (#411 in PA, #3,754 nationally) — a middle-class / working-renter tenant base. Strengths: commute A+, cost of living A+, housing A+; Watch: schools D+, health & safety D+, crime F.
- Wilkinsburg Borough SD (suburban): math 14% / reading 23% proficiency, ranked #503 of 539 in PA (top 93%) — low school quality limits family demand, transient renter base, plan for 1-2y turnover; 96% free/reduced lunch — lower-income household profile, screen leases tightly.
- Market conditions: Rents rising (+3.9%/yr); 118 active listings in the ZIP; 2,996 units permitted in Allegheny County in 2024 (1,588 in 5+ unit buildings).
- At $5,273/mo this rent would consume 115% of the median local household income ($55k/yr) (locally 1933% of renters already pay >50% of income on rent) — very limited rent-growth headroom before tenants either downsize or default.
Forward outlook
- Local home prices are declining (-3.0%/yr); year-one equity from $5k of loan paydown is wiped out by about $21k of value loss. Plan a longer hold.
Negotiation context
- It's been on market 20 days — a 2% lower offer ($690k) is reasonable based on typical stale-listing flexibility.
- 2 sale attempts since 27y ago with the ask held roughly flat each time — persistent listings suggest the price (not the market) is what's stuck; bring a comps-based counter.
- Current owner paid $45k; list at $700k implies a 1456% gain — meaningful room to come down on a strong offer.
Risks & watch-outs
- Watch-outs: flood insurance adds $56/mo.
- Climate carrying-cost: major flood risk — expect insurance premiums to compound above CPI over the hold.
Questions for the listing agent
- What do current leases actually rent for vs. the listed asking? Can we see a recent rent roll and the last 12 months of T-12 income?
- Can we see the unit-by-unit rent roll, current vacancy, and any below-market leases? What's the average tenancy length?
- What capital expenditures (roof, boiler, parking lot, exteriors) have been made in the last 5 years, and what's planned in the next 2?
- What's the actual annual flood-insurance premium (NFIP or private), and is the property in a SFHA with mandatory coverage?
- Is there a deadline driving the sale (1031 exchange, divorce, estate, relocation)? That informs how much negotiation room exists.
- Schools are D-rated, which usually means shorter tenancies and higher turnover. Who's the typical renter profile here, and what's been the actual vacancy rate?
- Crime grade is F in this area — have there been break-ins, vandalism, or insurance claims at this property in the last 3 years? What carrier currently insures it and at what premium?
- The area grade is low — what's the realistic commute time and amenity access for the typical tenant pool here? Any planned neighborhood developments (good or bad) we should know about?
- What's the average days-on-market for RENTAL listings here right now (not sales)? A rising rental-DOM trend means longer vacancies and softer asking-rent achievability than the comps imply.
- What's the recent tenant-quality profile in this submarket — average credit score on applications, eviction rate, late-payment / NSF rate, and stable-employment percentage? A property-management company in the area should have these aggregated.
- How much new apartment / multifamily construction is in the pipeline within 1–3 miles? Heavy new supply (>2% of stock underway) typically softens rents 12–24 months out; light construction supports rent growth.
Investment metrics
- 1% rule
- 0.75% ✗
- Cap rate
- 6.26%
- Cash-on-cash
- -0.13%
- DSCR
- 0.99
- GRM
- 11.1
CMA / ARV
No comps found within radius.
Projected returns pro-forma
-3.0% appreciation · 3.86% rent growth · sell at horizon
- IRR
- -16.3%
- Equity multiple
- 0.42×
- Total profit
- $-113,974
- Equity at exit
- $104,372
- IRR
- -6.8%
- Equity multiple
- 0.55×
- Total profit
- $-87,451
- Equity at exit
- $60,523
Cash invested: $196,000 (down + closing). Projections, not guarantees.
Landlord ↔ Tenant lean methodology
- Overall (STATE)
- 62 Landlord-Friendly
- State Pennsylvania
- 62 Landlord-Friendly · EVEN
- County
- — inherits STATE
- City
- — inherits STATE
ZIP-level market 15221
- Home prices YoY
- -32.3%
- Rents YoY
- 3.9%
- Active inventory
- 118
- Price-to-rent
- 33.2×
Monthly cashflow live
- Estimated rent
- $5,273 high interval (Pro) →
- Mortgage (P&I)
- −$3,671
- Tax from tax record
- −$224 /mo · $2,687/yr
- Insurance
- −$292
- Flood insurance flood zone
- −$56 /mo · $666/yr
- HOA
- −$0
- Vacancy / Maint / Mgmt
- −$1,107
- Net cashflow
- $-76
Break-even live
3-unit breakdown (identical units grouped — click to expand)
| Units | Beds | Baths | Est. rent |
|---|---|---|---|
| 3× units | 4 | 1.3 | $5,274 |
| #1 | 4 | 1.3 | $1,758 |
| #2 | 4 | 1.3 | $1,758 |
| #3 | 4 | 1.3 | $1,758 |
| Total (3 units) | $5,273 | ||
UW: 25.0% down · 7.5% · 30yr · 1.5% tax · 5.0% vac · 8.0% maint · 8.0% mgmt
Financing live
Cash to close
- Down payment
- $175,000
- Closing costs
- $21,000
- Reserves months
- —
- Total cash needed
- —
Loan-product check · same deal, 3 products live
Conventional
25% down · 7.5% · 30yr
- Down + closing
- —
- Monthly P&I
- —
- Monthly cashflow
- —
- DSCR
- —
- Eligible?
- —
Personal DTI + credit; lowest rate.
DSCR
20% down · 8.5% · 30yr
- Down + closing
- —
- Monthly P&I
- —
- Monthly cashflow
- —
- DSCR
- —
- Eligible?
- —
No personal income docs; deal must DSCR.
Hard money
10% down · 12.0% · 12mo
- Down + closing
- —
- Monthly P&I
- —
- Monthly cashflow
- —
- DSCR
- —
- Eligible?
- —
Short-term bridge; refi at stabilization.
Listing history 19 events
-
2026-06-18days on market $700,000 Active 20 DOM
-
2026-06-17days on market $700,000 Active 19 DOM
-
2026-06-16days on market $700,000 Active 18 DOM
-
2026-06-15days on market $700,000 Active 17 DOM
-
2026-06-13days on market $700,000 Active 15 DOM
-
2026-06-09days on market $700,000 Active 11 DOM
-
2026-06-08days on market $700,000 Active 10 DOM
-
2026-06-07days on market $700,000 Active 9 DOM
-
2026-06-05days on market $700,000 Active 6 DOM
-
2026-06-03days on market $700,000 Active 5 DOM
-
2026-06-02days on market $700,000 Active 4 DOM
-
2026-06-01days on market $700,000 Active 3 DOM
-
2026-05-31days on market $700,000 Active 2 DOM
-
2026-05-26$700,000 Active
-
1999-11-15soldstatus $45,000 145-char remark
Show marketing remark (145 chars)
GREAT BUY WON'T LAST LONG BRICK TRIPLEX 3 LEGAL UNITS ALWAYS RENTED SEC-8-APPROVED SEP UTLS 3-NEW-BK-PORCHES/ STEPS 2-NEW-W-HTRS F-BSMT-L-STORAGE
-
1999-09-16soldstatus $45,000
-
1999-03-06$50,000 145-char remark
Show marketing remark (145 chars)
GREAT BUY WON'T LAST LONG BRICK TRIPLEX 3 LEGAL UNITS ALWAYS RENTED SEC-8-APPROVED SEP UTLS 3-NEW-BK-PORCHES/ STEPS 2-NEW-W-HTRS F-BSMT-L-STORAGE
-
1986-11-07soldstatus $49,000
-
1981-09-09soldstatus $55,000
ⓘ Source: listings_history table (triggers on properties + properties_extension) + one-shot
backfill from property_details.listing_events for pre-trigger history.
Tax reassessment forecast PA · Partial reset (capped growth)
- Current annual tax
- $2,687 · $224/mo
- Projected year-2 tax
- $6,873 · $573/mo
- Expected delta
- +$4,187/yr (+$349/mo · 155.8%)
ⓘ Screening estimate from a state-policy table — verify with the county assessor before closing.
Climate risk First Street
- Flood 7/10 Severe FEMA zone X (unshaded) · 75% chance over 30 yrs
- Wildfire 1/10 Low
- Heat 4/10 Moderate 7 d/yr ≥98°F today · 17 d/yr by 30 yrs out
- Wind 2/10 Low 0% chance of damaging wind over 30 yrs
- Air quality 4/10 Moderate 4 unhealthy d/yr today · 5 by 30 yrs out
Nearby sold comps map
Loading sold comps map…
Walkable amenities ~0.75 mi
Loading nearby amenities…
Taxation est. · year 1
- Rental income
- $63,276
- − Mortgage interest
- −$39,211
- − Property taxes
- −$2,687
- − Insurance
- −$4,166
- − Repairs & maintenance
- −$5,062
- − Management
- −$5,062
- − Depreciation
- −$20,364
- Taxable loss
- −$13,276
- Est. tax savings @ 24.0%
- +$3,186
- After-tax cash flow
- $2,271/yr
For passive investors: Depreciation is non-cash, so a rental often shows a tax loss while cash-flowing — sheltering income. Rental losses are passive: they offset passive income freely, and up to $25,000/yr can offset ordinary (W-2) income if you actively participate and your MAGI is under $100k (phasing out to $0 by $150k); unused losses carry forward. On sale, claimed depreciation is recaptured at up to 25%, and gains may owe capital-gains tax (a 1031 exchange can defer both). Figures are a year-1 estimate at your 24.0% rate — not tax advice; consult a CPA.
Schools (NCES district)
- District
- Wilkinsburg Borough SD
- NCES district ID
- 4226370
- Math proficiency
- 14% ▼ -8.00%
- Reading proficiency
- 23% ▼ -9.00%
- Median HH income
- $32,204
- Composite
- 14.94/100
- National rank
- #9368
- State rank
- #503 of 539 in PA
Livability — Wilkinsburg
- Score
- 76/100
- State rank
- #411
- US rank
- #3754
Category grades
Schools grade is shown separately in the Schools card above.
Census & demographics
- Census place
- Wilkinsburg, PA
- County
- Allegheny County · 1,022,028 people
- City population
- 29,513
- Metro
- Pittsburgh, PA
- Population (ZIP)
- 29,374
- Household income
- $55,028
- Rent vs Own
- Severe rent burden
- 1933.0
Population outlook (Allegheny County) Hauer SSP2
- Today (2025)
- 1,250,282 people
- By 2030
- 1,256,482 · +0.5%
- By 2040
- 1,256,318 · +0.5%
- By 2050
- 1,244,169 · -0.5%
- By 2075
- 1,197,693 · -4.2%
- By 2100
- 1,093,187 · -12.6%
Race, ethnicity, and origin ACS 2023
- Neighborhood character
- Diverse neighborhood (Simpson 0.60)
- Race & ethnicity
- White 47% Black 43% Two or more races 7% Hispanic / Latino 4% Asian 1%
- Common ancestry
- Romanian 4% Lithuanian 2% Serbian 1%
- Foreign-born
- 4% · Canada, South Korea, China
- Languages at home
- 93% English-only · Spanish 2% French/Haitian/Cajun 1% Other Indo-European 1%
Political lean MEDSL · Allegheny
- 2024 margin
- Strong D (+20.3) · D 59.7% · R 39.4%
- 2008→2024 swing
- +4.8pp toward D · 2008: 15.5pp · 2024: 20.3pp
- All cycles
- 2024: D+20.3 2020: D+20.4 2016: D+16.4 2012: D+14.4 2008: D+15.5
Not yet ingested
- Civics
- —
Market trends
- HPI YoY
- ▼ -109.77%
- Current HPI
- 230.0486
- Rent YoY
- ▲ 3.86%
- Metro
- Pittsburgh, PA
- State GDP YoY
- ▲ 1.68%
- F500 in state
- 34
Industry mix (Fortune 500 HQ in PA)
| Industry | F500 HQs | Revenue |
|---|---|---|
| Healthcare | 2 | $309B |
|
||
| Insurance | 2 | $27B |
|
||
| Telecommunications / Media | 1 | $124B |
|
||
| Industrial Distribution | 1 | $22B |
|
||
| Financial Services | 1 | $20B |
|
||
| Chemicals / Materials | 1 | $18B |
|
||
Price history
+1172.7% since first listed6 events — show timeline
- 2026-05-26 Listed $700,000 FSBO.com
- 1999-11-15 Sold (MLS) $45,000 West Penn MLS
- 1999-09-16 Sold (Public Records) $45,000 Public Records
- 1999-03-06 Listed $50,000 West Penn MLS
- 1986-11-07 Sold (Public Records) $49,000 Public Records
- 1981-09-09 Sold (Public Records) $55,000 Public Records
Property tax history
-0.6%/yrLatest (2026): $2,687 · +3.0% YoY. Source: county tax records.
Cash-flow waterfall
monthlySold comps — $/sqft
last 12 mo · ≤1 miLoading sold comps…