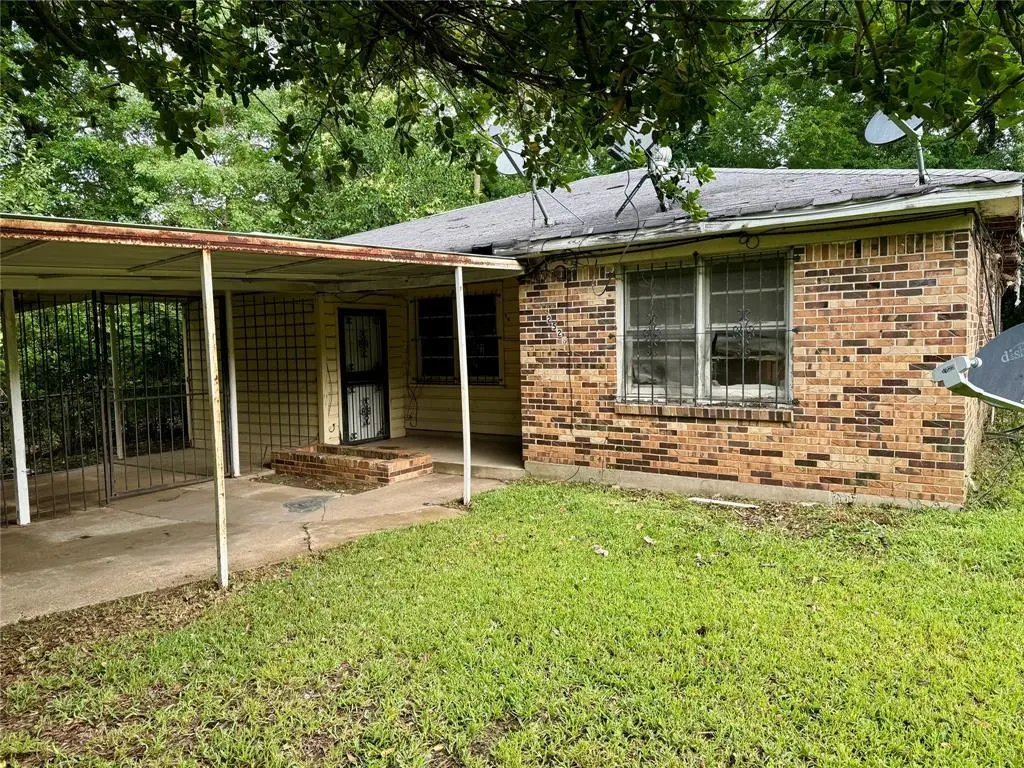
2528 Attaway Ave · Shreveport, LA
Flood risk 5/10 · Moderate
- FEMA flood zone
- X (unshaded)
- Chance of flooding over 30 yrs
- 0.51%
- Est. flood insurance / yr
- $507 – $1,088
Fire risk 1/10 · Minimal
- Est. fire insurance / yr
- $1,269 – $2,357
Heat risk 7/10 · Major
- Hot days now (above 110°F)
- 7 days/yr
- Hot days in 30 yrs
- 21 days/yr
Wind risk 6/10 · Moderate
- Chance of severe wind over 30 yrs
- 66.0%
Air-quality risk 2/10 · Minimal
- Unhealthy air days now
- 1 days/yr
- Unhealthy air days in 30 yrs
- 1 days/yr
Risk factors via First Street. Map © Google.
Why this score? — see what drove the A- grade
The composite is a weighted blend of 9 inputs, each scored 0–100. Each bar is that input's sub-score; the figure is the points it added to the 100-point composite (weight × sub-score).
- Cash flow +30.0/30.0
- ARV discount +15.0/15.0
- 1% rule +10.0/10.0
- DSCR +10.0/10.0
- Appreciation +4.9/10.0
- Livability +3.0/5.0
- Rent growth +2.5/5.0
- Condition / age +2.5/5.0
- Schools +2.2/10.0
$22,500
🖨 Deal sheet 📄 Offer letter ✓ Due diligence
Listing remarks
Investment opportunity at a great price! Brick home on slab foundation located near Willis Knighton Hospital. Features 3 bedrooms, 1 bath, plus a bonus room that could serve as an office, playroom, or additional living space. Home needs some TLC but has solid bones and tons of potential for an investor or buyer looking to add value.
Key facts
- Slab foundation
- Solid bones
- Bonus room
Tags
Property features AI
Finance
- Other: Multi-parcel ID: Yes
- Financial info: Treat as clear loan type; No second mortgage
- HOA & community: No association
Exterior
- Parking: Attached carport; 2 covered parking spaces; 2 carport spaces
- Utilities: City water; City sewer; Located in a municipal utility district
- Home design: Single family residence; Residential property; One story; Property not attached
- Construction: Brick construction; Shingle roof; Slab foundation; Built in 1959
- Exterior features: Lot under 0.5 acre (approximately 0.099 acres); Subdivision: Union Square Sub
Interior
- Kitchen: No appliances included
- Bedrooms: 3 bedrooms (primary bedroom on main level)
- Flooring: Carpet; Laminate
- Bathrooms: 1 full bathroom
- Heating & cooling: Ceiling fan(s)
- Interior features: Built-in features; One living area; One dining area; Two total rooms
- Laundry & utility: Full-size washer/dryer area
Neighborhood map
What this means for you Summary
Snapshot
- This is a 3-bed/1.0-bath single-family listed at $22k.
Deal economics
- At list price, monthly cash flow is $546 ($7k/yr) — positive.
- The deal already cash-flows at list — no discount required.
- Meets the 1% rule at list price ($897 rent vs $22k).
- Cap rate 35.4% vs local median 5.7% in Shreveport — top-decile yield for the area; either an underpriced asset or a hidden risk that comps aren't pricing in. Stress-test before assuming the spread holds.
Location & tenants
- Location reads 59/100 on livability (#270 in LA) — a working-class tenant base; expect higher turnover. Strengths: cost of living A+, housing A; Watch: schools D+, crime F, amenities F.
- Caddo Parish (urban): math 21% / reading 32% proficiency, ranked #53 of 98 in LA (top 54%) — low school quality limits family demand, transient renter base, plan for 1-2y turnover; 64% free/reduced lunch — lower-income household profile, screen leases tightly.
- Market conditions: 69 active listings in the ZIP; 32 comparable units currently listed for rent nearby; rentals at typical pace (median 21d on market — plan ~3-4 weeks tenant-placement turnaround); 41% of comp listings sitting > 30 days — soft ceiling on asking rent; 221 units permitted in Caddo Parish in 2024 (0 in 5+ unit buildings).
Forward outlook
- In year one you build about $119 of equity ($156 loan paydown + $-37 appreciation (-0.2% local appreciation)).
- Caddo County population projected at -15% by 2050 — secular population decline; favor cash flow + early exit over multi-decade hold.
- At projected returns (-0.2% appreciation + 3.0% rent growth), your $6k cash investment doubles in ~1 year — after that, you're playing with house money.
Negotiation context
- Only 14 days on market — expect competitive offers; lowballing is unlikely to land.
Risks & watch-outs
- Watch-outs: built in 1959 — expect roof / HVAC / electrical / plumbing capex.
- Climate carrying-cost: moderate flood risk; major wind risk, 66% chance of damaging wind over 30y; extreme-heat days projected 7→21/yr by 2055 (HVAC capex compounding) — expect insurance premiums to compound above CPI over the hold.
Questions for the listing agent
- Built in 1959 — when were the roof, HVAC, electrical panel, plumbing, and water heater last replaced?
- Is there a deadline driving the sale (1031 exchange, divorce, estate, relocation)? That informs how much negotiation room exists.
- Schools are D-rated, which usually means shorter tenancies and higher turnover. Who's the typical renter profile here, and what's been the actual vacancy rate?
- Crime grade is F in this area — have there been break-ins, vandalism, or insurance claims at this property in the last 3 years? What carrier currently insures it and at what premium?
- What's the average days-on-market for RENTAL listings here right now (not sales)? A rising rental-DOM trend means longer vacancies and softer asking-rent achievability than the comps imply.
- What's the recent tenant-quality profile in this submarket — average credit score on applications, eviction rate, late-payment / NSF rate, and stable-employment percentage? A property-management company in the area should have these aggregated.
- How much new for-sale + rental construction is in the pipeline within 1–3 miles? Heavy new supply typically softens prices + rents 12–24 months out; constrained supply supports both.
Investment metrics
- 1% rule
- 3.99% ✓
- Cap rate
- 35.41%
- Cash-on-cash
- 103.99%
- DSCR
- 5.63
- GRM
- 2.1
CMA / ARV
- ARV (on-the-fly)
- $39,474
- Comps found
- 12
Show comp detail 12 sales within ~0.75 mi
| Address | Dist | Beds/Ba | Sqft | Sold | Price | $/sf | Match |
|---|---|---|---|---|---|---|---|
| 2528 Attaway Ave | 0.00mi | 3/1.0 | 1,284 (+11%) | 0mo | $22,500 | $18 | 82 |
| 3726 Portland Ave | 0.11mi | 2/1.0 (-1) | 1,105 (-5%) | 2mo | $50,500 | $46 | 80 |
| 2527 Emery St | 0.26mi | 3/1.0 | 1,310 (+13%) | 7mo | $29,000 | $22 | 61 |
| 2632 Desoto St | 0.48mi | 2/1.0 (-1) | 1,069 (-8%) | 10mo | $32,500 | $30 | 52 |
| 3218 Sumner St | 0.68mi | 3/1.0 | 1,253 (+8%) | 6mo | $22,000 | $18 | 50 |
| 2449 Midway St | 0.65mi | 2/2.0 (-1) | 1,103 (-5%) | 4mo | $35,000 | $32 | 49 |
| 2326 Leslie St | 0.54mi | 3/1.0 | 1,083 (-7%) | 18mo | $45,500 | $42 | 48 |
| 2618 Drexel | 0.72mi | 2/1.0 (-1) | 1,158 (-0%) | 17mo | $50,000 | $43 | 47 |
| 4202 Orla Ave | 0.63mi | 3/1.5 | 1,080 (-7%) | 18mo | $15,900 | $15 | 42 |
| 2224 Stonewall St | 0.71mi | 2/1.0 (-1) | 1,084 (-7%) | 16mo | $49,900 | $46 | 38 |
| 2908 Hardy St | 0.50mi | 2/1.0 (-1) | 990 (-15%) | 12mo | $42,998 | $43 | 37 |
| 3240 Jackson St | 0.74mi | 2/1.0 (-1) | 1,014 (-13%) | 7mo | $34,900 | $34 | 34 |
Match score weights: distance 35% · size 25% · config 20% · recency 20%. Top-matched comps best support the ARV.
Projected returns pro-forma
-0.17% appreciation · 3.0% rent growth · sell at horizon
- IRR
- —
- Equity multiple
- 6.39×
- Total profit
- $33,956
- Equity at exit
- $6,348
- IRR
- —
- Equity multiple
- 13.25×
- Total profit
- $77,170
- Equity at exit
- $7,484
Cash invested: $6,300 (down + closing). Projections, not guarantees.
Landlord ↔ Tenant lean methodology
- Overall (STATE)
- 90 Strongly Landlord-Friendly
- State Louisiana
- 90 Strongly Landlord-Friendly · R+12
- County
- — inherits STATE
- City
- — inherits STATE
ZIP-level market 71103
- Home prices YoY
- -0.6%
- Active inventory
- 69
- Price-to-rent
- 2.1×
Monthly cashflow live
- Estimated rent
- $897 high interval (Pro) →
- Mortgage (P&I)
- −$118
- Tax from tax record
- −$35 /mo · $422/yr
- Insurance
- −$9
- HOA
- −$0
- Vacancy / Maint / Mgmt
- −$188
- Net cashflow
- $546
Break-even live
UW: 25.0% down · 7.5% · 30yr · 1.5% tax · 5.0% vac · 8.0% maint · 8.0% mgmt
Financing live
Cash to close
- Down payment
- $5,625
- Closing costs
- $675
- Reserves months
- —
- Total cash needed
- —
Loan-product check · same deal, 3 products live
Conventional
25% down · 7.5% · 30yr
- Down + closing
- —
- Monthly P&I
- —
- Monthly cashflow
- —
- DSCR
- —
- Eligible?
- —
Personal DTI + credit; lowest rate.
DSCR
20% down · 8.5% · 30yr
- Down + closing
- —
- Monthly P&I
- —
- Monthly cashflow
- —
- DSCR
- —
- Eligible?
- —
No personal income docs; deal must DSCR.
Hard money
10% down · 12.0% · 12mo
- Down + closing
- —
- Monthly P&I
- —
- Monthly cashflow
- —
- DSCR
- —
- Eligible?
- —
Short-term bridge; refi at stabilization.
Rent comps 32 comps
| Address | Beds | Baths | Sqft | Rent | $/sqft | DOM | Units | Dist |
|---|---|---|---|---|---|---|---|---|
| 2551 Claiborne Ave Shreveport, LA | 2.0 | 1.5 | 1202 | $945 | $0.79 | 13d | 1 | 0.14mi |
| 2520 Merwin St Shreveport, LA | 3.0 | 1.0 | 924 | $700 | $0.76 | 21d | 1 | 0.19mi |
| 2134 Queens Hwy Shreveport, LA | 3.0 | 1.5 | 1374 | $1,475 | $1.07 | 21d | 1 | 0.25mi |
| 2714 DuPont St Shreveport, LA | 2.0 | 1.0 | 980 | $565 | $0.58 | 13d | 1 | 0.39mi |
| 2924 DuPont St Shreveport, LA | 2.0 | 1.0 | 768 | $750 | $0.98 | 21d | 1 | 0.47mi |
| 3240 Jackson St Shreveport, LA | 2.0 | 1.0 | 1014 | $700 | $0.69 | 13d | 1 | 0.73mi |
| 2531 Drexel St Shreveport, LA | 3.0 | 2.0 | 1250 | $950 | $0.76 | 21d | 1 | 0.77mi |
| 4122 Cherokee St Apt 4 Shreveport, LA | 2.0 | 1.0 | 960 | $850 | $0.89 | 44d | 1 | 0.91mi |
| 4122 Cherokee St Apt 4 Shreveport, LA | 2.0 | 1.0 | 750 | $850 | $1.13 | 21d | 1 | 0.91mi |
| 3022 Lillian St Shreveport, LA | 2.0 | 1.0 | 1115 | $695 | $0.62 | 21d | 1 | 0.96mi |
| 1749 Caroline St Shreveport, LA | 4.0 | 1.0 | 1092 | $975 | $0.89 | 21d | 1 | 1.02mi |
| 3323 Darien St Shreveport, LA | 3.0 | 1.0 | 1200 | $785 | $0.65 | 44d | 1 | 1.02mi |
| 1719 Lakeshore Dr Shreveport, LA | 3.0 | 1.5 | 1200 | $950 | $0.79 | 44d | 1 | 1.04mi |
| 3628 Sumner St Shreveport, LA | 3.0 | 1.0 | 956 | $950 | $0.99 | 44d | 1 | 1.08mi |
| 3420 Darien St Shreveport, LA | 2.0 | 1.0 | 1200 | $665 | $0.55 | 13d | 1 | 1.09mi |
| 3515 Stonewall St Shreveport, LA | 2.0 | 1.0 | 1000 | $600 | $0.60 | 13d | 1 | 1.10mi |
| 2042 Laurel St Shreveport, LA | 3.0 | 1.0 | 1100 | $800 | $0.73 | 44d | 1 | 1.13mi |
| 1353 Glen Oak Pl Shreveport, LA | 2.0 | 1.0 | 1116 | $800 | $0.72 | 13d | 1 | 1.16mi |
| 1353 Glen Oak Pl Shreveport, LA | 2.0 | 1.0 | 1116 | $850 | $0.76 | 21d | 1 | 1.16mi |
| 1632 Malcolm St Shreveport, LA | 3.0 | 1.0 | 1254 | $1,150 | $0.92 | 21d | 1 | 1.21mi |
| 5218 Fairfax Ave Shreveport, LA | 2.0 | 1.0 | 971 | $825 | $0.85 | 21d | 1 | 1.24mi |
| 5306 Prentiss Ave Shreveport, LA | 3.0 | 1.0 | 957 | $975 | $1.02 | 44d | 1 | 1.28mi |
| 1954 State St Shreveport, LA | 3.0 | 1.0 | 900 | $900 | $1.00 | 44d | 1 | 1.35mi |
| 3902 Sumner St Shreveport, LA | 2.0 | 1.0 | 900 | $700 | $0.78 | 44d | 1 | 1.36mi |
| 3101 Harp St Shreveport, LA | 3.0 | 1.0 | 839 | $850 | $1.01 | 21d | 1 | 1.40mi |
| 1340 Lincoln St Shreveport, LA | 2.0 | 1.0 | 1120 | $950 | $0.85 | 44d | 1 | 1.41mi |
| 1340 Lincoln St Shreveport, LA | 2.0 | 1.0 | 1120 | $850 | $0.76 | 13d | 1 | 1.41mi |
| 1430 Grigsby St Shreveport, LA | 3.0 | 1.0 | 1052 | $775 | $0.74 | 44d | 1 | 1.41mi |
| 2644 Valley Ridge Rd Shreveport, LA | 4.0 | 1.0 | 1023 | $1,100 | $1.08 | 44d | 1 | 1.42mi |
| 3907 Milton St Shreveport, LA | 3.0 | 1.5 | 1275 | $1,100 | $0.86 | 44d | 1 | 1.44mi |
| 2641 Valley Ridge Rd Shreveport, LA | 3.0 | 1.0 | 1045 | $725 | $0.69 | 21d | 1 | 1.45mi |
| 2711 Thayer St Shreveport, LA | 4.0 | 1.0 | 1436 | $1,552 | $1.08 | 44d | 1 | 1.45mi |
Listing history 10 events
-
2026-06-07statusdays on market $22,500 Pending 14 DOM
-
2026-06-05days on market $22,500 Active 12 DOM
-
2026-06-03days on market $22,500 Active 11 DOM
-
2026-06-02days on market $22,500 Active 10 DOM
-
2026-06-01days on market $22,500 Active 9 DOM
-
2026-05-31days on market $22,500 Active 8 DOM
-
2026-05-30days on market $22,500 Active 7 DOM
-
2026-05-23$22,500 Active
-
2006-05-30soldstatus
-
2004-09-24soldstatus
ⓘ Source: listings_history table (triggers on properties + properties_extension) + one-shot
backfill from property_details.listing_events for pre-trigger history.
Tax reassessment forecast LA · Resets to sale price
- Current annual tax
- $422 · $35/mo
- Projected year-2 tax
- $422 · $35/mo
- Expected delta
- $0/yr ($0/mo · 0.0%)
ⓘ Screening estimate from a state-policy table — verify with the county assessor before closing.
Climate risk First Street
- Flood 5/10 Major FEMA zone X (unshaded) · 51% chance over 30 yrs
- Wildfire 1/10 Low
- Heat 7/10 Severe 7 d/yr ≥110°F today · 21 d/yr by 30 yrs out
- Wind 6/10 Major 66% chance of damaging wind over 30 yrs
- Air quality 2/10 Low 1 unhealthy d/yr today · 1 by 30 yrs out
Nearby sold comps map
Loading sold comps map…
Walkable amenities ~0.75 mi
Loading nearby amenities…
Taxation est. · year 1
- Rental income
- $10,762
- − Mortgage interest
- −$1,260
- − Property taxes
- −$422
- − Insurance
- −$112
- − Repairs & maintenance
- −$861
- − Management
- −$861
- − Depreciation
- −$655
- Taxable income
- $6,590
- Est. tax owed @ 24.0%
- −$1,582
- After-tax cash flow
- $4,969/yr
For passive investors: Depreciation is non-cash, so a rental often shows a tax loss while cash-flowing — sheltering income. Rental losses are passive: they offset passive income freely, and up to $25,000/yr can offset ordinary (W-2) income if you actively participate and your MAGI is under $100k (phasing out to $0 by $150k); unused losses carry forward. On sale, claimed depreciation is recaptured at up to 25%, and gains may owe capital-gains tax (a 1031 exchange can defer both). Figures are a year-1 estimate at your 24.0% rate — not tax advice; consult a CPA.
Schools (NCES district)
- District
- Caddo Parish
- NCES district ID
- 2200300
- Math proficiency
- 21% ▼ -33.00%
- Reading proficiency
- 32% ▼ -30.00%
- Median HH income
- $39,227
- Composite
- 22.23/100
- National rank
- #8148
- State rank
- #53 of 98 in LA
Livability — Shreveport
- Score
- 59/100
- State rank
- #270
- US rank
- #19730
Category grades
Schools grade is shown separately in the Schools card above.
Census & demographics
- Census place
- Shreveport, LA
- City population
- 164,123
- Population (ZIP)
- 6,142
Population outlook (Caddo County) Hauer SSP2
- Today (2025)
- 243,190 people
- By 2030
- 237,231 · -2.5%
- By 2040
- 222,502 · -8.5%
- By 2050
- 206,516 · -15.1%
- By 2075
- 165,706 · -31.9%
- By 2100
- 122,262 · -49.7%
Race, ethnicity, and origin ACS 2023
- Neighborhood character
- Predominantly Black (81%)
- Race & ethnicity
- Black 81% White 17% Hispanic / Latino 1%
- Common ancestry
- Slovak 3% Hispanic 1%
- Languages at home
- 99% English-only · Spanish 1%
Political lean MEDSL · Caddo
- 2024 margin
- Toss-up / Even · D 51.6% · R 47.0% · Other 1.4%
- 2008→2024 swing
- +1.6pp toward D · 2008: 3.0pp · 2024: 4.6pp
- All cycles
- 2024: D+4.6 2020: D+6.8 2016: D+4.2 2012: D+4.9 2008: D+3.0
Not yet ingested
- Civics
- —
Market trends
- HPI YoY
- ▼ -0.17%
- Current HPI
- 26.3904
- Rent YoY
- —
- Metro
- —
- State GDP YoY
- ▲ 3.29%
- F500 in state
- 10
Industry mix (Fortune 500 HQ in LA)
| Industry | F500 HQs | Revenue |
|---|---|---|
| Telecommunications | 2 | $23B |
|
||
| Utilities | 1 | $12B |
|
||
| Wholesale / Distribution | 1 | $5B |
|
||
| Advertising | 1 | $2B |
|
||
Price history
3 events — show timeline
- 2026-05-23 Listed $22,500 NTREIS
- 2006-05-30 Sold (Public Records) — Public Records
- 2004-09-24 Sold (Public Records) — Public Records
Property tax history
-7.5%/yrLatest (2025): $422 · +0.4% YoY. Source: county tax records.
Cash-flow waterfall
monthlySold comps — $/sqft
last 12 mo · ≤1 miLoading sold comps…