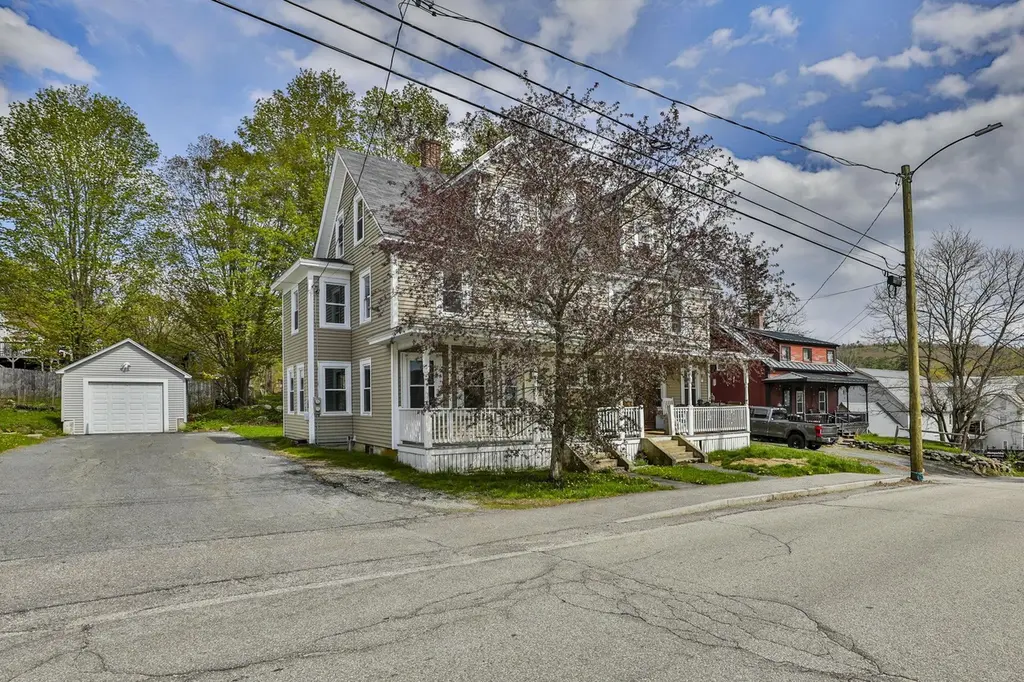
23 Beech St #1 · Newport, NH
Flood risk 1/10 · Minimal
- FEMA flood zone
- X (unshaded)
- Chance of flooding over 30 yrs
- 0.0%
- Est. flood insurance / yr
- $507 – $1,088
Fire risk 3/10 · Minor
- Est. fire insurance / yr
- $507 – $941
Heat risk 3/10 · Minor
- Hot days now (above 91°F)
- 7 days/yr
- Hot days in 30 yrs
- 18 days/yr
Wind risk 4/10 · Minor
- Chance of severe wind over 30 yrs
- 8.0%
Air-quality risk 1/10 · Minimal
- Unhealthy air days now
- 0 days/yr
- Unhealthy air days in 30 yrs
- 0 days/yr
Risk factors via First Street. Map © Google.
Why this score? — see what drove the C+ grade
The composite is a weighted blend of 9 inputs, each scored 0–100. Each bar is that input's sub-score; the figure is the points it added to the 100-point composite (weight × sub-score).
- Cash flow +22.4/30.0
- ARV discount +15.0/15.0
- DSCR +7.2/10.0
- 1% rule +5.9/10.0
- Condition / age +4.0/5.0
- Livability +3.8/5.0
- Rent growth +2.5/5.0
- Schools +1.4/10.0
- Appreciation +0.0/10.0
$207,500
🖨 Deal sheet 📄 Offer letter ✓ Due diligence
Listing remarks
Spacious townhouse-style home offering 1,673 square feet of living space across three levels with no condo fees. This well-maintained residence features 7 rooms, 4 bedrooms, and 1 full bathroom, providing plenty of space for family, guests, a home office, or flexible living arrangements. Separate utilities offer independence and cost control, while the three-level layout provides the comfort and functionality of a single-family home. Ideally located just minutes from Newport's historic downtown, covered bridges, local shops, restaurants, and everyday conveniences, this home offers the perfect balance of charm and accessibility. Outdoor enthusiasts will appreciate easy access to hiking and b
Key facts
- Separate utilities
- Three levels
- Townhouse style home
Tags
Property features AI
Exterior
- Parking: Paved driveway
- Utilities: Public water; Public sewer; Circuit breaker electric; Cable internet available
- Home design: Townhouse; Existing construction; Tan exterior color; Built in 1910
- Construction: Wood frame with vinyl siding; Asphalt shingle roof; Unit/Lot #1
- Exterior features: Level lot; Easements exist; Property surveyed
Interior
- Kitchen: Dishwasher; Microwave; Refrigerator
- Flooring: Hardwood
- Bathrooms: One full bathroom
- Heating & cooling: Oil heating; Steam heating
- Interior features: Seven total rooms; Hardwood flooring; Interior staircase to basement
Neighborhood map
What this means for you Summary
Snapshot
- This is a 4-bed/1.0-bath single-family listed at $208k. Condition is rated good.
Deal economics
- At list price, monthly cash flow is $345 ($4k/yr) — positive.
- The deal already cash-flows at list — no discount required.
- Meets the 1% rule at list price ($2k rent vs $208k).
- Recommended offer: $204k (1.5% below list) — sets the bar for market timing.
- Cap rate 8.3% vs local median 3.4% in Newport — top-decile yield for the area; either an underpriced asset or a hidden risk that comps aren't pricing in. Stress-test before assuming the spread holds.
Location & tenants
- Location reads 76/100 on livability (#26 in NH, #3,805 nationally) — a middle-class / working-renter tenant base. Strengths: cost of living A+, housing A+, health & safety A+; Watch: amenities F, commute F.
- Newport School District (town): math 10% / reading 21% proficiency, ranked #98 of 98 in NH (top 100%) — low school quality limits family demand, transient renter base, plan for 1-2y turnover.
- Zoned schools: Richards Elementary School (math 12% / reading 12%, grade F, #257 of 263 statewide, top 98%, 323 students, 64% FRL) — zoned schools average 64% FRL vs 43% district-wide (21 pts higher); higher-poverty schools than district average — tighter screening recommended.
- Market conditions: 70 active listings in the ZIP; 98 units permitted in Sullivan County in 2024 (0 in 5+ unit buildings).
Forward outlook
- Local home prices are declining (-3.0%/yr); year-one equity from $1k of loan paydown is wiped out by about $6k of value loss. Plan a longer hold.
- Sullivan County population projected at -20% by 2050 — secular population decline; favor cash flow + early exit over multi-decade hold.
Negotiation context
- It's been on market 16 days — a 2% lower offer ($204k) is reasonable based on typical stale-listing flexibility.
Risks & watch-outs
- Watch-outs: built in 1910 — expect roof / HVAC / electrical / plumbing capex.
Questions for the listing agent
- Built in 1910 — when were the roof, HVAC, electrical panel, plumbing, and water heater last replaced?
- Is there a deadline driving the sale (1031 exchange, divorce, estate, relocation)? That informs how much negotiation room exists.
- Schools are D-rated, which usually means shorter tenancies and higher turnover. Who's the typical renter profile here, and what's been the actual vacancy rate?
- What's the average days-on-market for RENTAL listings here right now (not sales)? A rising rental-DOM trend means longer vacancies and softer asking-rent achievability than the comps imply.
- What's the recent tenant-quality profile in this submarket — average credit score on applications, eviction rate, late-payment / NSF rate, and stable-employment percentage? A property-management company in the area should have these aggregated.
- How much new for-sale + rental construction is in the pipeline within 1–3 miles? Heavy new supply typically softens prices + rents 12–24 months out; constrained supply supports both.
Investment metrics
- 1% rule
- 1.09% ✓
- Cap rate
- 8.29%
- Cash-on-cash
- 7.13%
- DSCR
- 1.32
- GRM
- 7.7
CMA / ARV
- ARV (on-the-fly)
- $321,216
- Comps found
- 12
Show comp detail 12 sales within ~0.75 mi
| Address | Dist | Beds/Ba | Sqft | Sold | Price | $/sf | Match |
|---|---|---|---|---|---|---|---|
| 38 River St | 0.20mi | 4/1.5 | 1,598 (-4%) | 3mo | $123,769 | $77 | 79 |
| 9 Lighthouse Way | 0.32mi | 3/2.0 (-1) | 1,671 (-0%) | 1mo | $445,000 | $266 | 76 |
| 78 Sargent Ln | 0.27mi | 3/1.0 (-1) | 1,550 (-7%) | 3mo | $249,999 | $161 | 68 |
| 207 Maple St | 0.53mi | 4/2.5 | 1,610 (-4%) | 1mo | $335,000 | $208 | 62 |
| 39 Myrtle St | 0.46mi | 4/1.0 | 1,559 (-7%) | 6mo | $210,000 | $135 | 62 |
| 84 Sargent Ln | 0.26mi | 3/2.0 (-1) | 1,540 (-8%) | 6mo | $296,000 | $192 | 60 |
| 183 Summer St | 0.58mi | 3/1.5 (-1) | 1,792 (+7%) | 10mo | $330,000 | $184 | 45 |
| 30 Pine St | 0.68mi | 4/2.0 | 1,872 (+12%) | 1mo | $473,000 | $253 | 44 |
| 120 S Main St | 0.55mi | 4/2.5 | 1,435 (-14%) | 4mo | $220,000 | $153 | 42 |
| 162 N Main St | 0.50mi | 4/2.0 | 1,920 (+15%) | 8mo | $300,000 | $156 | 41 |
| 9 Short St | 0.45mi | 3/1.5 (-1) | 1,422 (-15%) | 11mo | $334,000 | $235 | 38 |
| 31 Oak St | 0.60mi | 3/3.0 (-1) | 1,897 (+13%) | 0mo | $375,000 | $198 | 36 |
Match score weights: distance 35% · size 25% · config 20% · recency 20%. Top-matched comps best support the ARV.
Projected returns pro-forma
-3.0% appreciation · 3.0% rent growth · sell at horizon
- IRR
- -5.4%
- Equity multiple
- 0.80×
- Total profit
- $-11,609
- Equity at exit
- $30,939
- IRR
- 4.3%
- Equity multiple
- 1.32×
- Total profit
- $18,333
- Equity at exit
- $17,941
Cash invested: $58,100 (down + closing). Projections, not guarantees.
Landlord ↔ Tenant lean methodology
- Overall (STATE)
- 56 Moderately Landlord-Leaning
- State New Hampshire
- 56 Moderately Landlord-Leaning · D+1
- County
- — inherits STATE
- City
- — inherits STATE
ZIP-level market 03773
- Home prices YoY
- -6.0%
- Active inventory
- 70
- Price-to-rent
- 7.7×
Monthly cashflow live
- Estimated rent
- $2,252 medium interval (Pro) →
- Mortgage (P&I)
- −$1,088
- Tax est. 1.5%
- −$259 /mo · $3,112/yr
- Insurance
- −$86
- HOA
- −$0
- Vacancy / Maint / Mgmt
- −$473
- Net cashflow
- $345
Break-even live
UW: 25.0% down · 7.5% · 30yr · 1.5% tax · 5.0% vac · 8.0% maint · 8.0% mgmt
Financing live
Cash to close
- Down payment
- $51,875
- Closing costs
- $6,225
- Reserves months
- —
- Total cash needed
- —
Loan-product check · same deal, 3 products live
Conventional
25% down · 7.5% · 30yr
- Down + closing
- —
- Monthly P&I
- —
- Monthly cashflow
- —
- DSCR
- —
- Eligible?
- —
Personal DTI + credit; lowest rate.
DSCR
20% down · 8.5% · 30yr
- Down + closing
- —
- Monthly P&I
- —
- Monthly cashflow
- —
- DSCR
- —
- Eligible?
- —
No personal income docs; deal must DSCR.
Hard money
10% down · 12.0% · 12mo
- Down + closing
- —
- Monthly P&I
- —
- Monthly cashflow
- —
- DSCR
- —
- Eligible?
- —
Short-term bridge; refi at stabilization.
Listing history 12 events
-
2026-06-19days on market $207,500 Active 16 DOM
-
2026-06-18days on market $207,500 Active 15 DOM
-
2026-06-17days on market $207,500 Active 14 DOM
-
2026-06-16days on market $207,500 Active 13 DOM
-
2026-06-15days on market $207,500 Active 12 DOM
-
2026-06-14days on market $207,500 Active 10 DOM
-
2026-06-12days on market $207,500 Active 9 DOM
-
2026-06-09days on market $207,500 Active 6 DOM
-
2026-06-08days on market $207,500 Active 5 DOM
-
2026-06-07days on market $207,500 Active 4 DOM
-
2026-06-05remarks 699-char remark
-
2026-06-05$207,500 Active 1 DOM
ⓘ Source: listings_history table (triggers on properties + properties_extension) + one-shot
backfill from property_details.listing_events for pre-trigger history.
Climate risk First Street
- Flood 1/10 Low FEMA zone X (unshaded) · 0% chance over 30 yrs
- Wildfire 3/10 Moderate
- Heat 3/10 Moderate 7 d/yr ≥91°F today · 18 d/yr by 30 yrs out
- Wind 4/10 Moderate 8% chance of damaging wind over 30 yrs
- Air quality 1/10 Low 0 unhealthy d/yr today · 0 by 30 yrs out
Nearby sold comps map
Loading sold comps map…
Walkable amenities ~0.75 mi
Loading nearby amenities…
Taxation est. · year 1
- Rental income
- $27,024
- − Mortgage interest
- −$11,623
- − Property taxes
- −$3,112
- − Insurance
- −$1,038
- − Repairs & maintenance
- −$2,162
- − Management
- −$2,162
- − Depreciation
- −$6,036
- Taxable income
- $891
- Est. tax owed @ 24.0%
- −$214
- After-tax cash flow
- $3,928/yr
For passive investors: Depreciation is non-cash, so a rental often shows a tax loss while cash-flowing — sheltering income. Rental losses are passive: they offset passive income freely, and up to $25,000/yr can offset ordinary (W-2) income if you actively participate and your MAGI is under $100k (phasing out to $0 by $150k); unused losses carry forward. On sale, claimed depreciation is recaptured at up to 25%, and gains may owe capital-gains tax (a 1031 exchange can defer both). Figures are a year-1 estimate at your 24.0% rate — not tax advice; consult a CPA.
Condition & rehab AI · 13 photos
This well-maintained, single-family home offers a good condition with minimal repairs needed. It's located in a desirable location with easy access to amenities. Painting the exterior and landscaping would significantly enhance its curb appeal and value.
Value-add opportunities
- Both Paint exterior — Enhances curb appeal and value
- Both Trim and paint trim — Improves home's appearance and value
- Both Landscaping — Enhances curb appeal and value
Renovation cost estimate screening
Value-add ROI direction
- Both Paint exterior — Enhances curb appeal and value ↑
- Both Trim and paint trim — Improves home's appearance and value ↑
- Both Landscaping — Enhances curb appeal and value ↑
ⓘ Cost ranges are severity-bucket heuristics (US national rule-of-thumb). Get contractor quotes + a written scope before underwriting a rehab budget.
Schools (NCES district)
- District
- Newport School District
- NCES district ID
- 3305310
- Math proficiency
- 10% ▼ -11.00%
- Reading proficiency
- 21% ▼ -13.00%
- Median HH income
- $49,710
- Composite
- 14.12/100
- National rank
- #9459
- State rank
- #98 of 98 in NH
Livability — Newport
- Score
- 76/100
- State rank
- #26
- US rank
- #3805
Category grades
Schools grade is shown separately in the Schools card above.
Census & demographics
- Census place
- Newport, NH
- City population
- 7,905
- Population (ZIP)
- 7,905
Population outlook (Sullivan County) Hauer SSP2
- Today (2025)
- 41,322 people
- By 2030
- 39,910 · -3.4%
- By 2040
- 36,447 · -11.8%
- By 2050
- 32,917 · -20.3%
- By 2075
- 25,997 · -37.1%
- By 2100
- 19,479 · -52.9%
Race, ethnicity, and origin ACS 2023
- Neighborhood character
- Predominantly White (93%)
- Race & ethnicity
- White 93% Two or more races 5% Black 1%
- Common ancestry
- Lithuanian 14% Slovak 4% Romanian 3%
- Foreign-born
- 1%
Political lean MEDSL · Sullivan
- 2024 margin
- Toss-up / Even · D 49.1% · R 49.8% · Other 1.2%
- 2008→2024 swing
- -18.7pp toward R · 2008: 18.0pp · 2024: -0.7pp
- All cycles
- 2024: R+0.7 2020: D+3.6 2016: R+2.6 2012: D+13.3 2008: D+18.0
Not yet ingested
- Civics
- —
Market trends
- HPI YoY
- ▼ -22.59%
- Current HPI
- 352.2789
- Rent YoY
- —
- Metro
- —
- State GDP YoY
- —
- F500 in state
- 0
Price history
1 event — show timeline
- 2026-06-03 Listed $207,500 PrimeMLS
Cash-flow waterfall
monthlySold comps — $/sqft
last 12 mo · ≤1 miLoading sold comps…