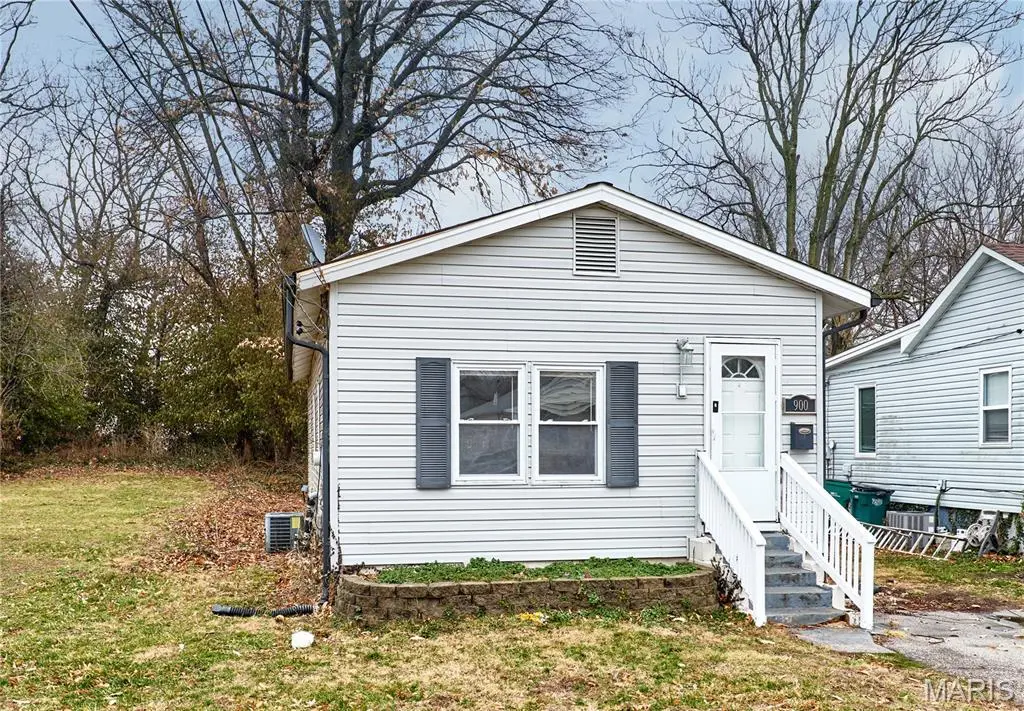
900 N Elm Ave · Webster Groves, MO
Flood risk 1/10 · Minimal
- FEMA flood zone
- X (unshaded)
- Chance of flooding over 30 yrs
- 0.0%
- Est. flood insurance / yr
- $473 – $860
Fire risk 1/10 · Minimal
- Est. fire insurance / yr
- $1,054 – $1,958
Heat risk 5/10 · Moderate
- Hot days now (above 107°F)
- 7 days/yr
- Hot days in 30 yrs
- 21 days/yr
Wind risk 2/10 · Minimal
- Chance of severe wind over 30 yrs
- 1.0%
Air-quality risk 3/10 · Minor
- Unhealthy air days now
- 2 days/yr
- Unhealthy air days in 30 yrs
- 4 days/yr
Risk factors via First Street. Map © Google.
Why this score? — see what drove the C- grade
The composite is a weighted blend of 9 inputs, each scored 0–100. Each bar is that input's sub-score; the figure is the points it added to the 100-point composite (weight × sub-score).
- Cash flow +18.6/30.0
- ARV discount +6.8/15.0
- DSCR +5.9/10.0
- Schools +5.5/10.0
- Rent growth +4.5/5.0
- 1% rule +4.1/10.0
- Livability +3.9/5.0
- Condition / age +2.5/5.0
- Appreciation +0.0/10.0
$185,000
🖨 Deal sheet 📄 Offer letter ✓ Due diligence
Listing remarks MLS
Charming 3-bedroom home in the heart of Webster Groves, one of St. Louis’ most desirable communities. Located near top-rated schools and just minutes from popular restaurants, shopping, and local amenities. This property offers excellent potential with only minimal updates needed, presenting a great opportunity for investors or buyers looking to add value in a sought-after neighborhood. Selling property as-is.
Key facts
- Local amenities
- Popular restaurants
- Top-rated schools
Tags
Neighborhood map
What this means for you Summary
Snapshot
- This is a 1-bed/1.0-bath single-family listed at $185k.
Deal economics
- At list price, monthly cash flow is $180 ($2k/yr) — positive.
- The deal already cash-flows at list — no discount required.
- To meet the 1% rule (rent ≥ 1% of price), the offer needs to be $168k (9.0% below list).
- Recommended offer: $168k (9.0% below list) — sets the bar for 1% rule.
- Cap rate 7.5% vs local median 2.9% in Webster Groves — top-decile yield for the area; either an underpriced asset or a hidden risk that comps aren't pricing in. Stress-test before assuming the spread holds.
Location & tenants
- Location reads 77/100 on livability (#37 in MO, #3,184 nationally) — a middle-class / working-renter tenant base. Strengths: schools A+, crime A+, employment A+; Watch: cost of living C-, amenities F, commute F.
- Webster Groves (suburban): math 56% / reading 67% proficiency, ranked #7 of 324 in MO (top 2%) — acceptable for families but not a draw, mixed tenant base, ~2y average lease; only 13% free/reduced lunch — higher-income household profile.
- Market conditions: Rents rising fast (+8.2%/yr); 155 active listings in the ZIP; 16 comparable units currently listed for rent nearby; rentals leasing fast (median 8d on market — plan ~1-2 weeks tenant-placement turnaround); solid renter incomes; 920 units permitted in St. Louis County in 2024 (250 in 5+ unit buildings).
Forward outlook
- Local home prices are declining (-3.0%/yr); year-one equity from $1k of loan paydown is wiped out by about $6k of value loss. Plan a longer hold.
- At projected returns (-3.0% appreciation + 8.0% rent growth), your $52k cash investment doubles in ~10 years — after that, you're playing with house money.
Negotiation context
- It's been on market 83 days — a 6% lower offer ($174k) is reasonable based on typical stale-listing flexibility.
- 3 sale attempts since 7y ago; this cycle's ask has dropped $15k (8%) from the opening price — seller is motivated, your offer sets the floor, not the list.
- Current owner paid $60k; list at $185k implies a 208% gain — meaningful room to come down on a strong offer.
Risks & watch-outs
- Watch-outs: built in 1925 — expect roof / HVAC / electrical / plumbing capex.
- Climate carrying-cost: extreme-heat days projected 7→21/yr by 2055 (HVAC capex compounding) — expect insurance premiums to compound above CPI over the hold.
Questions for the listing agent
- It's been on market 83 days. Have you received any prior offers? Is the seller open to a 9% concession, seller financing, or rate buy-down credit?
- Built in 1925 — when were the roof, HVAC, electrical panel, plumbing, and water heater last replaced?
- Why hasn't it sold? Are there any deal-killer items the seller is aware of (foundation, flood, title, zoning, code violations)?
- Is there a deadline driving the sale (1031 exchange, divorce, estate, relocation)? That informs how much negotiation room exists.
- Schools are A-rated — typically a magnet for longer-tenancy family renters. What's the average tenant stay here, and is there a school-zone premium baked into asking?
- What's the average days-on-market for RENTAL listings here right now (not sales)? A rising rental-DOM trend means longer vacancies and softer asking-rent achievability than the comps imply.
- What's the recent tenant-quality profile in this submarket — average credit score on applications, eviction rate, late-payment / NSF rate, and stable-employment percentage? A property-management company in the area should have these aggregated.
- How much new for-sale + rental construction is in the pipeline within 1–3 miles? Heavy new supply typically softens prices + rents 12–24 months out; constrained supply supports both.
Investment metrics
- 1% rule
- 0.91% ✗
- Cap rate
- 7.46%
- Cash-on-cash
- 4.16%
- DSCR
- 1.19
- GRM
- 9.2
CMA / ARV
- ARV (median comp)
- $182,335
- List price
- $185,000
- Delta
- 1.46%
- Verdict
- FAIR
- Comps
- 20 within 1.0 mi
Show comp detail 12 sales within ~0.75 mi
| Address | Dist | Beds/Ba | Sqft | Sold | Price | $/sf | Match |
|---|---|---|---|---|---|---|---|
| 206 Eldridge Ave | 0.28mi | 2/1.0 (+1) | 864 (+4%) | 5mo | $250,000 | $289 | 71 |
| 121 Eldridge Ave | 0.20mi | 2/1.0 (+1) | 882 (+6%) | 20mo | $100,000 | $113 | 58 |
| 120 Madison Ave | 0.28mi | 2/1.5 (+1) | 875 (+6%) | 16mo | $219,900 | $251 | 57 |
| 29 E Allison Ave | 0.17mi | 2/1.0 (+1) | 720 (-13%) | 12mo | $179,900 | $250 | 56 |
| 1048 Charleville Ave | 0.61mi | 2/1.0 (+1) | 832 (+0%) | 13mo | $199,000 | $239 | 54 |
| 623 Holland Ave | 0.15mi | 2/1.0 (+1) | 736 (-11%) | 18mo | $199,900 | $272 | 54 |
| 2827 Dunkirk Dr | 0.39mi | 2/1.0 (+1) | 918 (+11%) | 14mo | $279,900 | $305 | 47 |
| 9324 Crawford Ave | 0.63mi | 2/1.0 (+1) | 870 (+5%) | 13mo | $249,000 | $286 | 46 |
| 2807 Dunkirk Dr | 0.44mi | 2/1.0 (+1) | 918 (+11%) | 20mo | $250,000 | $272 | 40 |
| 601 N Rock Hill Rd | 0.52mi | 2/1.0 (+1) | 911 (+10%) | 21mo | $265,000 | $291 | 37 |
| 9009 Madge Ave | 0.67mi | 2/1.0 (+1) | 875 (+6%) | 23mo | $199,900 | $228 | 35 |
| 8828 Madge Ave | 0.67mi | 2/1.0 (+1) | 940 (+14%) | 7mo | $285,000 | $303 | 35 |
Match score weights: distance 35% · size 25% · config 20% · recency 20%. Top-matched comps best support the ARV.
Projected returns pro-forma
-3.0% appreciation · 8.0% rent growth · sell at horizon
- IRR
- -4.8%
- Equity multiple
- 0.81×
- Total profit
- $-9,688
- Equity at exit
- $27,584
- IRR
- 9.6%
- Equity multiple
- 1.90×
- Total profit
- $46,598
- Equity at exit
- $15,995
Cash invested: $51,800 (down + closing). Projections, not guarantees.
Landlord ↔ Tenant lean methodology
- Overall (STATE)
- 81 Strongly Landlord-Friendly
- State Missouri
- 81 Strongly Landlord-Friendly · R+10
- County
- — inherits STATE
- City
- — inherits STATE
ZIP-level market 63119
- Rents YoY
- 8.2%
- Active inventory
- 155
- Price-to-rent
- 9.2×
Monthly cashflow live
- Estimated rent
- $1,684 high interval (Pro) →
- Mortgage (P&I)
- −$970
- Tax from tax record
- −$104 /mo · $1,246/yr
- Insurance
- −$77
- HOA
- −$0
- Vacancy / Maint / Mgmt
- −$354
- Net cashflow
- $180
Break-even live
UW: 25.0% down · 7.5% · 30yr · 1.5% tax · 5.0% vac · 8.0% maint · 8.0% mgmt
Financing live
Cash to close
- Down payment
- $46,250
- Closing costs
- $5,550
- Reserves months
- —
- Total cash needed
- —
Loan-product check · same deal, 3 products live
Conventional
25% down · 7.5% · 30yr
- Down + closing
- —
- Monthly P&I
- —
- Monthly cashflow
- —
- DSCR
- —
- Eligible?
- —
Personal DTI + credit; lowest rate.
DSCR
20% down · 8.5% · 30yr
- Down + closing
- —
- Monthly P&I
- —
- Monthly cashflow
- —
- DSCR
- —
- Eligible?
- —
No personal income docs; deal must DSCR.
Hard money
10% down · 12.0% · 12mo
- Down + closing
- —
- Monthly P&I
- —
- Monthly cashflow
- —
- DSCR
- —
- Eligible?
- —
Short-term bridge; refi at stabilization.
Rent comps 16 comps
| Address | Beds | Baths | Sqft | Rent | $/sqft | DOM | Units | Dist |
|---|---|---|---|---|---|---|---|---|
| 324 Eldridge Ave Saint Louis, MO | 2.0 | 1.0 | 1015 | $2,000 | $1.97 | 1d | 1 | 0.40mi |
| 9305 Manchester Rd St. Louis, MO | 1.0–2.0 | 1.0 | 776 | $1,018 | $1.31 | 2d | 12 | 0.46mi |
| 2806 Hilldale Ave Saint Louis, MO | 2.0 | 2.0 | 1104 | $2,550 | $2.31 | 1d | 1 | 0.48mi |
| 425 Bismark Ave Saint Louis, MO | 2.0 | 1.5 | 853 | $2,095 | $2.46 | 43d | 1 | 0.61mi |
| 1034 N Rock Hill Rd Saint Louis, MO | 2.0 | 1.0 | 696 | $1,650 | $2.37 | 43d | 1 | 0.64mi |
| 9006 Madge Ave Saint Louis, MO | 2.0 | 2.0 | 1000 | $2,100 | $2.10 | 7d | 1 | 0.66mi |
| 72 Van Mark Way Brentwood, MO | 1.0–2.0 | 1.0 | 780 | $1,102 | $1.41 | 1d | 4 | 0.80mi |
| 9724 Greenwood Ter Saint Louis, MO | 2.0 | 1.0 | 907 | $1,525 | $1.68 | 20d | 1 | 0.85mi |
| 2501 Mary Ave Brentwood, MO | 1.0 | 1.5 | 1100 | $1,725 | $1.57 | 7d | 1 | 0.93mi |
| 226 E Lockwood Ave Saint Louis, MO | 1.0 | 1.0 | 672 | $2,570 | $3.82 | 1d | 5 | 0.94mi |
| 8661 Litzsinger Rd Saint Louis, MO | 2.0 | 1.0 | 910 | $1,765 | $1.94 | 43d | 1 | 1.07mi |
| 31 Sunnen Dr Maplewood, MO | 1.0–2.0 | 1.0–2.0 | 956 | $1,641 | $1.72 | 1d | 17 | 1.37mi |
| 7848 Big Bend Blvd Unit 6 Webster Groves, MO | 1.0 | 1.0 | 600 | $750 | $1.25 | 4d | 1 | 1.42mi |
| 1696 E Swan Cir Saint Louis, MO | 2.0 | 1.0 | 967 | $1,600 | $1.65 | 43d | 1 | 1.45mi |
| 1736 Redbird Cv Saint Louis, MO | 2.0 | 1.0 | 900 | $1,800 | $2.00 | 43d | 1 | 1.46mi |
| 1800 S Brentwood Blvd Saint Louis, MO | 1.0–3.0 | 1.0–2.0 | 1164 | $1,490 | $1.28 | 1d | 19 | 1.50mi |
Listing history 29 events
-
2026-06-18days on market $185,000 Active 83 DOM
-
2026-06-17days on market $185,000 Active 82 DOM
-
2026-06-16days on market $185,000 Active 81 DOM
-
2026-06-15days on market $185,000 Active 80 DOM
-
2026-06-13days on market $185,000 Active 78 DOM
-
2026-06-13days on market $185,000 Active 77 DOM
-
2026-06-09days on market $185,000 Active 74 DOM
-
2026-06-08days on market $185,000 Active 73 DOM
-
2026-06-07days on market $185,000 Active 72 DOM
-
2026-06-05days on market $185,000 Active 69 DOM
-
2026-06-03days on market $185,000 Active 68 DOM
-
2026-06-02days on market $185,000 Active 67 DOM
-
2026-06-01days on market $185,000 Active 66 DOM
-
2026-05-31days on market $185,000 Active 65 DOM
-
2026-04-17price $185,000 419-char remark
Show marketing remark (419 chars)
Charming 3-bedroom home in the heart of Webster Groves, one of St. Louis’ most desirable communities. Located near top-rated schools and just minutes from popular restaurants, shopping, and local amenities. This property offers excellent potential with only minimal updates needed, presenting a great opportunity for investors or buyers looking to add value in a sought-after neighborhood. Selling property as-is.
-
2026-03-27$200,000 Active 419-char remark
Show marketing remark (419 chars)
Charming 3-bedroom home in the heart of Webster Groves, one of St. Louis’ most desirable communities. Located near top-rated schools and just minutes from popular restaurants, shopping, and local amenities. This property offers excellent potential with only minimal updates needed, presenting a great opportunity for investors or buyers looking to add value in a sought-after neighborhood. Selling property as-is.
-
2026-03-09price $200,000
-
2026-03-05$500,000 Active
-
2026-03-05historical
-
2019-11-06price $127,500
-
2019-03-19soldstatus $60,000
-
2019-03-15soldstatus Closed
-
2019-02-22status Pending
-
2019-02-22historical Active Under Contract
-
2019-02-20$65,000 Active
-
2011-11-08soldstatus $45,000
-
1988-07-01soldstatus $7,000
-
1988-01-01soldstatus
-
1988-01-01soldstatus $3,000
ⓘ Source: listings_history table (triggers on properties + properties_extension) + one-shot
backfill from property_details.listing_events for pre-trigger history.
Tax reassessment forecast MO · Resets to sale price
- Current annual tax
- $1,246 · $104/mo
- Projected year-2 tax
- $1,794 · $150/mo
- Expected delta
- +$549/yr (+$46/mo · 44.1%)
ⓘ Screening estimate from a state-policy table — verify with the county assessor before closing.
Climate risk First Street
- Flood 1/10 Low FEMA zone X (unshaded) · 0% chance over 30 yrs
- Wildfire 1/10 Low
- Heat 5/10 Major 7 d/yr ≥107°F today · 21 d/yr by 30 yrs out
- Wind 2/10 Low 100% chance of damaging wind over 30 yrs
- Air quality 3/10 Moderate 2 unhealthy d/yr today · 4 by 30 yrs out
Nearby sold comps map
Loading sold comps map…
Walkable amenities ~0.75 mi
Loading nearby amenities…
Taxation est. · year 1
- Rental income
- $20,213
- − Mortgage interest
- −$10,363
- − Property taxes
- −$1,246
- − Insurance
- −$925
- − Repairs & maintenance
- −$1,617
- − Management
- −$1,617
- − Depreciation
- −$5,382
- Taxable loss
- −$936
- Est. tax savings @ 24.0%
- +$225
- After-tax cash flow
- $2,380/yr
For passive investors: Depreciation is non-cash, so a rental often shows a tax loss while cash-flowing — sheltering income. Rental losses are passive: they offset passive income freely, and up to $25,000/yr can offset ordinary (W-2) income if you actively participate and your MAGI is under $100k (phasing out to $0 by $150k); unused losses carry forward. On sale, claimed depreciation is recaptured at up to 25%, and gains may owe capital-gains tax (a 1031 exchange can defer both). Figures are a year-1 estimate at your 24.0% rate — not tax advice; consult a CPA.
Schools (NCES district)
- District
- Webster Groves
- NCES district ID
- 2931530
- Math proficiency
- 56% ▼ -3.00%
- Reading proficiency
- 67% ▲ 3.00%
- Median HH income
- $78,389
- Composite
- 54.99/100
- National rank
- #1298
- State rank
- #7 of 324 in MO
Livability — Webster Groves
- Score
- 77/100
- State rank
- #37
- US rank
- #3184
Category grades
Schools grade is shown separately in the Schools card above.
Census & demographics
- Census place
- Webster Groves, MO
- County
- Saint Louis County · 888,823 people
- City population
- 34,181
- Metro
- St. Louis, MO-IL
- Population (ZIP)
- 34,181
- Household income
- $106,183
- Rent vs Own
- Severe rent burden
- 1320.0
Population outlook (St. Louis County) Hauer SSP2
- Today (2025)
- 1,025,227 people
- By 2030
- 1,028,023 · +0.3%
- By 2040
- 1,020,940 · -0.4%
- By 2050
- 1,007,280 · -1.8%
- By 2075
- 987,277 · -3.7%
- By 2100
- 921,984 · -10.1%
Race, ethnicity, and origin ACS 2023
- Neighborhood character
- Predominantly White (77%)
- Race & ethnicity
- White 77% Black 10% Two or more races 9% Hispanic / Latino 3% Asian 2%
- Common ancestry
- Lithuanian 4% Slovak 3% Romanian 3%
- Foreign-born
- 6% · Canada
- Languages at home
- 93% English-only · Spanish 1% Other Indo-European 1% German/W. Germanic 1%
Political lean MEDSL · St. Louis
- 2024 margin
- Strong D (+23.4) · D 60.8% · R 37.4% · Other 1.7%
- 2008→2024 swing
- +3.5pp toward D · 2008: 19.9pp · 2024: 23.4pp
- All cycles
- 2024: D+23.4 2020: D+24.0 2016: D+16.2 2012: D+13.7 2008: D+19.9
Not yet ingested
- Civics
- —
Market trends
- HPI YoY
- ▼ -463.48%
- Current HPI
- 221.7655
- Rent YoY
- ▲ 8.19%
- Metro
- St. Louis, MO-IL
- State GDP YoY
- ▲ 1.84%
- F500 in state
- 20
Industry mix (Fortune 500 HQ in MO)
| Industry | F500 HQs | Revenue |
|---|---|---|
| Healthcare | 1 | $163B |
|
||
| Insurance | 1 | $21B |
|
||
| Industrial Technology | 1 | $17B |
|
||
| Retail | 1 | $16B |
|
||
| Industrial Distribution | 1 | $10B |
|
||
| Utilities | 1 | $9B |
|
||
Price history
+6066.7% since first listed15 events — show timeline
- 2026-04-17 Price Changed $185,000 MARIS as Distributed by MLS Grid
- 2026-03-27 Listed $200,000 MARIS as Distributed by MLS Grid
- 2026-03-09 Price Changed $200,000 MARIS as Distributed by MLS Grid
- 2026-03-05 Listed $500,000 MARIS as Distributed by MLS Grid
- 2026-03-05 Coming Soon — MARIS as Distributed by MLS Grid
- 2019-11-06 Price Changed $127,500 MARIS as Distributed by MLS Grid
- 2019-03-19 Sold (Public Records) $60,000 Public Records
- 2019-03-15 Sold (MLS) — MARIS as Distributed by MLS Grid
- 2019-02-22 Pending — MARIS as Distributed by MLS Grid
- 2019-02-22 Contingent — MARIS as Distributed by MLS Grid
- 2019-02-20 Listed $65,000 MARIS as Distributed by MLS Grid
- 2011-11-08 Sold (Public Records) $45,000 Public Records
- 1988-07-01 Sold (Public Records) $7,000 Public Records
- 1988-01-01 Sold (Public Records) $3,000 Public Records
- 1988-01-01 Sold (Public Records) — Public Records
Property tax history
+2.5%/yrLatest (2022): $1,246 · +0.3% YoY. Source: county tax records.
Cash-flow waterfall
monthlySold comps — $/sqft
last 12 mo · ≤1 miLoading sold comps…