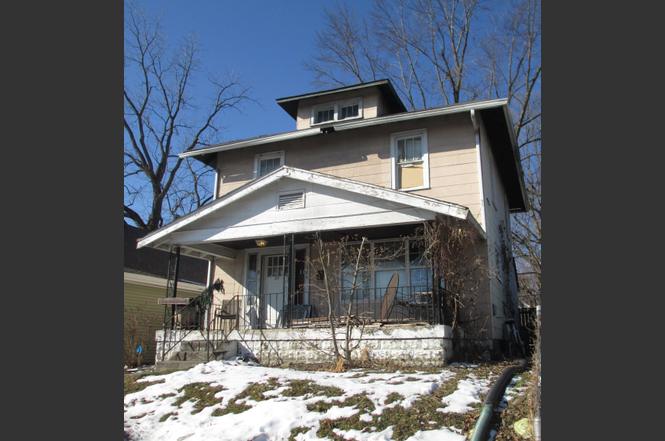
344 S Oakland Ave · Indianapolis city (balance), IN
Flood risk 1/10 · Minimal
- FEMA flood zone
- X (unshaded)
- Chance of flooding over 30 yrs
- 0.0%
- Est. flood insurance / yr
- $473 – $860
Fire risk 1/10 · Minimal
- Est. fire insurance / yr
- $717 – $1,331
Heat risk 4/10 · Minor
- Hot days now (above 101°F)
- 7 days/yr
- Hot days in 30 yrs
- 19 days/yr
Wind risk 2/10 · Minimal
- Chance of severe wind over 30 yrs
- 1.0%
Air-quality risk 4/10 · Minor
- Unhealthy air days now
- 5 days/yr
- Unhealthy air days in 30 yrs
- 7 days/yr
Risk factors via First Street. Map © Google.
Why this score? — see what drove the B- grade
The composite is a weighted blend of 9 inputs, each scored 0–100. Each bar is that input's sub-score; the figure is the points it added to the 100-point composite (weight × sub-score).
- Cash flow +30.0/30.0
- 1% rule +10.0/10.0
- DSCR +10.0/10.0
- ARV discount +7.5/15.0
- Rent growth +4.3/5.0
- Livability +2.5/5.0
- Condition / age +2.5/5.0
- Schools +1.4/10.0
- Appreciation +0.0/10.0
$85,000
🖨 Deal sheet 📄 Offer letter ✓ Due diligence
Listing remarks MLS
Corporate owned. Sold AS-IS. All offers must be submitted with a minimum of $1000 earnest money. Pre-approval letter or proof of funds must accompany all offers. All offers subject to sellers addendums and corporate app roval. Room sizes approximate. Four bedrooms. LOTS of space here. 2-CD garage. Could be good rental property.
Key facts
- Covered carport
- High ceilings
- Hardwood floors
Tags
Neighborhood map
What this means for you Summary
Snapshot
- This is a 4-bed/1.0-bath single-family listed at $85k.
Deal economics
- At list price, monthly cash flow is $731 ($9k/yr) — positive.
- The deal already cash-flows at list — no discount required.
- Meets the 1% rule at list price ($2k rent vs $85k).
- Recommended offer: $82k (3.0% below list) — sets the bar for market timing.
- Cap rate 16.6% vs local median 4.4% in Indianapolis city (balance) — top-decile yield for the area; either an underpriced asset or a hidden risk that comps aren't pricing in. Stress-test before assuming the spread holds.
Location & tenants
- Location reads: area grade B — affects rentability + tenant quality, not the cash-flow math above.
- Indianapolis Public Schools (urban): math 14% / reading 20% proficiency, ranked #286 of 301 in IN (top 95%) — low school quality limits family demand, transient renter base, plan for 1-2y turnover; 77% free/reduced lunch — lower-income household profile, screen leases tightly.
- Market conditions: Rents rising fast (+7.3%/yr); 480 active listings in the ZIP; 40 comparable units currently listed for rent nearby; rentals at typical pace (median 24d on market — plan ~3-4 weeks tenant-placement turnaround); 45% of comp listings sitting > 30 days — soft ceiling on asking rent; 1,906 units permitted in Marion County in 2024 (621 in 5+ unit buildings).
- This rent runs 42% of the median local income ($49k/yr) — at the standard rent-burdened threshold; future hikes will face affordability resistance.
Forward outlook
- Local home prices are declining (-3.0%/yr); year-one equity from $588 of loan paydown is wiped out by about $3k of value loss. Plan a longer hold.
- Marion County population projected at +18% by 2050 — long-run rental-demand tailwind backs the buy-and-hold thesis.
- At projected returns (-3.0% appreciation + 7.3% rent growth), your $24k cash investment doubles in ~3 years — after that, you're playing with house money.
Negotiation context
- It's been on market 31 days — a 3% lower offer ($82k) is reasonable based on typical stale-listing flexibility.
- 3 sale attempts since 20y ago with the ask held roughly flat each time — persistent listings suggest the price (not the market) is what's stuck; bring a comps-based counter.
- Current owner paid $15k; list at $85k implies a 467% gain — meaningful room to come down on a strong offer.
Risks & watch-outs
- Watch-outs: built in 1929 — expect roof / HVAC / electrical / plumbing capex.
Questions for the listing agent
- It's been on market 31 days. Have you received any prior offers? Is the seller open to a 3% concession, seller financing, or rate buy-down credit?
- Built in 1929 — when were the roof, HVAC, electrical panel, plumbing, and water heater last replaced?
- Is there a deadline driving the sale (1031 exchange, divorce, estate, relocation)? That informs how much negotiation room exists.
- What's the average days-on-market for RENTAL listings here right now (not sales)? A rising rental-DOM trend means longer vacancies and softer asking-rent achievability than the comps imply.
- What's the recent tenant-quality profile in this submarket — average credit score on applications, eviction rate, late-payment / NSF rate, and stable-employment percentage? A property-management company in the area should have these aggregated.
- How much new for-sale + rental construction is in the pipeline within 1–3 miles? Heavy new supply typically softens prices + rents 12–24 months out; constrained supply supports both.
Investment metrics
- 1% rule
- 2.01% ✓
- Cap rate
- 16.61%
- Cash-on-cash
- 36.85%
- DSCR
- 2.64
- GRM
- 4.2
CMA / ARV
- ARV (on-the-fly)
- $184,080
- Comps found
- 12
Show comp detail 12 sales within ~0.75 mi
| Address | Dist | Beds/Ba | Sqft | Sold | Price | $/sf | Match |
|---|---|---|---|---|---|---|---|
| 235 S Dearborn St | 0.22mi | 3/2.0 (-1) | 1,541 (+0%) | 14mo | $299,900 | $195 | 69 |
| 524 Leeds Ave | 0.32mi | 3/1.5 (-1) | 1,640 (+7%) | 1mo | $109,900 | $67 | 66 |
| 3220 Newton Ave | 0.27mi | 3/1.0 (-1) | 1,356 (-12%) | 11mo | $144,000 | $106 | 53 |
| 602 S Sherman Dr | 0.61mi | 3/2.0 (-1) | 1,556 (+1%) | 11mo | $182,000 | $117 | 51 |
| 319 S Temple Ave | 0.28mi | 3/2.5 (-1) | 1,313 (-14%) | 4mo | $177,500 | $135 | 49 |
| 245 N Tacoma Ave | 0.73mi | 3/2.0 (-1) | 1,510 (-2%) | 10mo | $370,000 | $245 | 46 |
| 3823 Hoyt Ave | 0.73mi | 3/1.5 (-1) | 1,532 (-0%) | 16mo | $184,000 | $120 | 46 |
| 2919 E New York St | 0.67mi | 4/1.0 | 1,444 (-6%) | 16mo | $95,000 | $66 | 46 |
| 25 N Ewing St | 0.71mi | 3/2.0 (-1) | 1,660 (+8%) | 2mo | $90,100 | $54 | 43 |
| 238 N Tacoma Ave | 0.73mi | 3/2.0 (-1) | 1,412 (-8%) | 5mo | $292,500 | $207 | 40 |
| 219 S Sherman Dr | 0.65mi | 3/2.0 (-1) | 1,744 (+14%) | 7mo | $200,000 | $115 | 32 |
| 242 N Tacoma Ave | 0.74mi | 3/2.0 (-1) | 1,400 (-9%) | 13mo | $290,000 | $207 | 31 |
Match score weights: distance 35% · size 25% · config 20% · recency 20%. Top-matched comps best support the ARV.
Projected returns pro-forma
-3.0% appreciation · 7.31% rent growth · sell at horizon
- IRR
- 37.6%
- Equity multiple
- 2.70×
- Total profit
- $40,534
- Equity at exit
- $12,674
- IRR
- 46.4%
- Equity multiple
- 6.46×
- Total profit
- $130,023
- Equity at exit
- $7,349
Cash invested: $23,800 (down + closing). Projections, not guarantees.
Landlord ↔ Tenant lean methodology
- Overall (STATE)
- 90 Strongly Landlord-Friendly
- State Indiana
- 90 Strongly Landlord-Friendly · R+11
- County
- — inherits STATE
- City
- — inherits STATE
ZIP-level market 46201
- Home prices YoY
- -33.9%
- Rents YoY
- 7.3%
- Active inventory
- 480
- Price-to-rent
- 4.2×
Monthly cashflow live
- Estimated rent
- $1,705 high interval (Pro) →
- Mortgage (P&I)
- −$446
- Tax from tax record
- −$135 /mo · $1,622/yr
- Insurance
- −$35
- HOA
- −$0
- Vacancy / Maint / Mgmt
- −$358
- Net cashflow
- $731
Break-even live
UW: 25.0% down · 7.5% · 30yr · 1.5% tax · 5.0% vac · 8.0% maint · 8.0% mgmt
Financing live
Cash to close
- Down payment
- $21,250
- Closing costs
- $2,550
- Reserves months
- —
- Total cash needed
- —
Loan-product check · same deal, 3 products live
Conventional
25% down · 7.5% · 30yr
- Down + closing
- —
- Monthly P&I
- —
- Monthly cashflow
- —
- DSCR
- —
- Eligible?
- —
Personal DTI + credit; lowest rate.
DSCR
20% down · 8.5% · 30yr
- Down + closing
- —
- Monthly P&I
- —
- Monthly cashflow
- —
- DSCR
- —
- Eligible?
- —
No personal income docs; deal must DSCR.
Hard money
10% down · 12.0% · 12mo
- Down + closing
- —
- Monthly P&I
- —
- Monthly cashflow
- —
- DSCR
- —
- Eligible?
- —
Short-term bridge; refi at stabilization.
Rent comps 40 comps
| Address | Beds | Baths | Sqft | Rent | $/sqft | DOM | Units | Dist |
|---|---|---|---|---|---|---|---|---|
| 253 S Gray St Indianapolis, IN | 3.0 | 1.5 | 1176 | $1,660 | $1.41 | 1d | 1 | 0.15mi |
| 323 S Rural St Indianapolis, IN | 3.0 | 1.5 | 1090 | $1,050 | $0.96 | 43d | 1 | 0.17mi |
| 2631 Southeastern Ave Indianapolis, IN | 3.0 | 2.0 | 1072 | $1,195 | $1.11 | 11d | 1 | 0.28mi |
| 241 S Temple Ave Indianapolis, IN | 3.0 | 2.0 | 1200 | $1,350 | $1.12 | 43d | 1 | 0.31mi |
| 28 S Dearborn St Unit A Indianapolis, IN | 3.0 | 1.0 | 1100 | $1,400 | $1.27 | 10d | 1 | 0.42mi |
| 49 S Lasalle St Unit 1540092P Indianapolis, IN | 3.0 | 2.0 | 1991 | $3,053 | $1.53 | 2d | 1 | 0.43mi |
| 20 N Gray St Indianapolis, IN | 3.0 | 2.0 | 1300 | $1,800 | $1.38 | 43d | 1 | 0.52mi |
| 39 N Tacoma Ave Indianapolis, IN | 3.0 | 1.0 | 1233 | $895 | $0.73 | 43d | 1 | 0.62mi |
| 253 N Gray St Indianapolis, IN | 3.0 | 1.5 | 1176 | $1,660 | $1.41 | 7d | 1 | 0.66mi |
| 238 Eastern Ave Indianapolis, IN | 3.0 | 2.0 | 1850 | $1,900 | $1.03 | 23d | 1 | 0.68mi |
| 41 Keystone Ave Indianapolis, IN | 3.0 | 2.5 | 1600 | $2,500 | $1.56 | 43d | 1 | 0.68mi |
| 43 Keystone Ave Indianapolis, IN | 3.0 | 2.5 | 1600 | $2,291 | $1.43 | 16d | 1 | 0.68mi |
| 420 Hamilton Ave Unit A Indianapolis, IN | 3.0 | 2.0 | 1350 | $1,550 | $1.15 | 43d | 1 | 0.69mi |
| 47 Keystone Ave Indianapolis, IN | 3.0 | 2.5 | 1600 | $2,500 | $1.56 | 43d | 1 | 0.69mi |
| 420 Hamilton Ave Unit B Indianapolis, IN | 3.0 | 2.0 | 1350 | $1,450 | $1.07 | 10d | 1 | 0.69mi |
| 909 Saint Peter St Indianapolis, IN | 3.0 | 2.0 | 1200 | $1,800 | $1.50 | 43d | 1 | 0.70mi |
| 228 N Tacoma Ave Indianapolis, IN | 3.0 | 1.0 | 1200 | $1,100 | $0.92 | 10d | 1 | 0.72mi |
| 151 Harlan St Unit A Indianapolis, IN | 3.0 | 2.0 | 1250 | $1,549 | $1.24 | 23d | 1 | 0.72mi |
| 210 N Keystone Ave Indianapolis, IN | 4.0 | 2.0 | 2024 | $2,200 | $1.09 | 7d | 1 | 0.74mi |
| 2218 Pleasant St Indianapolis, IN | 3.0 | 2.0 | 1376 | $2,499 | $1.82 | 23d | 1 | 0.75mi |
| 2015 E Maryland St Indianapolis, IN | 3.0 | 2.0 | 1250 | $1,495 | $1.20 | 43d | 1 | 0.76mi |
| 409 N Oakland Ave Unit 411 Indianapolis, IN | 3.0 | 2.0 | 1300 | $1,495 | $1.15 | 43d | 1 | 0.76mi |
| 408 N Dearborn St Indianapolis, IN | 3.0 | 2.5 | 1740 | $1,750 | $1.01 | 43d | 1 | 0.77mi |
| 2201 Pleasant St Indianapolis, IN | 4.0 | 3.0 | 2063 | $2,495 | $1.21 | 4d | 1 | 0.79mi |
| 430 N Dearborn St Indianapolis, IN | 3.0 | 1.0 | 1128 | $1,300 | $1.15 | 43d | 1 | 0.81mi |
| 3712 E Market St Indianapolis, IN | 3.0 | 1.0 | 1800 | $1,450 | $0.81 | 14d | 1 | 0.81mi |
| 33 N Sherman Dr Unit 33 Indianapolis, IN | 3.0 | 1.5 | 1288 | $1,500 | $1.16 | 7d | 1 | 0.82mi |
| 409 N Temple Ave Indianapolis, IN | 3.0 | 2.0 | 2106 | $1,650 | $0.78 | 43d | 1 | 0.82mi |
| 420 Eastern Ave Indianapolis, IN | 3.0 | 1.0 | 1900 | $1,325 | $0.70 | 43d | 1 | 0.82mi |
| 22 Hendricks Pl Unit 22 Indianapolis, IN | 3.0 | 1.5 | 1730 | $1,600 | $0.92 | 17d | 1 | 0.84mi |
| 2903 E Michigan St Indianapolis, IN | 3.0 | 2.0 | 1310 | $1,650 | $1.26 | 14d | 1 | 0.85mi |
| 17 E Parkview Ave Unit 19 Indianapolis, IN | 3.0 | 1.0 | 1530 | $1,650 | $1.08 | 43d | 1 | 0.86mi |
| 17 E Parkview Ave Unit 17 Indianapolis, IN | 3.0 | 1.5 | 1530 | $1,650 | $1.08 | 43d | 1 | 0.86mi |
| 22 Parkview Ave Indianapolis, IN | 3.0 | 1.5 | 1728 | $1,450 | $0.84 | 7d | 1 | 0.89mi |
| 2822 E Michigan St Indianapolis, IN | 3.0 | 2.0 | 1918 | $1,999 | $1.04 | 21d | 1 | 0.89mi |
| 44 Parkview Ave Indianapolis, IN | 3.0 | 2.0 | 1250 | $1,695 | $1.36 | 20d | 1 | 0.91mi |
| 17 N Randolph St Indianapolis, IN | 3.0 | 2.0 | 1822 | $2,075 | $1.14 | 4d | 1 | 0.91mi |
| 44 E Parkview Ave Unit B Indianapolis, IN | 3.0 | 2.0 | 1297 | $1,695 | $1.31 | 43d | 1 | 0.91mi |
| 44 E Parkview Ave Unit A Indianapolis, IN | 3.0 | 2.0 | 1296 | $1,695 | $1.31 | 23d | 1 | 0.91mi |
| 12 N Randolph St Indianapolis, IN | 3.0 | 1.0 | 1485 | $1,650 | $1.11 | 43d | 1 | 0.92mi |
Listing history 6 events
-
2026-03-25status Pending
-
2026-02-24status Active
-
2026-02-13status Pending
-
2026-02-09$85,000 Active
-
2007-05-17soldstatus $15,000 329-char remark
Show marketing remark (329 chars)
Corporate owned. Sold AS-IS. All offers must be submitted with a minimum of $1000 earnest money. Pre-approval letter or proof of funds must accompany all offers. All offers subject to sellers addendums and corporate app roval. Room sizes approximate. Four bedrooms. LOTS of space here. 2-CD garage. Could be good rental property.
-
2006-10-20$24,500 329-char remark
Show marketing remark (329 chars)
Corporate owned. Sold AS-IS. All offers must be submitted with a minimum of $1000 earnest money. Pre-approval letter or proof of funds must accompany all offers. All offers subject to sellers addendums and corporate app roval. Room sizes approximate. Four bedrooms. LOTS of space here. 2-CD garage. Could be good rental property.
ⓘ Source: listings_history table (triggers on properties + properties_extension) + one-shot
backfill from property_details.listing_events for pre-trigger history.
Tax reassessment forecast IN · Partial reset (capped growth)
- Current annual tax
- $1,622 · $135/mo
- Projected year-2 tax
- $1,622 · $135/mo
- Expected delta
- $0/yr ($0/mo · 0.0%)
ⓘ Screening estimate from a state-policy table — verify with the county assessor before closing.
Climate risk First Street
- Flood 1/10 Low FEMA zone X (unshaded) · 0% chance over 30 yrs
- Wildfire 1/10 Low
- Heat 4/10 Moderate 7 d/yr ≥101°F today · 19 d/yr by 30 yrs out
- Wind 2/10 Low 100% chance of damaging wind over 30 yrs
- Air quality 4/10 Moderate 5 unhealthy d/yr today · 7 by 30 yrs out
Nearby sold comps map
Loading sold comps map…
Walkable amenities ~0.75 mi
Loading nearby amenities…
Taxation est. · year 1
- Rental income
- $20,463
- − Mortgage interest
- −$4,761
- − Property taxes
- −$1,622
- − Insurance
- −$425
- − Repairs & maintenance
- −$1,637
- − Management
- −$1,637
- − Depreciation
- −$2,473
- Taxable income
- $7,908
- Est. tax owed @ 24.0%
- −$1,898
- After-tax cash flow
- $6,872/yr
For passive investors: Depreciation is non-cash, so a rental often shows a tax loss while cash-flowing — sheltering income. Rental losses are passive: they offset passive income freely, and up to $25,000/yr can offset ordinary (W-2) income if you actively participate and your MAGI is under $100k (phasing out to $0 by $150k); unused losses carry forward. On sale, claimed depreciation is recaptured at up to 25%, and gains may owe capital-gains tax (a 1031 exchange can defer both). Figures are a year-1 estimate at your 24.0% rate — not tax advice; consult a CPA.
Schools (NCES district)
- District
- Indianapolis Public Schools
- NCES district ID
- 1804770
- Math proficiency
- 14% ▼ -7.00%
- Reading proficiency
- 20% ▼ -3.00%
- Median HH income
- $32,034
- Composite
- 13.69/100
- National rank
- #9499
- State rank
- #286 of 301 in IN
Livability — Indianapolis city (balance)
No livability data for this city. (Only ~50 U.S. cities are tracked.)
Census & demographics
- Census place
- Indianapolis city (balance), IN
- County
- Marion County · 998,460 people
- City population
- 881,119
- Metro
- Indianapolis-Carmel-Anderson, IN
- Population (ZIP)
- 30,335
- Household income
- $49,195
- Rent vs Own
- Severe rent burden
- 1906.0
Population outlook (Marion County) Hauer SSP2
- Today (2025)
- 1,025,572 people
- By 2030
- 1,065,727 · +3.9%
- By 2040
- 1,141,577 · +11.3%
- By 2050
- 1,208,920 · +17.9%
- By 2075
- 1,367,288 · +33.3%
- By 2100
- 1,438,201 · +40.2%
Race, ethnicity, and origin ACS 2023
- Neighborhood character
- Diverse neighborhood (Simpson 0.63)
- Race & ethnicity
- White 53% Hispanic / Latino 23% Black 18% Two or more races 9%
- Hispanic origin (detail)
- Mexican 14% Puerto Rican 2%
- Common ancestry
- Slovak 2% Lithuanian 2% Italian 1%
- Foreign-born
- 9% · Canada
- Languages at home
- 81% English-only · Spanish 17%
Political lean MEDSL · Marion
- 2024 margin
- Strong D (+27.7) · D 63.0% · R 35.3% · Other 1.7%
- 2008→2024 swing
- -0.7pp no change · 2008: 28.4pp · 2024: 27.7pp
- All cycles
- 2024: D+27.7 2020: D+29.1 2016: D+22.8 2012: D+22.2 2008: D+28.4
Not yet ingested
- Civics
- —
Market trends
- HPI YoY
- ▼ -192.51%
- Current HPI
- 375.0969
- Rent YoY
- ▲ 7.31%
- Metro
- Indianapolis-Carmel-Anderson, IN
- State GDP YoY
- ▲ 2.90%
- F500 in state
- 18
Industry mix (Fortune 500 HQ in IN)
| Industry | F500 HQs | Revenue |
|---|---|---|
| Industrial Machinery | 2 | $37B |
|
||
| Healthcare | 1 | $177B |
|
||
| Pharmaceuticals | 1 | $45B |
|
||
| Metals / Steel | 1 | $18B |
|
||
| Agriculture | 1 | $17B |
|
||
| Packaging | 1 | $12B |
|
||
Price history
+246.9% since first listed6 events — show timeline
- 2026-03-25 Pending — MIBOR as Distributed by MLS Grid
- 2026-02-24 Relisted — MIBOR as Distributed by MLS Grid
- 2026-02-13 Pending — MIBOR as Distributed by MLS Grid
- 2026-02-09 Listed $85,000 MIBOR as Distributed by MLS Grid
- 2007-05-17 Sold (MLS) $15,000 MIBOR as Distributed by MLS Grid
- 2006-10-20 Listed $24,500 MIBOR as Distributed by MLS Grid
Property tax history
+4.7%/yrLatest (2025): $1,622 · +7.1% YoY. Source: county tax records.
Cash-flow waterfall
monthlySold comps — $/sqft
last 12 mo · ≤1 miLoading sold comps…