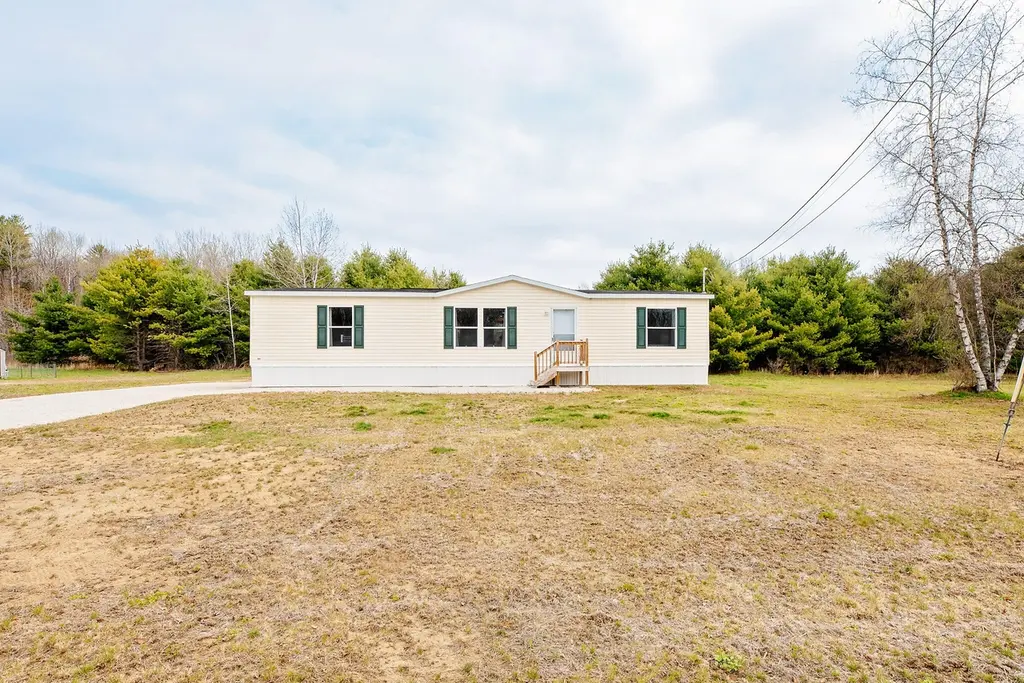
119 Rosewood Dr · Farmington, ME
Flood risk 1/10 · Minimal
- FEMA flood zone
- X
- Chance of flooding over 30 yrs
- 0.0%
- Est. flood insurance / yr
- $507 – $1,088
Fire risk 1/10 · Minimal
- Est. fire insurance / yr
- $669 – $1,243
Heat risk 2/10 · Minimal
- Hot days now (above 90°F)
- 7 days/yr
- Hot days in 30 yrs
- 15 days/yr
Wind risk 3/10 · Minor
- Chance of severe wind over 30 yrs
- 8.0%
Air-quality risk 2/10 · Minimal
- Unhealthy air days now
- 1 days/yr
- Unhealthy air days in 30 yrs
- 1 days/yr
Risk factors via First Street. Map © Google.
Why this score? — see what drove the A grade
The composite is a weighted blend of 9 inputs, each scored 0–100. Each bar is that input's sub-score; the figure is the points it added to the 100-point composite (weight × sub-score).
- Cash flow +28.5/30.0
- ARV discount +13.4/15.0
- 1% rule +10.0/10.0
- DSCR +10.0/10.0
- Appreciation +10.0/10.0
- Schools +6.7/10.0
- Livability +4.0/5.0
- Rent growth +2.5/5.0
- Condition / age +2.5/5.0
$149,900
🖨 Deal sheet 📄 Offer letter ✓ Due diligence
Listing remarks MLS
Brand New, 2023 Prime Doublewide. 56 x 28 Three Bedroom, 2 Bath. Model No: 2856H3P201 CHPR Serial #: 241-000-H-A001557A & B. Located in Cascade Leisure Park. Enjoy a single floor home in a quiet park.
Key facts
- Large center island
- Move-in-ready home
- Walk-in closet
Tags
Property features AI
Finance
- Other: Property subtype: Mobile Home
- Financial info: Land lease applies
- HOA & community: Has association with a $420 monthly fee; Located in zoned MHP (mobile home park)
Exterior
- Parking: On-site parking with 1–4 spaces; Gravel parking area; Common parking available
- Utilities: Public water; Public sewer; Electric service with circuit breakers; Electric water heater; Utilities are on
- Home design: Mobile home (double wide); Designed as a single-story residence; Home faces unspecified direction
- Construction: Built in 2023; Double wide mobile home; Wood frame with vinyl siding; Pitched shingle roof; Slab foundation
- Exterior features: Located in a mobile home park; Intown location near town, public beach, and golf course; Level site; Paved road access
Interior
- Kitchen: Eat-in kitchen with breakfast nook and island; Gas range; Refrigerator
- Bedrooms: Primary bedroom on the first floor with walk-in closet and en-suite full bath; Two additional first-floor bedrooms with closets
- Flooring: Laminate flooring; Vinyl flooring
- Bathrooms: Two full bathrooms
- Heating & cooling: Forced air heating
- Interior features: One-floor living with first-floor bedrooms; First-floor primary bedroom with full bath and suite; Bathtub and separate shower
- Laundry & utility: Washer and dryer included; Laundry located on the main level
Neighborhood map
What this means for you Summary
Snapshot
- This is a 3-bed/2.0-bath other listed at $150k.
Deal economics
- At list price, monthly cash flow is $490 ($6k/yr) — positive.
- The deal already cash-flows at list — no discount required.
- Meets the 1% rule at list price ($2k rent vs $150k).
- Recommended offer: $145k (3.0% below list) — sets the bar for market timing.
- Cap rate 10.2% vs local median 4.8% in Farmington — top-decile yield for the area; either an underpriced asset or a hidden risk that comps aren't pricing in. Stress-test before assuming the spread holds.
Location & tenants
- Location reads 80/100 on livability (#18 in ME, #1,653 nationally) — a professional / high-income tenant draw. Strengths: cost of living A+, health & safety A+, crime A-; Watch: schools D, employment D-.
- RSU 09 (rural): math 78% / reading 82% proficiency, ranked #88 of 112 in ME (top 79%) — strong family-tenant draw, lease renewals of 3-5y typical.
- Market conditions: 90 active listings in the ZIP; 1 comparable units currently listed for rent nearby; 164 units permitted in Franklin County in 2024 (0 in 5+ unit buildings).
Forward outlook
- In year one you build about $16k of equity ($1k loan paydown + $15k appreciation (10.0% local appreciation)).
- Franklin County population projected at -21% by 2050 — secular population decline; favor cash flow + early exit over multi-decade hold.
- At projected returns (10.0% appreciation + 3.0% rent growth), your $42k cash investment doubles in ~2 years — after that, you're playing with house money.
- By year 3, paydown + projected appreciation supports a ~$41k cash-out refi (75% LTV) — recoverable capital for the next deal without selling this one.
Negotiation context
- It's been on market 34 days — a 3% lower offer ($145k) is reasonable based on typical stale-listing flexibility.
- 3 sale attempts since 3y ago with the ask held roughly flat each time — persistent listings suggest the price (not the market) is what's stuck; bring a comps-based counter.
- Current owner paid $120k; 25% above their basis — modest negotiation headroom, anchor on the comps not their cost.
Questions for the listing agent
- It's been on market 34 days. Have you received any prior offers? Is the seller open to a 3% concession, seller financing, or rate buy-down credit?
- What does the HOA fee cover, when was the last increase, and are there any pending special assessments or reserve-fund shortfalls?
- Is there a deadline driving the sale (1031 exchange, divorce, estate, relocation)? That informs how much negotiation room exists.
- Schools are D-rated, which usually means shorter tenancies and higher turnover. Who's the typical renter profile here, and what's been the actual vacancy rate?
- What's the average days-on-market for RENTAL listings here right now (not sales)? A rising rental-DOM trend means longer vacancies and softer asking-rent achievability than the comps imply.
- What's the recent tenant-quality profile in this submarket — average credit score on applications, eviction rate, late-payment / NSF rate, and stable-employment percentage? A property-management company in the area should have these aggregated.
- How much new for-sale + rental construction is in the pipeline within 1–3 miles? Heavy new supply typically softens prices + rents 12–24 months out; constrained supply supports both.
Investment metrics
- 1% rule
- 1.67% ✓
- Cap rate
- 10.22%
- Cash-on-cash
- 14.01%
- DSCR
- 1.62
- GRM
- 5.0
CMA / ARV
- ARV (median comp)
- $172,518
- List price
- $149,900
- Delta
- -13.11%
- Verdict
- UNDERPRICED
- Comps
- 3 within 1.0 mi
Projected returns pro-forma
10.0% appreciation · 3.0% rent growth · sell at horizon
- IRR
- 34.7%
- Equity multiple
- 3.70×
- Total profit
- $113,158
- Equity at exit
- $135,042
- IRR
- 29.9%
- Equity multiple
- 8.37×
- Total profit
- $309,317
- Equity at exit
- $291,223
Cash invested: $41,972 (down + closing). Projections, not guarantees.
Landlord ↔ Tenant lean methodology
- Overall (STATE)
- 41 Moderately Tenant-Leaning
- State Maine
- 41 Moderately Tenant-Leaning · D+2
- County
- — inherits STATE
- City
- — inherits STATE
ZIP-level market 04938
- Home prices YoY
- 6.4%
- Active inventory
- 90
- Price-to-rent
- 5.0×
Monthly cashflow live
- Estimated rent
- $2,500 medium interval (Pro) →
- Mortgage (P&I)
- −$786
- Tax from tax record
- −$216 /mo · $2,598/yr
- Insurance
- −$62
- HOA
- −$420
- Vacancy / Maint / Mgmt
- −$525
- Net cashflow
- $490
Break-even live
UW: 25.0% down · 7.5% · 30yr · 1.5% tax · 5.0% vac · 8.0% maint · 8.0% mgmt
Financing live
Cash to close
- Down payment
- $37,475
- Closing costs
- $4,497
- Reserves months
- —
- Total cash needed
- —
Loan-product check · same deal, 3 products live
Conventional
25% down · 7.5% · 30yr
- Down + closing
- —
- Monthly P&I
- —
- Monthly cashflow
- —
- DSCR
- —
- Eligible?
- —
Personal DTI + credit; lowest rate.
DSCR
20% down · 8.5% · 30yr
- Down + closing
- —
- Monthly P&I
- —
- Monthly cashflow
- —
- DSCR
- —
- Eligible?
- —
No personal income docs; deal must DSCR.
Hard money
10% down · 12.0% · 12mo
- Down + closing
- —
- Monthly P&I
- —
- Monthly cashflow
- —
- DSCR
- —
- Eligible?
- —
Short-term bridge; refi at stabilization.
Rent comps 1 comps
| Address | Beds | Baths | Sqft | Rent | $/sqft | DOM | Units | Dist |
|---|---|---|---|---|---|---|---|---|
| 114 Perham St Unit 114 Perham St, 2nd Fl Farmington, ME | 2.0 | 1.0 | 1500 | $2,500 | $1.67 | 43d | 1 | 1.06mi |
HOA detail
- Monthly dues
- $420 · $5,040/yr
Listing history 22 events
-
2026-06-18days on market $149,900 Active 34 DOM
-
2026-06-17days on market $149,900 Active 33 DOM
-
2026-06-16days on market $149,900 Active 32 DOM
-
2026-06-15days on market $149,900 Active 31 DOM
-
2026-06-13days on market $149,900 Active 29 DOM
-
2026-06-12days on market $149,900 Active 28 DOM
-
2026-06-09days on market $149,900 Active 25 DOM
-
2026-06-09price $149,900 Active 24 DOM
-
2026-06-08days on market $155,000 Active 24 DOM
-
2026-06-07days on market $155,000 Active 23 DOM
-
2026-06-07days on market $155,000 Active 22 DOM
-
2026-06-04days on market $155,000 Active 19 DOM
-
2026-06-02days on market $155,000 Active 18 DOM
-
2026-06-01days on market $155,000 Active 17 DOM
-
2026-05-31days on market $155,000 Active 16 DOM
-
2026-05-31days on market $155,000 Active 15 DOM
-
2026-05-15status Active 1036-char remark
-
2026-05-14historical 1036-char remark
-
2026-05-14$155,000 Active 1036-char remark
-
2023-10-16soldstatus $120,000 Closed 204-char remark
Show marketing remark (204 chars)
Brand New, 2023 Prime Doublewide. 56 x 28 Three Bedroom, 2 Bath. Model No: 2856H3P201 CHPR Serial #: 241-000-H-A001557A & B. Located in Cascade Leisure Park. Enjoy a single floor home in a quiet park.
-
2023-09-19status Pending 204-char remark
Show marketing remark (204 chars)
Brand New, 2023 Prime Doublewide. 56 x 28 Three Bedroom, 2 Bath. Model No: 2856H3P201 CHPR Serial #: 241-000-H-A001557A & B. Located in Cascade Leisure Park. Enjoy a single floor home in a quiet park.
-
2023-08-14$125,000 Active 204-char remark
Show marketing remark (204 chars)
Brand New, 2023 Prime Doublewide. 56 x 28 Three Bedroom, 2 Bath. Model No: 2856H3P201 CHPR Serial #: 241-000-H-A001557A & B. Located in Cascade Leisure Park. Enjoy a single floor home in a quiet park.
ⓘ Source: listings_history table (triggers on properties + properties_extension) + one-shot
backfill from property_details.listing_events for pre-trigger history.
Tax reassessment forecast ME · Partial reset (capped growth)
- Current annual tax
- $2,598 · $216/mo
- Projected year-2 tax
- $2,598 · $216/mo
- Expected delta
- $0/yr ($0/mo · 0.0%)
ⓘ Screening estimate from a state-policy table — verify with the county assessor before closing.
Climate risk First Street
- Flood 1/10 Low FEMA zone X · 0% chance over 30 yrs
- Wildfire 1/10 Low
- Heat 2/10 Low 7 d/yr ≥90°F today · 15 d/yr by 30 yrs out
- Wind 3/10 Moderate 8% chance of damaging wind over 30 yrs
- Air quality 2/10 Low 1 unhealthy d/yr today · 1 by 30 yrs out
Nearby sold comps map
Loading sold comps map…
Walkable amenities ~0.75 mi
Loading nearby amenities…
Taxation est. · year 1
- Rental income
- $30,000
- − Mortgage interest
- −$8,397
- − Property taxes
- −$2,598
- − Insurance
- −$750
- − Repairs & maintenance
- −$2,400
- − Management
- −$2,400
- − HOA
- −$5,040
- − Depreciation
- −$4,361
- Taxable income
- $4,055
- Est. tax owed @ 24.0%
- −$973
- After-tax cash flow
- $4,906/yr
For passive investors: Depreciation is non-cash, so a rental often shows a tax loss while cash-flowing — sheltering income. Rental losses are passive: they offset passive income freely, and up to $25,000/yr can offset ordinary (W-2) income if you actively participate and your MAGI is under $100k (phasing out to $0 by $150k); unused losses carry forward. On sale, claimed depreciation is recaptured at up to 25%, and gains may owe capital-gains tax (a 1031 exchange can defer both). Figures are a year-1 estimate at your 24.0% rate — not tax advice; consult a CPA.
Schools (NCES district)
- District
- RSU 09
- NCES district ID
- 2314809
- Math proficiency
- 78% ▲ 48.00%
- Reading proficiency
- 82% ▲ 31.00%
- Median HH income
- $40,202
- Composite
- 66.71/100
- National rank
- #409
- State rank
- #88 of 112 in ME
Livability — Farmington
- Score
- 80/100
- State rank
- #18
- US rank
- #1653
Category grades
Schools grade is shown separately in the Schools card above.
Census & demographics
- Census place
- Farmington, ME
- Population (ZIP)
- 10,368
Population outlook (Franklin County) Hauer SSP2
- Today (2025)
- 28,948 people
- By 2030
- 27,889 · -3.7%
- By 2040
- 25,275 · -12.7%
- By 2050
- 22,770 · -21.3%
- By 2075
- 18,980 · -34.4%
- By 2100
- 16,816 · -41.9%
Race, ethnicity, and origin ACS 2023
- Neighborhood character
- Predominantly White (93%)
- Race & ethnicity
- White 93% Two or more races 4% Hispanic / Latino 2%
- Common ancestry
- Lithuanian 11% Italian 3% Slovak 2%
- Foreign-born
- 4% · Canada
- Languages at home
- 98% English-only · French/Haitian/Cajun 1%
Political lean MEDSL · Franklin
- 2024 margin
- Lean R (+8.2) · D 44.8% · R 53.0% · Other 2.2%
- 2008→2024 swing
- -28.5pp toward R · 2008: 20.3pp · 2024: -8.2pp
- All cycles
- 2024: R+8.2 2020: R+3.9 2016: R+5.5 2012: D+18.5 2008: D+20.3
Not yet ingested
- Civics
- —
Market trends
- HPI YoY
- ▲ 19.53%
- Current HPI
- 325.7666
- Rent YoY
- —
- Metro
- —
- State GDP YoY
- —
- F500 in state
- 0
Price history
+19.9% since first listed7 events — show timeline
- 2026-06-08 Price Changed $149,900 MREIS
- 2026-05-15 Relisted — MREIS
- 2026-05-14 Delisted — MREIS
- 2026-05-14 Listed $155,000 MREIS
- 2023-10-16 Sold (MLS) $120,000 MREIS
- 2023-09-19 Pending — MREIS
- 2023-08-14 Listed $125,000 MREIS
Property tax history
+21.6%/yrLatest (2025): $2,598 · +7.8% YoY. Source: county tax records.
Cash-flow waterfall
monthlySold comps — $/sqft
last 12 mo · ≤1 miLoading sold comps…