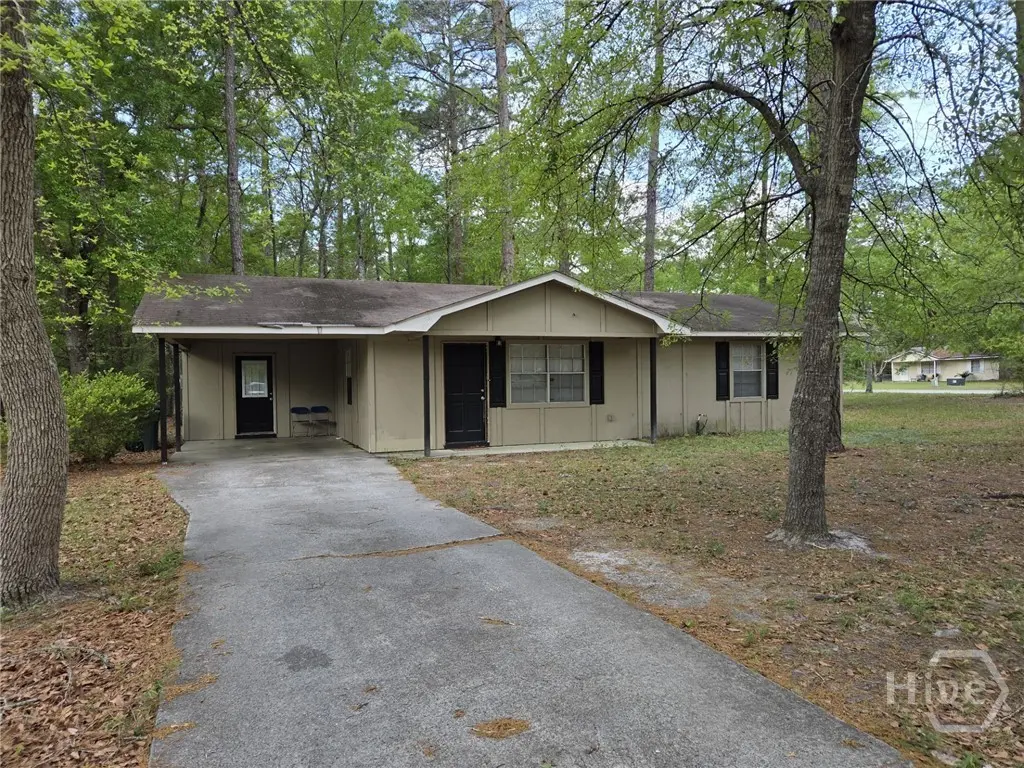
219 Surrey Rd · Hinesville, GA
Flood risk 1/10 · Minimal
- FEMA flood zone
- X (unshaded)
- Chance of flooding over 30 yrs
- 0.0%
- Est. flood insurance / yr
- $507 – $1,088
Fire risk 4/10 · Minor
- Est. fire insurance / yr
- $963 – $1,789
Heat risk 9/10 · Severe
- Hot days now (above 111°F)
- 7 days/yr
- Hot days in 30 yrs
- 18 days/yr
Wind risk 8/10 · Major
- Chance of severe wind over 30 yrs
- 99.0%
Air-quality risk 2/10 · Minimal
- Unhealthy air days now
- 2 days/yr
- Unhealthy air days in 30 yrs
- 2 days/yr
Risk factors via First Street. Map © Google.
Why this score? — see what drove the C grade
The composite is a weighted blend of 9 inputs, each scored 0–100. Each bar is that input's sub-score; the figure is the points it added to the 100-point composite (weight × sub-score).
- Cash flow +22.6/30.0
- ARV discount +9.7/15.0
- DSCR +7.3/10.0
- 1% rule +6.4/10.0
- Rent growth +3.9/5.0
- Livability +3.7/5.0
- Condition / age +2.5/5.0
- Schools +2.0/10.0
- Appreciation +0.0/10.0
$159,000
🖨 Deal sheet (PDF) 📄 Offer letter ✓ Due diligence
Listing remarks MLS
Here is your chance to own a home on a large, corner lot home in the heart Hinesville, Ga. Rather you are a first time homeowner or an investor, this home could be for you. This property features 3 bedrooms, a spacious living room, dining area, eat in kitchen, large laundry room and a carport with a side entrance to the property. The home is located within minutes of shopping & schools. You may also qualify for Georgia Dream Financing. Call today for a personal tour!
Key facts
- 0.47 acre lot
- Garage
- Built 1977
Neighborhood map
What this means for you Summary
Snapshot
- This is a 3-bed/1.0-bath single-family listed at $159k.
Deal economics
- At list price, monthly cash flow is $272 ($3k/yr) — positive.
- The deal already cash-flows at list — no discount required.
- Meets the 1% rule at list price ($2k rent vs $159k).
- Recommended offer: $149k (6.0% below list) — sets the bar for market timing.
- Cap rate 8.3% vs local median 5.2% in Hinesville — top-decile yield for the area; either an underpriced asset or a hidden risk that comps aren't pricing in. Stress-test before assuming the spread holds.
Location & tenants
- Location reads 73/100 on livability (#51 in GA) — a middle-class / working-renter tenant base. Strengths: cost of living A+, housing A+, health & safety A+; Watch: schools D+, commute D+, crime F.
- Liberty County (urban): math 19% / reading 28% proficiency, ranked #133 of 174 in GA (top 76%) — low school quality limits family demand, transient renter base, plan for 1-2y turnover.
- Market conditions: Rents rising fast (+5.4%/yr); 612 active listings in the ZIP; 9 comparable units currently listed for rent nearby; rentals lingering (median 44d on market — plan ~5-8 weeks vacancy on turnover, expect pricing pressure); 100% of comp listings sitting > 30 days — soft ceiling on asking rent; 471 units permitted in Liberty County in 2024 (0 in 5+ unit buildings).
- This rent runs 36% of the median local income ($60k/yr) — at the standard rent-burdened threshold; future hikes will face affordability resistance.
Forward outlook
- Local home prices are declining (-3.0%/yr); year-one equity from $1k of loan paydown is wiped out by about $5k of value loss. Plan a longer hold.
- Liberty County population projected to shrink 8% by 2050 — rents likely to lag national; underwrite the cash flow, not the appreciation.
- At projected returns (-3.0% appreciation + 5.4% rent growth), your $45k cash investment doubles in ~10 years — after that, you're playing with house money.
Negotiation context
- It's been on market 66 days — a 6% lower offer ($149k) is reasonable based on typical stale-listing flexibility.
- 8 sale attempts since 10y ago with the ask held roughly flat each time — persistent listings suggest the price (not the market) is what's stuck; bring a comps-based counter.
- Current owner paid $68k; list at $159k implies a 134% gain — meaningful room to come down on a strong offer.
Risks & watch-outs
- Climate carrying-cost: severe wind risk, 99% chance of damaging wind over 30y; extreme-heat days projected 7→18/yr by 2055 (HVAC capex compounding) — expect insurance premiums to compound above CPI over the hold.
Questions for the listing agent
- It's been on market 66 days. Have you received any prior offers? Is the seller open to a 6% concession, seller financing, or rate buy-down credit?
- Built in 1977 — when were the roof, HVAC, electrical panel, plumbing, and water heater last replaced?
- Why hasn't it sold? Are there any deal-killer items the seller is aware of (foundation, flood, title, zoning, code violations)?
- Is there a deadline driving the sale (1031 exchange, divorce, estate, relocation)? That informs how much negotiation room exists.
- Schools are D-rated, which usually means shorter tenancies and higher turnover. Who's the typical renter profile here, and what's been the actual vacancy rate?
- Crime grade is F in this area — have there been break-ins, vandalism, or insurance claims at this property in the last 3 years? What carrier currently insures it and at what premium?
- What's the average days-on-market for RENTAL listings here right now (not sales)? A rising rental-DOM trend means longer vacancies and softer asking-rent achievability than the comps imply.
- What's the recent tenant-quality profile in this submarket — average credit score on applications, eviction rate, late-payment / NSF rate, and stable-employment percentage? A property-management company in the area should have these aggregated.
- How much new for-sale + rental construction is in the pipeline within 1–3 miles? Heavy new supply typically softens prices + rents 12–24 months out; constrained supply supports both.
Investment metrics
- 1% rule
- 1.14% ✓
- Cap rate
- 8.35%
- Cash-on-cash
- 7.33%
- DSCR
- 1.33
- GRM
- 7.3
CMA / ARV
- ARV (median comp)
- $167,091
- List price
- $159,000
- Delta
- -4.84%
- Verdict
- FAIR
- Comps
- 20 within 1.0 mi
Show comp detail 6 sales within ~0.75 mi
| Address | Dist | Beds/Ba | Sqft | Sold | Price | $/sf | Match |
|---|---|---|---|---|---|---|---|
| 478 Dykes St | 0.37mi | 3/1.0 | 1,008 (+5%) | 20mo | $166,800 | $165 | 58 |
| 607 Scott St | 0.62mi | 2/1.0 (-1) | 975 (+2%) | 15mo | $160,000 | $164 | 51 |
| 621 2nd St | 0.33mi | 3/2.0 | 1,100 (+15%) | 12mo | $209,000 | $190 | 47 |
| 641 2nd St | 0.40mi | 3/2.0 | 1,100 (+15%) | 11mo | $204,500 | $186 | 44 |
| 620 Scott St | 0.60mi | 2/2.0 (-1) | 1,057 (+10%) | 12mo | $118,000 | $112 | 36 |
| 657 Windhaven Dr | 0.71mi | 3/2.0 | 1,078 (+12%) | 9mo | $168,000 | $156 | 35 |
Match score weights: distance 35% · size 25% · config 20% · recency 20%. Top-matched comps best support the ARV.
Projected returns pro-forma
-3.0% appreciation · 5.41% rent growth · sell at horizon
- IRR
- -2.3%
- Equity multiple
- 0.91×
- Total profit
- $-3,882
- Equity at exit
- $23,707
- IRR
- 10.0%
- Equity multiple
- 1.87×
- Total profit
- $38,556
- Equity at exit
- $13,747
Cash invested: $44,520 (down + closing). Projections, not guarantees.
Landlord ↔ Tenant lean methodology
- Overall (STATE)
- 90 Strongly Landlord-Friendly
- State Georgia
- 90 Strongly Landlord-Friendly · R+3
- County
- — inherits STATE
- City
- — inherits STATE
ZIP-level market 31313
- Home prices YoY
- -27.1%
- Rents YoY
- 5.4%
- Active inventory
- 612
- Price-to-rent
- 7.3×
Monthly cashflow live
- Estimated rent
- $1,809 high interval (Pro) →
- Mortgage (P&I)
- −$834
- Tax from tax record
- −$257 /mo · $3,086/yr
- Insurance
- −$66
- HOA
- −$0
- Vacancy / Maint / Mgmt
- −$380
- Net cashflow
- $272
Break-even live
Sensitivity live
| Price | -10% $362 | -5% $317 | +0% $272 | +5% $227 | +10% $182 |
|---|---|---|---|---|---|
| Rent | -10% $129 | -5% $201 | +0% $272 | +5% $344 | +10% $415 |
| Rate | -1.0pp $352 | -0.5pp $312 | base $272 | +0.5pp $231 | +1.0pp $189 |
UW: 25.0% down · 7.5% · 30yr · 1.5% tax · 5.0% vac · 8.0% maint · 8.0% mgmt
Financing live
Cash to close
- Down payment
- $39,750
- Closing costs
- $4,770
- Reserves months
- —
- Total cash needed
- —
Loan-product check · same deal, 3 products live
Conventional
25% down · 7.5% · 30yr
- Down + closing
- —
- Monthly P&I
- —
- Monthly cashflow
- —
- DSCR
- —
- Eligible?
- —
Personal DTI + credit; lowest rate.
DSCR
20% down · 8.5% · 30yr
- Down + closing
- —
- Monthly P&I
- —
- Monthly cashflow
- —
- DSCR
- —
- Eligible?
- —
No personal income docs; deal must DSCR.
Hard money
10% down · 12.0% · 12mo
- Down + closing
- —
- Monthly P&I
- —
- Monthly cashflow
- —
- DSCR
- —
- Eligible?
- —
Short-term bridge; refi at stabilization.
Rent comps 9 comps
| Address | Beds | Baths | Sqft | Rent | $/sqft | DOM | Units | Dist |
|---|---|---|---|---|---|---|---|---|
| 635 Maxwell St Hinesville, GA | 3.0 | 1.0 | 950 | $1,700 | $1.79 | 44d | 1 | 0.21mi |
| 205 Bagley Ave Unit B Hinesville, GA | 3.0 | 2.0 | 1071 | $1,850 | $1.73 | 44d | 1 | 0.78mi |
| 134 Pointe South Dr Hinesville, GA | 2.0 | 1.0 | 840 | $1,195 | $1.42 | 44d | 1 | 0.99mi |
| 131 Pointe South Dr Hinesville, GA | 2.0 | 1.0 | 960 | $1,950 | $2.03 | 44d | 1 | 1.02mi |
| 822 Lost Grove Ln Hinesville, GA | 3.0 | 2.0 | 1080 | $1,650 | $1.53 | 45d | 1 | 1.18mi |
| 910 Brett Dr Hinesville, GA | 2.0–3.0 | 2.0 | 957 | $1,600 | $1.67 | 45d | 3 | 1.20mi |
| 910 Brett Dr Hinesville, GA | 2.0–3.0 | 2.0 | 957 | $1,600 | $1.67 | 44d | 4 | 1.20mi |
| 1303 Veterans Pkwy Hinesville, GA | 1.0–3.0 | 1.0–2.0 | 1048 | $1,750 | $1.67 | 44d | 8 | 1.24mi |
| 1012 White Cir Hinesville, GA | 3.0 | 1.0 | 1050 | $1,300 | $1.24 | 44d | 1 | 1.27mi |
Listing history 32 events
-
2026-06-19days on market $159,000 Active 66 DOM
-
2026-06-18days on market $159,000 Active 65 DOM
-
2026-06-17days on market $159,000 Active 64 DOM
-
2026-06-16days on market $159,000 Active 63 DOM
-
2026-06-15days on market $159,000 Active 62 DOM
-
2026-06-14days on market $159,000 Active 60 DOM
-
2026-06-13days on market $159,000 Active 59 DOM
-
2026-06-10days on market $159,000 Active 57 DOM
-
2026-06-09days on market $159,000 Active 56 DOM
-
2026-06-08days on market $159,000 Active 55 DOM
-
2026-06-07days on market $159,000 Active 54 DOM
-
2026-06-05days on market $159,000 Active 51 DOM
-
2026-06-03days on market $159,000 Active 50 DOM
-
2026-06-02days on market $159,000 Active 49 DOM
-
2026-06-01days on market $159,000 Active 48 DOM
-
2026-05-31days on market $159,000 Active 47 DOM
-
2026-05-30days on market $159,000 Active 46 DOM
-
2026-04-29price $159,000 477-char remark
Show marketing remark (431 chars)
Here is your chance to own a home on a large, corner lot in the heart Hinesville, Ga. This property is perfect for investors. This property features 3 bedrooms, a spacious living room, dining area, eat in kitchen, large laundry room and a carport with a side entrance to the property. The home is located within minutes of shopping & schools. You may also qualify for Georgia Dream Financing. Call today for a personal tour!
-
2026-04-29price $159,000 431-char remark
Show marketing remark (431 chars)
Here is your chance to own a home on a large, corner lot in the heart Hinesville, Ga. This property is perfect for investors. This property features 3 bedrooms, a spacious living room, dining area, eat in kitchen, large laundry room and a carport with a side entrance to the property. The home is located within minutes of shopping & schools. You may also qualify for Georgia Dream Financing. Call today for a personal tour!
-
2026-04-14$165,000 Active 477-char remark
Show marketing remark (431 chars)
Here is your chance to own a home on a large, corner lot in the heart Hinesville, Ga. This property is perfect for investors. This property features 3 bedrooms, a spacious living room, dining area, eat in kitchen, large laundry room and a carport with a side entrance to the property. The home is located within minutes of shopping & schools. You may also qualify for Georgia Dream Financing. Call today for a personal tour!
-
2026-04-14$165,000 Active 431-char remark
Show marketing remark (431 chars)
Here is your chance to own a home on a large, corner lot in the heart Hinesville, Ga. This property is perfect for investors. This property features 3 bedrooms, a spacious living room, dining area, eat in kitchen, large laundry room and a carport with a side entrance to the property. The home is located within minutes of shopping & schools. You may also qualify for Georgia Dream Financing. Call today for a personal tour!
-
2026-04-10$165,000 New
-
2025-12-07historical $1,300
-
2025-11-07$1,300
-
2024-11-24historical $1,300
-
2024-10-10$1,300
-
2024-03-20historical $1,300
-
2024-03-13$1,300
-
2018-03-05soldstatus $68,000
-
2018-02-23soldstatus $68,000
-
2016-10-04$69,900
-
2016-10-04$69,900
ⓘ Source: listings_history table (triggers on properties + properties_extension) + one-shot
backfill from property_details.listing_events for pre-trigger history.
Tax reassessment forecast GA · Resets to sale price
- Current annual tax
- $3,086 · $257/mo
- Projected year-2 tax
- $3,086 · $257/mo
- Expected delta
- $0/yr ($0/mo · 0.0%)
ⓘ Screening estimate from a state-policy table — verify with the county assessor before closing.
Climate risk First Street
- Flood 1/10 Low FEMA zone X (unshaded) · 0% chance over 30 yrs
- Wildfire 4/10 Moderate
- Heat 9/10 Extreme 7 d/yr ≥111°F today · 18 d/yr by 30 yrs out
- Wind 8/10 Severe 99% chance of damaging wind over 30 yrs
- Air quality 2/10 Low 2 unhealthy d/yr today · 2 by 30 yrs out
Nearby sold comps map
Loading sold comps map…
Walkable amenities ~0.75 mi
Loading nearby amenities…
Taxation est. · year 1
- Rental income
- $21,711
- − Mortgage interest
- −$8,906
- − Property taxes
- −$3,086
- − Insurance
- −$795
- − Repairs & maintenance
- −$1,737
- − Management
- −$1,737
- − Depreciation
- −$4,625
- Taxable income
- $824
- Est. tax owed @ 24.0%
- −$198
- After-tax cash flow
- $3,067/yr
For passive investors: Depreciation is non-cash, so a rental often shows a tax loss while cash-flowing — sheltering income. Rental losses are passive: they offset passive income freely, and up to $25,000/yr can offset ordinary (W-2) income if you actively participate and your MAGI is under $100k (phasing out to $0 by $150k); unused losses carry forward. On sale, claimed depreciation is recaptured at up to 25%, and gains may owe capital-gains tax (a 1031 exchange can defer both). Figures are a year-1 estimate at your 24.0% rate — not tax advice; consult a CPA.
Schools (NCES district)
- District
- Liberty County
- NCES district ID
- 1303300
- Math proficiency
- 19% ▼ -16.00%
- Reading proficiency
- 28% ▼ -13.00%
- Median HH income
- $43,911
- Composite
- 20.2/100
- National rank
- #8630
- State rank
- #133 of 174 in GA
Livability — Hinesville
- Score
- 73/100
- State rank
- #51
- US rank
- #5200
Category grades
Schools grade is shown separately in the Schools card above.
Census & demographics
- Census place
- Hinesville, GA
- County
- Liberty County · 58,565 people
- City population
- 42,838
- Metro
- Hinesville, GA
- Population (ZIP)
- 42,838
- Household income
- $60,233
- Rent vs Own
- Severe rent burden
- 1693.0
Population outlook (Liberty County) Hauer SSP2
- Today (2025)
- 58,689 people
- By 2030
- 57,670 · -1.7%
- By 2040
- 55,750 · -5.0%
- By 2050
- 54,155 · -7.7%
- By 2075
- 58,947 · +0.4%
- By 2100
- 66,919 · +14.0%
Race, ethnicity, and origin ACS 2023
- Neighborhood character
- Diverse neighborhood (Simpson 0.67)
- Race & ethnicity
- Black 47% White 31% Hispanic / Latino 13% Two or more races 11% Asian 2%
- Hispanic origin (detail)
- Mexican 4% Puerto Rican 7%
- Common ancestry
- Slovak 1% Italian 1% Lithuanian 1%
- Foreign-born
- 7% · Canada, South Korea
- Languages at home
- 86% English-only · Spanish 7% Other Indo-European 2% German/W. Germanic 1%
Political lean MEDSL · Liberty
- 2024 margin
- D (+17.4) · D 58.5% · R 41.0%
- 2008→2024 swing
- -10.9pp toward R · 2008: 28.4pp · 2024: 17.4pp
- All cycles
- 2024: D+17.4 2020: D+24.1 2016: D+21.2 2012: D+30.2 2008: D+28.4
Not yet ingested
- Civics
- —
Market trends
- HPI YoY
- ▼ -77.50%
- Current HPI
- 208.0927
- Rent YoY
- ▲ 5.41%
- Metro
- Hinesville, GA
- State GDP YoY
- ▲ 2.66%
- F500 in state
- 28
Industry mix (Fortune 500 HQ in GA)
| Industry | F500 HQs | Revenue |
|---|---|---|
| Paper / Packaging | 2 | $29B |
|
||
| Retail | 1 | $160B |
|
||
| Transportation / Logistics | 1 | $91B |
|
||
| Airlines | 1 | $62B |
|
||
| Consumer Goods | 1 | $47B |
|
||
| Utilities | 1 | $25B |
|
||
Price history
+127.5% since first listed15 events — show timeline
- 2026-04-29 Price Changed $159,000 Hive MLS
- 2026-04-29 Price Changed $159,000 HABR
- 2026-04-14 Listed $165,000 HABR
- 2026-04-14 Listed $165,000 Hive MLS
- 2026-04-10 Listed $165,000 GAMLS
- 2025-12-07 Rental Removed $1,300 APPFOLIO
- 2025-11-07 Listed for Rent $1,300 APPFOLIO
- 2024-11-24 Rental Removed $1,300 APPFOLIO
- 2024-10-10 Listed for Rent $1,300 APPFOLIO
- 2024-03-20 Rental Removed $1,300 APPFOLIO
- 2024-03-13 Listed for Rent $1,300 APPFOLIO
- 2018-03-05 Sold (Public Records) $68,000 Public Records
- 2018-02-23 Sold (MLS) $68,000 Hive MLS
- 2016-10-04 Listed $69,900 Hive MLS
- 2016-10-04 Listed $69,900 Hive MLS
Property tax history
+9.7%/yrLatest (2025): $3,086 · +1.3% YoY. Source: county tax records.
Cash-flow waterfall
monthlySold comps — $/sqft
last 12 mo · ≤1 miLoading sold comps…