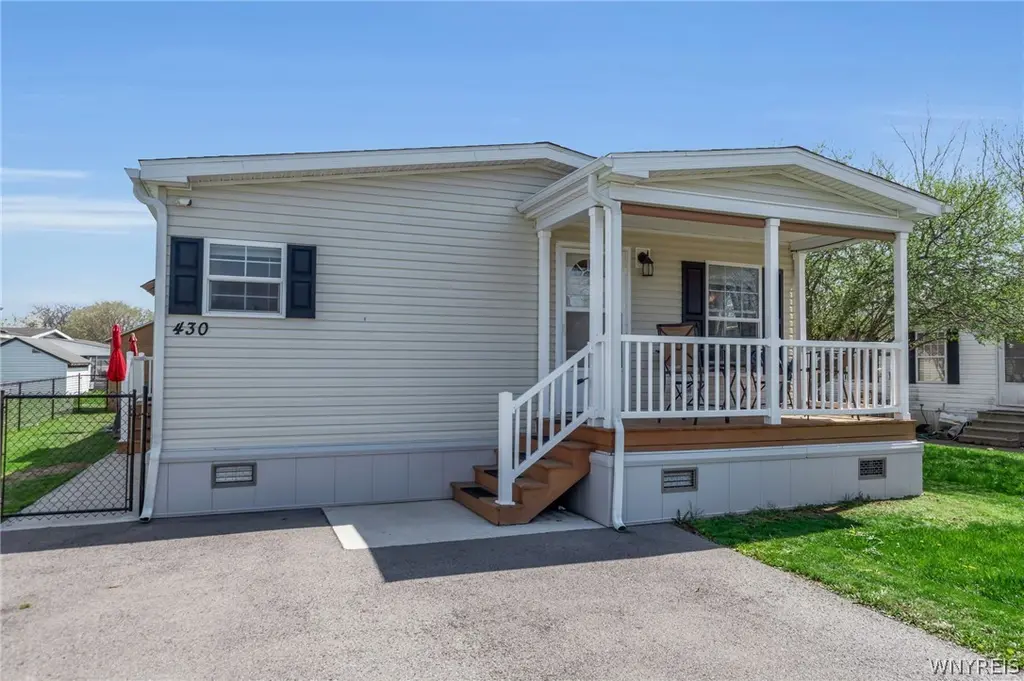
430 Chestnut Rd · South Lockport, NY
Flood risk 6/10 · Moderate
- FEMA flood zone
- X (unshaded)
- Chance of flooding over 30 yrs
- 0.72%
- Est. flood insurance / yr
- $507 – $1,088
Fire risk 3/10 · Minor
- Est. fire insurance / yr
- $691 – $1,283
Heat risk 2/10 · Minimal
- Hot days now (above 94°F)
- 7 days/yr
- Hot days in 30 yrs
- 15 days/yr
Wind risk 1/10 · Minimal
- Chance of severe wind over 30 yrs
- —
Air-quality risk 2/10 · Minimal
- Unhealthy air days now
- 2 days/yr
- Unhealthy air days in 30 yrs
- 2 days/yr
Risk factors via First Street. Map © Google.
Why this score? — see what drove the C+ grade
The composite is a weighted blend of 9 inputs, each scored 0–100. Each bar is that input's sub-score; the figure is the points it added to the 100-point composite (weight × sub-score).
- Cash flow +26.1/30.0
- DSCR +8.8/10.0
- ARV discount +7.5/15.0
- 1% rule +6.9/10.0
- Schools +3.9/10.0
- Condition / age +3.8/5.0
- Rent growth +3.4/5.0
- Livability +3.3/5.0
- Appreciation +0.0/10.0
$124,900
🖨 Deal sheet 📄 Offer letter ✓ Due diligence
Listing remarks
STUNNING 2023 built home loaded with tasteful features throughout! This beautifully appointed Eagle River offers 3 bedrooms, 2 full baths, and a bright, open layout ideal for modern living. Step inside to an attractive, open-concept eat-in kitchen with a large island/breakfast bar, recessed lighting, and sleek black appliances flowing seamlessly into the spacious living area. Deluxe crown molding throughout! The primary suite is privately tucked away in the rear with a full bathroom and spacious walk-in closet. Two generously sized bedrooms and an additional full bath at the front offer flexibility and comfort. Enjoy a fully fenced in yard, custom Amish built 10x10 shed for added storage wi
Key facts
- Spacious living area
- Walk-in closet
- Primary suite
Tags
Property features AI
Finance
- Financial info: Land lease amount: $855
- HOA & community: Monthly land lease
Exterior
- Parking: No garage
- Utilities: Electricity connected; Public water connected; Sewer connected
- Home design: Single-story (1 story); Double-wide mobile home (Eagle River model); Existing/resale property; Faces city street
- Construction: Vinyl siding; Shingle roof; Block foundation
- Exterior features: Blacktop driveway; Fully fenced yard; Covered porch; Shed(s)/storage
Interior
- Kitchen: Dishwasher; Gas oven; Gas range; Microwave; Refrigerator
- Bedrooms: 3 main-level bedrooms
- Flooring: Carpet; Laminate; Varies
- Bathrooms: 2 full bathrooms (both on the main level)
- Heating & cooling: Gas forced-air heating; Central air conditioning
- Interior features: Ceiling fans; Eat-in kitchen; Kitchen island; Kitchen-family room combo; Primary suite with bath in primary bedroom; Main level primary/bedroom on main level
- Laundry & utility: Main-level laundry
Neighborhood map
What this means for you Summary
Snapshot
- This is a 3-bed/2.0-bath single-family listed at $125k. Condition is rated good.
Deal economics
- At list price, monthly cash flow is $315 ($4k/yr) — positive.
- The deal already cash-flows at list — no discount required.
- Meets the 1% rule at list price ($1k rent vs $125k).
- Recommended offer: $121k (3.0% below list) — sets the bar for market timing.
- Cap rate 9.3% vs local median 1.5% in South Lockport — top-decile yield for the area; either an underpriced asset or a hidden risk that comps aren't pricing in. Stress-test before assuming the spread holds.
Location & tenants
- Location reads 66/100 on livability (#633 in NY) — a middle-class / working-renter tenant base. Strengths: cost of living A+, health & safety A+; Watch: employment D+, schools F, crime F.
- Lockport City School District (town): math 44% / reading 49% proficiency, ranked #452 of 590 in NY (top 77%) — families likely to look elsewhere, expect single-tenant / working-renter base with shorter leases.
- Market conditions: Rents rising (+3.7%/yr); 357 active listings in the ZIP; 1 comparable units currently listed for rent nearby; solid renter incomes; 167 units permitted in Niagara County in 2024 (0 in 5+ unit buildings).
Forward outlook
- Local home prices are declining (-3.0%/yr); year-one equity from $864 of loan paydown is wiped out by about $4k of value loss. Plan a longer hold.
- Niagara County population projected at -19% by 2050 — secular population decline; favor cash flow + early exit over multi-decade hold.
- At projected returns (-3.0% appreciation + 3.7% rent growth), your $35k cash investment doubles in ~10 years — after that, you're playing with house money.
Negotiation context
- It's been on market 41 days — a 3% lower offer ($121k) is reasonable based on typical stale-listing flexibility.
Risks & watch-outs
- Climate carrying-cost: major flood risk — expect insurance premiums to compound above CPI over the hold.
Questions for the listing agent
- It's been on market 41 days. Have you received any prior offers? Is the seller open to a 3% concession, seller financing, or rate buy-down credit?
- Is there a deadline driving the sale (1031 exchange, divorce, estate, relocation)? That informs how much negotiation room exists.
- Schools are F-rated, which usually means shorter tenancies and higher turnover. Who's the typical renter profile here, and what's been the actual vacancy rate?
- Crime grade is F in this area — have there been break-ins, vandalism, or insurance claims at this property in the last 3 years? What carrier currently insures it and at what premium?
- What's the average days-on-market for RENTAL listings here right now (not sales)? A rising rental-DOM trend means longer vacancies and softer asking-rent achievability than the comps imply.
- What's the recent tenant-quality profile in this submarket — average credit score on applications, eviction rate, late-payment / NSF rate, and stable-employment percentage? A property-management company in the area should have these aggregated.
- How much new for-sale + rental construction is in the pipeline within 1–3 miles? Heavy new supply typically softens prices + rents 12–24 months out; constrained supply supports both.
Investment metrics
- 1% rule
- 1.19% ✓
- Cap rate
- 9.32%
- Cash-on-cash
- 10.81%
- DSCR
- 1.48
- GRM
- 7.0
CMA / ARV
- ARV (on-the-fly)
- $295,568
- Comps found
- 5
Show comp detail 5 sales within ~0.75 mi
| Address | Dist | Beds/Ba | Sqft | Sold | Price | $/sf | Match |
|---|---|---|---|---|---|---|---|
| 6408 Locust Street Ext | 0.56mi | 3/2.0 | 1,419 (-2%) | 12mo | $400,000 | $282 | 60 |
| 6406 Locust Street Ext | 0.54mi | 3/2.0 | 1,480 (+2%) | 23mo | $300,000 | $203 | 53 |
| 6170 Old Beattie Rd | 0.49mi | 3/1.5 | 1,641 (+13%) | 4mo | $249,900 | $152 | 51 |
| 6344 Green Valley Ln | 0.74mi | 3/1.5 | 1,560 (+7%) | 2mo | $323,000 | $207 | 50 |
| 1163 Timberwood Ct | 0.59mi | 3/2.0 | 1,283 (-12%) | 18mo | $69,900 | $54 | 38 |
Match score weights: distance 35% · size 25% · config 20% · recency 20%. Top-matched comps best support the ARV.
Projected returns pro-forma
-3.0% appreciation · 3.67% rent growth · sell at horizon
- IRR
- 0.6%
- Equity multiple
- 1.02×
- Total profit
- $859
- Equity at exit
- $18,623
- IRR
- 11.0%
- Equity multiple
- 1.88×
- Total profit
- $30,885
- Equity at exit
- $10,799
Cash invested: $34,972 (down + closing). Projections, not guarantees.
Landlord ↔ Tenant lean methodology
- Overall (STATE)
- 15 Strongly Tenant-Friendly
- State New York
- 15 Strongly Tenant-Friendly · D+10
- County
- — inherits STATE
- City
- — inherits STATE
ZIP-level market 14094
- Rents YoY
- 3.7%
- Active inventory
- 357
- Price-to-rent
- 7.0×
Monthly cashflow live
- Estimated rent
- $1,491 medium interval (Pro) →
- Mortgage (P&I)
- −$655
- Tax est. 1.5%
- −$156 /mo · $1,874/yr
- Insurance
- −$52
- HOA
- −$0
- Vacancy / Maint / Mgmt
- −$313
- Net cashflow
- $315
Break-even live
UW: 25.0% down · 7.5% · 30yr · 1.5% tax · 5.0% vac · 8.0% maint · 8.0% mgmt
Financing live
Cash to close
- Down payment
- $31,225
- Closing costs
- $3,747
- Reserves months
- —
- Total cash needed
- —
Loan-product check · same deal, 3 products live
Conventional
25% down · 7.5% · 30yr
- Down + closing
- —
- Monthly P&I
- —
- Monthly cashflow
- —
- DSCR
- —
- Eligible?
- —
Personal DTI + credit; lowest rate.
DSCR
20% down · 8.5% · 30yr
- Down + closing
- —
- Monthly P&I
- —
- Monthly cashflow
- —
- DSCR
- —
- Eligible?
- —
No personal income docs; deal must DSCR.
Hard money
10% down · 12.0% · 12mo
- Down + closing
- —
- Monthly P&I
- —
- Monthly cashflow
- —
- DSCR
- —
- Eligible?
- —
Short-term bridge; refi at stabilization.
Rent comps 1 comps
| Address | Beds | Baths | Sqft | Rent | $/sqft | DOM | Units | Dist |
|---|---|---|---|---|---|---|---|---|
| 5834 S Transit Rd Lockport, NY | 2.0 | 1.0 | 1200 | $1,600 | $1.33 | 1d | 1 | 1.27mi |
Listing history 7 events
-
2026-06-05status $124,900 Pending 41 DOM
-
2026-06-03days on market $124,900 Active 41 DOM
-
2026-06-02days on market $124,900 Active 40 DOM
-
2026-06-01days on market $124,900 Active 39 DOM
-
2026-05-31days on market $124,900 Active 38 DOM
-
2026-04-23$124,900 Active
-
2022-12-22historical
ⓘ Source: listings_history table (triggers on properties + properties_extension) + one-shot
backfill from property_details.listing_events for pre-trigger history.
Climate risk First Street
- Flood 6/10 Major FEMA zone X (unshaded) · 72% chance over 30 yrs
- Wildfire 3/10 Moderate
- Heat 2/10 Low 7 d/yr ≥94°F today · 15 d/yr by 30 yrs out
- Wind 1/10 Low
- Air quality 2/10 Low 2 unhealthy d/yr today · 2 by 30 yrs out
Nearby sold comps map
Loading sold comps map…
Walkable amenities ~0.75 mi
Loading nearby amenities…
Taxation est. · year 1
- Rental income
- $17,896
- − Mortgage interest
- −$6,996
- − Property taxes
- −$1,874
- − Insurance
- −$624
- − Repairs & maintenance
- −$1,432
- − Management
- −$1,432
- − Depreciation
- −$3,633
- Taxable income
- $1,905
- Est. tax owed @ 24.0%
- −$457
- After-tax cash flow
- $3,323/yr
For passive investors: Depreciation is non-cash, so a rental often shows a tax loss while cash-flowing — sheltering income. Rental losses are passive: they offset passive income freely, and up to $25,000/yr can offset ordinary (W-2) income if you actively participate and your MAGI is under $100k (phasing out to $0 by $150k); unused losses carry forward. On sale, claimed depreciation is recaptured at up to 25%, and gains may owe capital-gains tax (a 1031 exchange can defer both). Figures are a year-1 estimate at your 24.0% rate — not tax advice; consult a CPA.
Condition & rehab AI · 1 photo
This 2023-built single-family home is in excellent condition with tasteful features and a bright, open layout. Minor updates to the exterior and interior can significantly enhance its resale and rental value.
Value-add opportunities
- Both Painting and minor touch-ups — Enhances curb appeal and interior aesthetics
- Both Landscaping improvements — Enhances curb appeal and adds value
- Both New flooring in bathrooms — Improves functionality and aesthetics
- Both New kitchen appliances — Modernizes the kitchen and adds value
Renovation cost estimate screening
Value-add ROI direction
- Both Painting and minor touch-ups — Enhances curb appeal and interior aesthetics ↑
- Both Landscaping improvements — Enhances curb appeal and adds value ↑
- Both New flooring in bathrooms — Improves functionality and aesthetics ↑
- Both New kitchen appliances — Modernizes the kitchen and adds value ↑
ⓘ Cost ranges are severity-bucket heuristics (US national rule-of-thumb). Get contractor quotes + a written scope before underwriting a rehab budget.
Schools (NCES district)
- District
- Lockport City School District
- NCES district ID
- 3617670
- Math proficiency
- 44% ▼ -7.00%
- Reading proficiency
- 49% ▲ 3.00%
- Median HH income
- $43,793
- Composite
- 39.28/100
- National rank
- #3997
- State rank
- #452 of 590 in NY
Livability — South Lockport
- Score
- 66/100
- State rank
- #633
- US rank
- #11642
Category grades
Schools grade is shown separately in the Schools card above.
Census & demographics
- Census place
- South Lockport, NY
- County
- Niagara County · 157,377 people
- Metro
- Buffalo-Cheektowaga, NY
- Population (ZIP)
- 50,153
- Household income
- $75,427
- Rent vs Own
- Severe rent burden
- 1112.0
Population outlook (Niagara County) Hauer SSP2
- Today (2025)
- 204,149 people
- By 2030
- 197,900 · -3.1%
- By 2040
- 182,239 · -10.7%
- By 2050
- 165,198 · -19.1%
- By 2075
- 129,416 · -36.6%
- By 2100
- 96,222 · -52.9%
Race, ethnicity, and origin ACS 2023
- Neighborhood character
- Predominantly White (84%)
- Race & ethnicity
- White 84% Two or more races 6% Black 6% Hispanic / Latino 3%
- Common ancestry
- Romanian 9% Slovak 2% Lithuanian 2%
- Foreign-born
- 3% · Canada
- Languages at home
- 96% English-only · Spanish 1% Russian/Polish/Slavic 1% Other Indo-European 1%
Political lean MEDSL · Niagara
- 2024 margin
- R (+14.9) · D 42.5% · R 57.5%
- 2008→2024 swing
- -15.9pp toward R · 2008: 1.0pp · 2024: -14.9pp
- All cycles
- 2024: R+14.9 2020: R+9.7 2016: R+19.0 2012: D+0.6 2008: D+1.0
Not yet ingested
- Civics
- —
Market trends
- HPI YoY
- ▼ -262.57%
- Current HPI
- 303.6109
- Rent YoY
- ▲ 3.67%
- Metro
- Buffalo-Cheektowaga, NY
- State GDP YoY
- ▲ 2.60%
- F500 in state
- 92
Industry mix (Fortune 500 HQ in NY)
| Industry | F500 HQs | Revenue |
|---|---|---|
| Financial Services | 10 | $950B |
|
||
| Consumer Goods | 9 | $162B |
|
||
| Insurance | 4 | $225B |
|
||
| Telecommunications | 2 | $144B |
|
||
| Pharmaceuticals | 2 | $112B |
|
||
| Media / Entertainment | 2 | $69B |
|
||
Price history
2 events — show timeline
- 2026-04-23 Listed $124,900 WNYREIS
- 2022-12-22 Rental Removed — RENT.
Cash-flow waterfall
monthlySold comps — $/sqft
last 12 mo · ≤1 miLoading sold comps…