3712 E Louisiana State Dr · Kenner, LA
Flood risk No data
- FEMA flood zone
- —
- Chance of flooding over 30 yrs
- —
- Est. flood insurance / yr
- —
Fire risk No data
- Est. fire insurance / yr
- —
Heat risk No data
- Hot days now (above threshold)
- —
- Hot days in 30 yrs
- —
Wind risk No data
- Chance of severe wind over 30 yrs
- —
Air-quality risk No data
- Unhealthy air days now
- —
- Unhealthy air days in 30 yrs
- —
Risk factors via First Street. Map © Google.
Why this score? — see what drove the D grade
The composite is a weighted blend of 9 inputs, each scored 0–100. Each bar is that input's sub-score; the figure is the points it added to the 100-point composite (weight × sub-score).
- Cash flow +14.6/30.0
- ARV discount +8.2/15.0
- DSCR +4.4/10.0
- Livability +3.9/5.0
- 1% rule +3.2/10.0
- Schools +2.5/10.0
- Condition / age +2.5/5.0
- Rent growth +1.5/5.0
- Appreciation +0.0/10.0
$260,000
🖨 Deal sheet 📄 Offer letter ✓ Due diligence
Listing remarks MLS
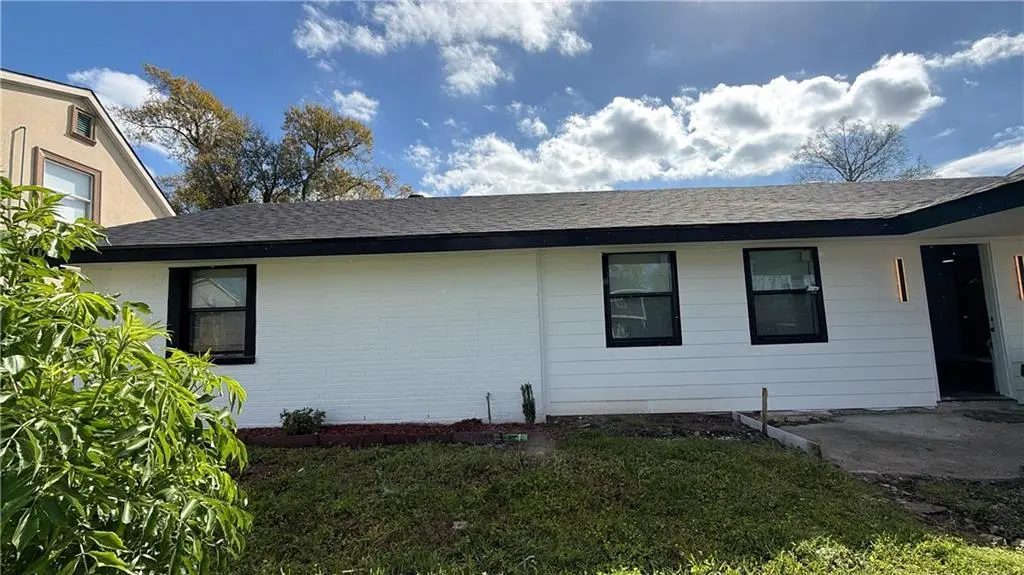
Must see. Newly renovated 4 bed 2 bath home in Kenner
Key facts
- Parking
- Built 1977
Neighborhood map
What this means for you Summary
Snapshot
- This is a 4-bed/2.0-bath single-family listed at $260k.
Deal economics
- At list price, monthly cash flow is $60 ($723/yr) — positive.
- The deal already cash-flows at list — no discount required.
- To meet the 1% rule (rent ≥ 1% of price), the offer needs to be $214k (17.7% below list).
- Recommended offer: $214k (17.7% below list) — sets the bar for 1% rule.
- Cap rate 6.6% vs local median 5.3% in Kenner — meaningfully above typical; check what's discounted (condition, days-on-market, listing class) to confirm the premium yield is real.
Location & tenants
- Location reads 78/100 on livability (#6 in LA, #2,414 nationally) — a middle-class / working-renter tenant base. Strengths: cost of living A+, housing A+, health & safety A+; Watch: amenities C-, employment C-, crime D.
- Jefferson Parish (suburban): math 24% / reading 34% proficiency, ranked #44 of 98 in LA (top 45%) — low school quality limits family demand, transient renter base, plan for 1-2y turnover; 70% free/reduced lunch — lower-income household profile, screen leases tightly.
- Market conditions: Rents falling (-4.2%/yr); 292 active listings in the ZIP; 30 comparable units currently listed for rent nearby; rentals at typical pace (median 14d on market — plan ~3-4 weeks tenant-placement turnaround); 518 units permitted in Jefferson Parish in 2024 (43 in 5+ unit buildings).
- This rent runs 38% of the median local income ($67k/yr) — at the standard rent-burdened threshold; future hikes will face affordability resistance.
Forward outlook
- Local home prices are declining (-3.0%/yr); year-one equity from $2k of loan paydown is wiped out by about $8k of value loss. Plan a longer hold.
Negotiation context
- Only 1 days on market — expect competitive offers; lowballing is unlikely to land.
- 2 sale attempts with the ask held roughly flat each time — persistent listings suggest the price (not the market) is what's stuck; bring a comps-based counter.
Questions for the listing agent
- Built in 1977 — when were the roof, HVAC, electrical panel, plumbing, and water heater last replaced?
- Is there a deadline driving the sale (1031 exchange, divorce, estate, relocation)? That informs how much negotiation room exists.
- Crime grade is D in this area — have there been break-ins, vandalism, or insurance claims at this property in the last 3 years? What carrier currently insures it and at what premium?
- The area grade is low — what's the realistic commute time and amenity access for the typical tenant pool here? Any planned neighborhood developments (good or bad) we should know about?
- What's the average days-on-market for RENTAL listings here right now (not sales)? A rising rental-DOM trend means longer vacancies and softer asking-rent achievability than the comps imply.
- What's the recent tenant-quality profile in this submarket — average credit score on applications, eviction rate, late-payment / NSF rate, and stable-employment percentage? A property-management company in the area should have these aggregated.
- How much new for-sale + rental construction is in the pipeline within 1–3 miles? Heavy new supply typically softens prices + rents 12–24 months out; constrained supply supports both.
Investment metrics
- 1% rule
- 0.82% ✗
- Cap rate
- 6.57%
- Cash-on-cash
- 0.99%
- DSCR
- 1.04
- GRM
- 10.1
CMA / ARV
- ARV (on-the-fly)
- $264,000
- Comps found
- 12
Show comp detail 12 sales within ~0.75 mi
| Address | Dist | Beds/Ba | Sqft | Sold | Price | $/sf | Match |
|---|---|---|---|---|---|---|---|
| 3617 E Loyola Dr | 0.25mi | 3/2.0 (-1) | 1,605 (-3%) | 13mo | $225,000 | $140 | 68 |
| 3716 W Louisiana Dr | 0.61mi | 4/2.0 | 1,736 (+5%) | 2mo | $259,000 | $149 | 61 |
| 3621 W Loyola Dr | 0.63mi | 3/2.0 (-1) | 1,575 (-4%) | 0mo | $198,000 | $126 | 58 |
| 417 Pellerin Dr | 0.74mi | 3/2.0 (-1) | 1,640 (-1%) | 11mo | $287,000 | $175 | 50 |
| 4161 Montrachet Dr | 0.61mi | 4/2.0 | 1,774 (+8%) | 12mo | $322,000 | $182 | 49 |
| 424 Bertolino Dr | 0.66mi | 4/2.0 | 1,530 (-7%) | 10mo | $295,000 | $193 | 49 |
| 914 Chateau Lafitte West Dr | 0.72mi | 3/2.5 (-1) | 1,708 (+4%) | 12mo | $287,000 | $168 | 44 |
| 340 Bertolino Dr | 0.73mi | 3/2.0 (-1) | 1,535 (-7%) | 8mo | $255,500 | $166 | 43 |
| 4169 Montrachet Dr | 0.62mi | 4/2.0 | 1,831 (+11%) | 12mo | $289,000 | $158 | 43 |
| 3733 Tulane Dr | 0.70mi | 3/2.0 (-1) | 1,467 (-11%) | 2mo | $235,000 | $160 | 42 |
| 429 Bertolino Dr | 0.69mi | 3/2.0 (-1) | 1,452 (-12%) | 11mo | $222,000 | $153 | 34 |
| 3612 Tulane Dr | 0.71mi | 3/2.0 (-1) | 1,408 (-15%) | 13mo | $220,000 | $156 | 27 |
Match score weights: distance 35% · size 25% · config 20% · recency 20%. Top-matched comps best support the ARV.
Projected returns pro-forma
-3.0% appreciation · 0.0% rent growth · sell at horizon
- IRR
- -17.9%
- Equity multiple
- 0.39×
- Total profit
- $-44,634
- Equity at exit
- $38,767
- IRR
- -16.5%
- Equity multiple
- 0.20×
- Total profit
- $-58,441
- Equity at exit
- $22,480
Cash invested: $72,800 (down + closing). Projections, not guarantees.
Landlord ↔ Tenant lean methodology
- Overall (STATE)
- 90 Strongly Landlord-Friendly
- State Louisiana
- 90 Strongly Landlord-Friendly · R+12
- County
- — inherits STATE
- City
- — inherits STATE
ZIP-level market 70065
- Rents YoY
- -4.2%
- Active inventory
- 292
- Price-to-rent
- 10.1×
Monthly cashflow live
- Estimated rent
- $2,139 high interval (Pro) →
- Mortgage (P&I)
- −$1,363
- Tax from tax record
- −$158 /mo · $1,897/yr
- Insurance
- −$108
- HOA
- −$0
- Vacancy / Maint / Mgmt
- −$449
- Net cashflow
- $60
Break-even live
UW: 25.0% down · 7.5% · 30yr · 1.5% tax · 5.0% vac · 8.0% maint · 8.0% mgmt
Financing live
Cash to close
- Down payment
- $65,000
- Closing costs
- $7,800
- Reserves months
- —
- Total cash needed
- —
Loan-product check · same deal, 3 products live
Conventional
25% down · 7.5% · 30yr
- Down + closing
- —
- Monthly P&I
- —
- Monthly cashflow
- —
- DSCR
- —
- Eligible?
- —
Personal DTI + credit; lowest rate.
DSCR
20% down · 8.5% · 30yr
- Down + closing
- —
- Monthly P&I
- —
- Monthly cashflow
- —
- DSCR
- —
- Eligible?
- —
No personal income docs; deal must DSCR.
Hard money
10% down · 12.0% · 12mo
- Down + closing
- —
- Monthly P&I
- —
- Monthly cashflow
- —
- DSCR
- —
- Eligible?
- —
Short-term bridge; refi at stabilization.
Rent comps 30 comps
| Address | Beds | Baths | Sqft | Rent | $/sqft | DOM | Units | Dist |
|---|---|---|---|---|---|---|---|---|
| 3608 E Louisiana State Dr Kenner, LA | 3.0 | 2.0 | 1800 | $2,275 | $1.26 | 1d | 1 | 0.25mi |
| 3872 E Loyola Dr Kenner, LA | 3.0 | 2.0 | 1170 | $1,575 | $1.35 | 20d | 1 | 0.28mi |
| 4141 Loire Dr Kenner, LA | 4.0 | 2.0 | 1950 | $2,400 | $1.23 | 2d | 1 | 0.43mi |
| 3816 W Louisiana State Dr Kenner, LA | 3.0 | 2.0 | 1400 | $1,800 | $1.29 | 11d | 1 | 0.60mi |
| 3808 Tulane Dr Kenner, LA | 3.0 | 2.0 | 1220 | $2,000 | $1.64 | 43d | 1 | 0.65mi |
| 505 Vassar Ct Kenner, LA | 3.0 | 2.0 | 1300 | $1,800 | $1.38 | 43d | 1 | 0.74mi |
| 4321 Loire Dr Unit D Kenner, LA | 3.0 | 2.0 | 1250 | $1,500 | $1.20 | 14d | 1 | 0.76mi |
| 4329 Loire Dr Apt D Kenner, LA | 3.0 | 2.0 | 1300 | $1,500 | $1.15 | 4d | 1 | 0.78mi |
| 4206 Paradis Ln Kenner, LA | 3.0 | 2.5 | 1350 | $1,950 | $1.44 | 23d | 1 | 0.79mi |
| 4213 Paradis Ln Kenner, LA | 3.0 | 2.5 | 1510 | $2,000 | $1.32 | 4d | 1 | 0.80mi |
| 1014 Saint Julien Dr Unit c2 Kenner, LA | 3.0 | 2.5 | 1450 | $1,850 | $1.28 | 3d | 1 | 0.85mi |
| 7 Cabernet Dr Kenner, LA | 4.0 | 2.0 | 2000 | $2,200 | $1.10 | 20d | 1 | 0.90mi |
| 617 Meursault Dr Kenner, LA | 4.0 | 2.0 | 2168 | $2,300 | $1.06 | 1d | 1 | 0.96mi |
| 3345 Cannes Pl Kenner, LA | 3.0 | 2.0 | 1923 | $2,700 | $1.40 | 43d | 1 | 0.97mi |
| 92 Palmetto Kenner, LA | 3.0 | 2.0 | 2003 | $3,200 | $1.60 | 1d | 1 | 0.97mi |
| 3318 Cannes Pl Kenner, LA | 3.0 | 2.0 | 1700 | $2,100 | $1.24 | 43d | 1 | 1.05mi |
| 1500 W Esplanade Ave Unit 29D Kenner, LA | 3.0 | 2.0 | 1725 | $1,900 | $1.10 | 1d | 1 | 1.07mi |
| 1500 W Esplanade Ave Kenner, LA | 3.0 | 2.0 | 1725 | $1,750 | $1.01 | 2d | 2 | 1.07mi |
| 1500 W Esplanade Ave Kenner, LA | 2.0–3.0 | 2.0 | 1587 | $2,000 | $1.26 | 43d | 1 | 1.07mi |
| 1616 Newport Pl Unit A Kenner, LA | 3.0 | 2.0 | 1100 | $1,500 | $1.36 | 43d | 1 | 1.14mi |
| 1620 Newport Pl Kenner, LA | 3.0 | 2.0 | 1450 | $1,550 | $1.07 | 4d | 1 | 1.15mi |
| 1621 42nd St Kenner, LA | 3.0 | 2.0 | 1550 | $1,550 | $1.00 | 43d | 1 | 1.15mi |
| 1625 42nd St Kenner, LA | 3.0 | 2.0 | 1550 | $1,550 | $1.00 | 43d | 1 | 1.17mi |
| 3611 Arizona Ave Kenner, LA | 4.0 | 2.0 | 1287 | $1,900 | $1.48 | 4d | 1 | 1.17mi |
| 4018 Arkansas Ave Kenner, LA | 3.0 | 2.0 | 1200 | $1,800 | $1.50 | 3d | 1 | 1.19mi |
| 1600 Newport Pl #4 Kenner, LA | 3.0 | 2.0 | 1400 | $1,550 | $1.11 | 3d | 1 | 1.20mi |
| 70 Furman Cir Kenner, LA | 4.0 | 2.5 | 1800 | $2,500 | $1.39 | 2d | 1 | 1.30mi |
| 1717 42nd St Unit D Kenner, LA | 3.0 | 2.0 | 1380 | $1,550 | $1.12 | 43d | 1 | 1.32mi |
| 3127 Marietta St Kenner, LA | 3.0 | 1.0 | 1600 | $1,600 | $1.00 | 43d | 1 | 1.40mi |
| 3136 Lexington Ave Kenner, LA | 4.0 | 3.0 | 1722 | $2,300 | $1.34 | 23d | 1 | 1.41mi |
Listing history 5 events
-
2026-03-19status Pending 53-char remark
Show marketing remark (53 chars)
Must see. Newly renovated 4 bed 2 bath home in Kenner
-
2026-03-19status Pending
Show marketing remark (53 chars)
Must see. Newly renovated 4 bed 2 bath home in Kenner
-
2026-03-18$260,000 Active 53-char remark
Show marketing remark (53 chars)
Must see. Newly renovated 4 bed 2 bath home in Kenner
-
2026-03-18$260,000 Active
Show marketing remark (53 chars)
Must see. Newly renovated 4 bed 2 bath home in Kenner
-
1977-06-01soldstatus
ⓘ Source: listings_history table (triggers on properties + properties_extension) + one-shot
backfill from property_details.listing_events for pre-trigger history.
Tax reassessment forecast LA · Resets to sale price
- Current annual tax
- $1,897 · $158/mo
- Projected year-2 tax
- $1,897 · $158/mo
- Expected delta
- $0/yr ($0/mo · 0.0%)
ⓘ Screening estimate from a state-policy table — verify with the county assessor before closing.
Nearby sold comps map
Loading sold comps map…
Walkable amenities ~0.75 mi
Loading nearby amenities…
Taxation est. · year 1
- Rental income
- $25,672
- − Mortgage interest
- −$14,564
- − Property taxes
- −$1,897
- − Insurance
- −$1,300
- − Repairs & maintenance
- −$2,054
- − Management
- −$2,054
- − Depreciation
- −$7,564
- Taxable loss
- −$3,759
- Est. tax savings @ 24.0%
- +$902
- After-tax cash flow
- $1,625/yr
For passive investors: Depreciation is non-cash, so a rental often shows a tax loss while cash-flowing — sheltering income. Rental losses are passive: they offset passive income freely, and up to $25,000/yr can offset ordinary (W-2) income if you actively participate and your MAGI is under $100k (phasing out to $0 by $150k); unused losses carry forward. On sale, claimed depreciation is recaptured at up to 25%, and gains may owe capital-gains tax (a 1031 exchange can defer both). Figures are a year-1 estimate at your 24.0% rate — not tax advice; consult a CPA.
Schools (NCES district)
- District
- Jefferson Parish
- NCES district ID
- 2200840
- Math proficiency
- 24% ▼ -36.00%
- Reading proficiency
- 34% ▼ -30.00%
- Median HH income
- $48,421
- Composite
- 25.19/100
- National rank
- #7511
- State rank
- #44 of 98 in LA
Livability — Kenner
- Score
- 78/100
- State rank
- #6
- US rank
- #2414
Category grades
Schools grade is shown separately in the Schools card above.
Census & demographics
- Census place
- Kenner, LA
- County
- Jefferson Parish · 426,999 people
- City population
- 66,707
- Metro
- New Orleans-Metairie, LA
- Population (ZIP)
- 48,936
- Household income
- $67,285
- Rent vs Own
- Severe rent burden
- 1906.0
Population outlook (Jefferson County) Hauer SSP2
- Today (2025)
- 451,696 people
- By 2030
- 455,451 · +0.8%
- By 2040
- 458,308 · +1.5%
- By 2050
- 461,031 · +2.1%
- By 2075
- 476,351 · +5.5%
- By 2100
- 499,377 · +10.6%
Race, ethnicity, and origin ACS 2023
- Neighborhood character
- Diverse neighborhood (Simpson 0.69)
- Race & ethnicity
- White 47% Hispanic / Latino 27% Two or more races 15% Black 15% Asian 6%
- Hispanic origin (detail)
- Mexican 2% Puerto Rican 3% Cuban 2%
- Common ancestry
- Lithuanian 9% Slovak 1% Italian 1%
- Foreign-born
- 19% · Canada, China, Vietnam
- Languages at home
- 72% English-only · Spanish 21% Other Indo-European 3% Arabic 1%
Political lean MEDSL · Jefferson
- 2024 margin
- R (+12.9) · D 42.5% · R 55.5% · Other 2.1%
- 2008→2024 swing
- +13.6pp toward D · 2008: -26.6pp · 2024: -12.9pp
- All cycles
- 2024: R+12.9 2020: R+11.1 2016: R+14.8 2012: R+18.4 2008: R+26.6
Not yet ingested
- Civics
- —
Market trends
- HPI YoY
- ▼ -214.79%
- Current HPI
- 139.5115
- Rent YoY
- ▼ -4.19%
- Metro
- New Orleans-Metairie, LA
- State GDP YoY
- ▲ 3.29%
- F500 in state
- 10
Industry mix (Fortune 500 HQ in LA)
| Industry | F500 HQs | Revenue |
|---|---|---|
| Telecommunications | 2 | $23B |
|
||
| Utilities | 1 | $12B |
|
||
| Wholesale / Distribution | 1 | $5B |
|
||
| Advertising | 1 | $2B |
|
||
Price history
+0.0% since first listed5 events — show timeline
- 2026-03-19 Pending — AcadianaMLS
- 2026-03-19 Pending — GSREIN
- 2026-03-18 Listed $260,000 GSREIN
- 2026-03-18 Listed $260,000 AcadianaMLS
- 1977-06-01 Sold (Public Records) — Public Records
Property tax history
+12.3%/yrLatest (2025): $1,897 · +215.3% YoY. Source: county tax records.
Cash-flow waterfall
monthlySold comps — $/sqft
last 12 mo · ≤1 miLoading sold comps…