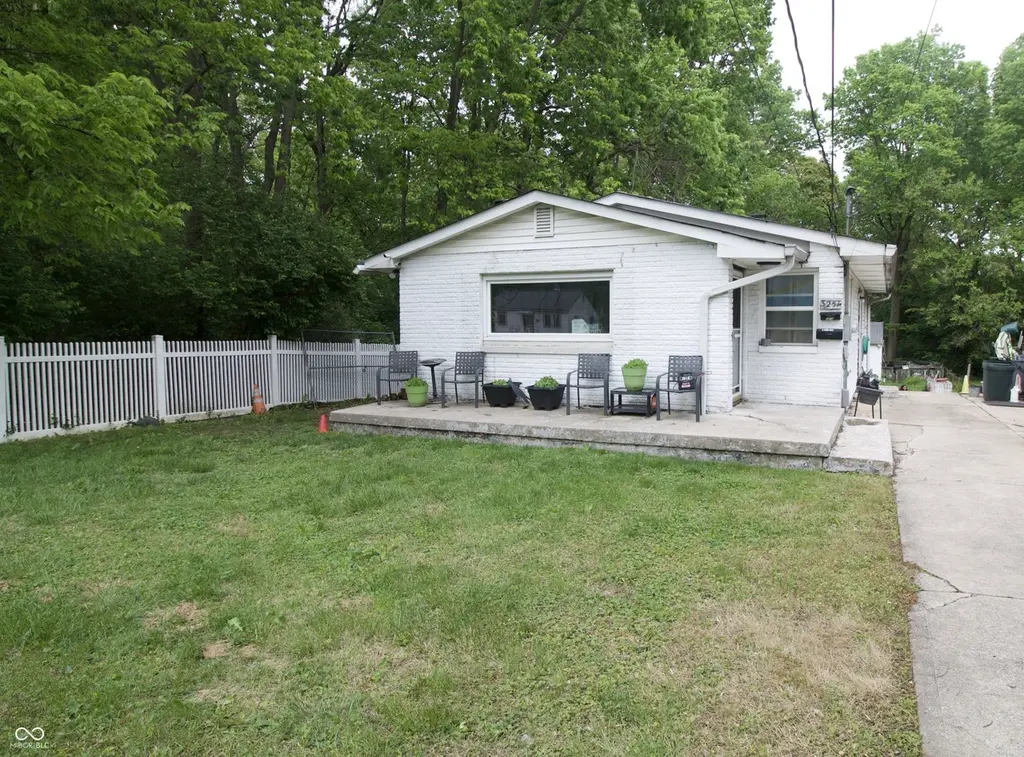
3251 Orchard Ave · Indianapolis city (balance), IN
Flood risk 7/10 · Major
- FEMA flood zone
- X (unshaded)
- Chance of flooding over 30 yrs
- 0.75%
- Est. flood insurance / yr
- $473 – $860
Fire risk 1/10 · Minimal
- Est. fire insurance / yr
- $717 – $1,331
Heat risk 3/10 · Minor
- Hot days now (above 102°F)
- 7 days/yr
- Hot days in 30 yrs
- 19 days/yr
Wind risk 2/10 · Minimal
- Chance of severe wind over 30 yrs
- 1.0%
Air-quality risk 4/10 · Minor
- Unhealthy air days now
- 5 days/yr
- Unhealthy air days in 30 yrs
- 7 days/yr
Risk factors via First Street. Map © Google.
Why this score? — see what drove the B grade
The composite is a weighted blend of 9 inputs, each scored 0–100. Each bar is that input's sub-score; the figure is the points it added to the 100-point composite (weight × sub-score).
- Cash flow +29.0/30.0
- ARV discount +15.0/15.0
- DSCR +10.0/10.0
- 1% rule +9.5/10.0
- Rent growth +2.7/5.0
- Livability +2.5/5.0
- Condition / age +2.5/5.0
- Schools +1.4/10.0
- Appreciation +0.0/10.0
$100,000
🖨 Deal sheet 📄 Offer letter ✓ Due diligence
Listing remarks
Situated on a quiet 0.26-acre lot and just under 15 minutes from downtown, this property offers a rare combination of space, flexibility, and upside for the right buyer. Step inside the main level and you'll find 3 bedrooms, a full bathroom, and hardwood floors throughout - a solid foundation with great character already in place. Downstairs, the walkout full basement adds generous storage and is already plumbed for a bathroom and kitchenette, giving the next owner a real head start on additional finished living space. Beyond the main house, the property continues to impress. Out back sits a 720 sq. ft. in-law suite fully equipped with a kitchen, half bathroom, and all utilities connected -
Key facts
- In-law suite
- Fully fenced
- Large front yard
Tags
Property features AI
Finance
- Other: Approximately 0.26 acre lot (about 1/4–1/2 acre); Additional parcels included
Exterior
- Utilities: Community sewer; Private water source; Natural gas connected and available; Sewer connected; Water connected; Cable connected; Solid waste service available
- Home design: Single-family residence; One story; Crawl space foundation; Brick construction
- Construction: Brick exterior; Crawl space foundation
- Exterior features: Fire pit; Front yard fencing; Fenced front yard
Interior
- Kitchen: Gas cooktop; Gas oven; Microwave; Refrigerator
- Bedrooms: Three bedrooms on the main level
- Bathrooms: Two full bathrooms (one on main level, one in basement); Primary bath has tub with shower
- Heating & cooling: Forced air heating (natural gas); Window air conditioning units
- Interior features: Dining room with fireplace; Finished basement with exterior entry; Has view
- Laundry & utility: Laundry in basement with full connections; Gas water heater
Neighborhood map
What this means for you Summary
Snapshot
- This is a 3-bed/2.0-bath single-family listed at $100k.
Deal economics
- At list price, monthly cash flow is $287 ($3k/yr) — positive.
- The deal already cash-flows at list — no discount required.
- Meets the 1% rule at list price ($1k rent vs $100k).
- Cap rate 10.4% vs local median 4.4% in Indianapolis city (balance) — top-decile yield for the area; either an underpriced asset or a hidden risk that comps aren't pricing in. Stress-test before assuming the spread holds.
Location & tenants
- Location reads: area grade B — affects rentability + tenant quality, not the cash-flow math above.
- Indianapolis Public Schools (urban): math 14% / reading 20% proficiency, ranked #286 of 301 in IN (top 95%) — low school quality limits family demand, transient renter base, plan for 1-2y turnover; 77% free/reduced lunch — lower-income household profile, screen leases tightly.
- Market conditions: Rents flat; 334 active listings in the ZIP; 40 comparable units currently listed for rent nearby; rentals at typical pace (median 22d on market — plan ~3-4 weeks tenant-placement turnaround); lower-income renter base — watch delinquency; 1,906 units permitted in Marion County in 2024 (621 in 5+ unit buildings).
- At $1,447/mo this rent would consume 46% of the median local household income ($38k/yr) (locally 2340% of renters already pay >50% of income on rent) — very limited rent-growth headroom before tenants either downsize or default.
Forward outlook
- Local home prices are declining (-3.0%/yr); year-one equity from $691 of loan paydown is wiped out by about $3k of value loss. Plan a longer hold.
- Marion County population projected at +18% by 2050 — long-run rental-demand tailwind backs the buy-and-hold thesis.
Negotiation context
- Only 4 days on market — expect competitive offers; lowballing is unlikely to land.
Risks & watch-outs
- Watch-outs: property tax is 2.8% of price; flood insurance adds $56/mo.
- Climate carrying-cost: major flood risk — expect insurance premiums to compound above CPI over the hold.
Questions for the listing agent
- Built in 1963 — when were the roof, HVAC, electrical panel, plumbing, and water heater last replaced?
- Property tax is high relative to price — has the assessment been appealed recently, and will the sale trigger a re-assessment?
- What's the actual annual flood-insurance premium (NFIP or private), and is the property in a SFHA with mandatory coverage?
- Is there a deadline driving the sale (1031 exchange, divorce, estate, relocation)? That informs how much negotiation room exists.
- What's the average days-on-market for RENTAL listings here right now (not sales)? A rising rental-DOM trend means longer vacancies and softer asking-rent achievability than the comps imply.
- What's the recent tenant-quality profile in this submarket — average credit score on applications, eviction rate, late-payment / NSF rate, and stable-employment percentage? A property-management company in the area should have these aggregated.
- How much new for-sale + rental construction is in the pipeline within 1–3 miles? Heavy new supply typically softens prices + rents 12–24 months out; constrained supply supports both.
Investment metrics
- 1% rule
- 1.45% ✓
- Cap rate
- 10.41%
- Cash-on-cash
- 14.70%
- DSCR
- 1.65
- GRM
- 5.8
CMA / ARV
- ARV (median comp)
- $150,489
- List price
- $100,000
- Delta
- -33.55%
- Verdict
- UNDERPRICED
- Comps
- 20 within 1.0 mi
Show comp detail 12 sales within ~0.75 mi
| Address | Dist | Beds/Ba | Sqft | Sold | Price | $/sf | Match |
|---|---|---|---|---|---|---|---|
| 2931 Sangster Ave | 0.39mi | 3/1.0 | 1,064 (-0%) | 6mo | $117,000 | $110 | 72 |
| 3263 Schofield Ave | 0.09mi | 3/1.0 | 1,194 (+12%) | 2mo | $73,600 | $62 | 70 |
| 2848 Schofield Ave | 0.51mi | 3/1.0 | 1,102 (+3%) | 2mo | $72,000 | $65 | 66 |
| 2951 Hillside Ave | 0.42mi | 3/2.0 | 980 (-8%) | 3mo | $156,000 | $159 | 64 |
| 3135 Ralston Ave | 0.25mi | 2/2.0 (-1) | 1,200 (+12%) | 1mo | $177,500 | $148 | 62 |
| 2753 Sangster Ave | 0.61mi | 3/1.0 | 1,088 (+2%) | 3mo | $162,000 | $149 | 62 |
| 2808 Sangster Ave | 0.57mi | 3/1.0 | 1,028 (-4%) | 3mo | $100,000 | $97 | 60 |
| 2929 Manlove Ave | 0.41mi | 3/1.0 | 960 (-10%) | 2mo | $139,000 | $145 | 58 |
| 3038 Baltimore Ave | 0.27mi | 2/1.0 (-1) | 924 (-14%) | 4mo | $98,500 | $107 | 53 |
| 3515 N Keystone Ave | 0.47mi | 2/1.0 (-1) | 1,200 (+12%) | 8mo | $58,000 | $48 | 42 |
| 3460 N Oxford St | 0.72mi | 3/1.0 | 1,176 (+10%) | 6mo | $50,000 | $43 | 41 |
| 2738 Schofield Ave | 0.65mi | 4/1.0 (+1) | 1,205 (+13%) | 2mo | $170,000 | $141 | 38 |
Match score weights: distance 35% · size 25% · config 20% · recency 20%. Top-matched comps best support the ARV.
Projected returns pro-forma
-3.0% appreciation · 0.81% rent growth · sell at horizon
- IRR
- -0.9%
- Equity multiple
- 0.97×
- Total profit
- $-893
- Equity at exit
- $14,910
- IRR
- 6.0%
- Equity multiple
- 1.39×
- Total profit
- $11,044
- Equity at exit
- $8,646
Cash invested: $28,000 (down + closing). Projections, not guarantees.
Landlord ↔ Tenant lean methodology
- Overall (STATE)
- 90 Strongly Landlord-Friendly
- State Indiana
- 90 Strongly Landlord-Friendly · R+11
- County
- — inherits STATE
- City
- — inherits STATE
ZIP-level market 46218
- Home prices YoY
- -17.1%
- Rents YoY
- 0.8%
- Active inventory
- 334
- Price-to-rent
- 5.8×
Monthly cashflow live
- Estimated rent
- $1,447 high interval (Pro) →
- Mortgage (P&I)
- −$524
- Tax from tax record
- −$234 /mo · $2,808/yr
- Insurance
- −$42
- Flood insurance flood zone
- −$56 /mo · $666/yr
- HOA
- −$0
- Vacancy / Maint / Mgmt
- −$304
- Net cashflow
- $287
Break-even live
UW: 25.0% down · 7.5% · 30yr · 1.5% tax · 5.0% vac · 8.0% maint · 8.0% mgmt
Financing live
Cash to close
- Down payment
- $25,000
- Closing costs
- $3,000
- Reserves months
- —
- Total cash needed
- —
Loan-product check · same deal, 3 products live
Conventional
25% down · 7.5% · 30yr
- Down + closing
- —
- Monthly P&I
- —
- Monthly cashflow
- —
- DSCR
- —
- Eligible?
- —
Personal DTI + credit; lowest rate.
DSCR
20% down · 8.5% · 30yr
- Down + closing
- —
- Monthly P&I
- —
- Monthly cashflow
- —
- DSCR
- —
- Eligible?
- —
No personal income docs; deal must DSCR.
Hard money
10% down · 12.0% · 12mo
- Down + closing
- —
- Monthly P&I
- —
- Monthly cashflow
- —
- DSCR
- —
- Eligible?
- —
Short-term bridge; refi at stabilization.
Rent comps 40 comps
| Address | Beds | Baths | Sqft | Rent | $/sqft | DOM | Units | Dist |
|---|---|---|---|---|---|---|---|---|
| 3363 Nicholas Ave Indianapolis, IN | 2.0 | 1.0 | 720 | $1,000 | $1.39 | 4d | 1 | 0.15mi |
| 3121 Baltimore Ave Indianapolis, IN | 3.0 | 1.0 | 1232 | $7,865 | $6.38 | 8d | 1 | 0.24mi |
| 1902 E 35th St Indianapolis, IN | 3.0 | 1.0 | 1100 | $1,600 | $1.45 | 44d | 1 | 0.29mi |
| 3448 Hillside Ave Indianapolis, IN | 4.0 | 1.0 | 1305 | $1,800 | $1.38 | 2d | 1 | 0.32mi |
| 3207 N Arsenal Ave Indianapolis, IN | 3.0 | 1.0 | 994 | $1,195 | $1.20 | 24d | 1 | 0.35mi |
| 3532 Caroline Ave Indianapolis, IN | 4.0 | 1.0 | 1177 | $2,299 | $1.95 | 44d | 1 | 0.35mi |
| 3132 Dr Andrew J Brown Ave Indianapolis, IN | 2.0 | 1.0–2.0 | 791 | $2,120 | $2.68 | 2d | 46 | 0.48mi |
| 2820 Caroline Ave Indianapolis, IN | 3.0 | 1.5 | 1112 | $1,250 | $1.12 | 24d | 1 | 0.59mi |
| 2931 N Tacoma Ave Unit 31 Indianapolis, IN | 2.0 | 1.0 | 800 | $950 | $1.19 | 8d | 1 | 0.61mi |
| 3139 Guilford Ave Indianapolis, IN | 3.0 | 1.0 | 1068 | $1,345 | $1.26 | 44d | 1 | 0.64mi |
| 3476 Birchwood Ave Indianapolis, IN | 3.0 | 1.5 | 1420 | $1,625 | $1.14 | 24d | 1 | 0.69mi |
| 3110 Guilford Ave Indianapolis, IN | 3.0 | 1.5 | 1250 | $1,295 | $1.04 | 24d | 1 | 0.70mi |
| 3203 Sutherland Ave Unit 1310761P Indianapolis, IN | 2.0 | 1.0 | 1097 | $3,668 | $3.34 | 2d | 1 | 0.70mi |
| 3541 Birchwood Ave Indianapolis, IN | 3.0 | 1.0 | 1400 | $1,549 | $1.11 | 12d | 1 | 0.72mi |
| 3741 N Tacoma Ave Indianapolis, IN | 3.0 | 1.0 | 913 | $2,200 | $2.41 | 18d | 1 | 0.74mi |
| 2950 Winthrop Ave Indianapolis, IN | 3.0 | 2.0 | 1224 | $1,449 | $1.18 | 44d | 1 | 0.76mi |
| 2757 Columbia Ave Unit 2757-B Indianapolis, IN | 3.0 | 2.0 | 1350 | $1,525 | $1.13 | 44d | 1 | 0.78mi |
| 2616 Caroline Ave Indianapolis, IN | 4.0 | 1.0 | 1276 | $1,300 | $1.02 | 44d | 1 | 0.78mi |
| 3535 N Oxford St Indianapolis, IN | 3.0 | 1.0 | 1015 | $1,500 | $1.48 | 22d | 1 | 0.79mi |
| 3509 Guilford Ave Indianapolis, IN | 3.0 | 1.5 | 1351 | $1,445 | $1.07 | 15d | 1 | 0.79mi |
| 916 Fairfield Ave Unit 918 Indianapolis, IN | 3.0 | 1.0 | 1000 | $1,300 | $1.30 | 8d | 1 | 0.81mi |
| 728 E 34th St Indianapolis, IN | 3.0 | 1.0 | 1491 | $1,400 | $0.94 | 4d | 1 | 0.85mi |
| 728 E 34th St Indianapolis, IN | 3.0 | 1.0 | 1491 | $1,400 | $0.94 | 20d | 1 | 0.85mi |
| 2010 E 25th St Indianapolis, IN | 2.0 | 1.0 | 792 | $775 | $0.98 | 24d | 1 | 0.86mi |
| 3472 N Dearborn St Indianapolis, IN | 2.0 | 1.0 | 890 | $1,099 | $1.23 | 20d | 1 | 0.88mi |
| 3359 N College Ave Unit 3359 Indianapolis, IN | 2.0 | 1.5 | 1082 | $1,895 | $1.75 | 24d | 1 | 0.89mi |
| 3359 N College Ave Indianapolis, IN | 2.0 | 1.5 | 1450 | $1,795 | $1.24 | 11d | 1 | 0.89mi |
| 2553 Columbia Ave Unit 2553-B Indianapolis, IN | 3.0 | 2.0 | 1350 | $1,525 | $1.13 | 44d | 1 | 0.89mi |
| 2549 Columbia Ave Unit 1332865P Indianapolis, IN | 3.0 | 2.0 | 893 | $2,274 | $2.55 | 2d | 1 | 0.90mi |
| 3106 N College Ave Indianapolis, IN | 3.0 | 1.5 | 1400 | $1,700 | $1.21 | 8d | 1 | 0.95mi |
| 2751 Guilford Ave Unit Aunit Indianapolis, IN | 3.0 | 2.0 | 1250 | $1,750 | $1.40 | 44d | 1 | 0.95mi |
| 2751 Guilford Ave Unit B Indianapolis, IN | 3.0 | 2.0 | 1250 | $1,750 | $1.40 | 14d | 1 | 0.95mi |
| 3365 Broadway St Indianapolis, IN | 3.0 | 2.0 | 1300 | $1,700 | $1.31 | 44d | 1 | 0.95mi |
| 2920 N Lasalle St Indianapolis, IN | 3.0 | 1.0 | 875 | $1,095 | $1.25 | 18d | 1 | 1.01mi |
| 2711 Guilford Ave Indianapolis, IN | 3.0 | 2.0 | 1250 | $1,695 | $1.36 | 24d | 1 | 1.01mi |
| 2372 Beckwith Dr Indianapolis, IN | 4.0 | 1.0–1.5 | 779 | $1,206 | $1.55 | 2d | 32 | 1.02mi |
| 2906 N Lasalle St Indianapolis, IN | 4.0 | 1.0 | 1032 | $950 | $0.92 | 24d | 1 | 1.02mi |
| 3909 Winthrop Ave Unit B Indianapolis, IN | 2.0 | 1.5 | 931 | $1,550 | $1.66 | 12d | 1 | 1.02mi |
| 3141 N Park Ave Indianapolis, IN | 3.0 | 1.0 | 1390 | $1,000 | $0.72 | 44d | 1 | 1.03mi |
| 2830 Lasalle St Unit 28 Indianapolis, IN | 2.0 | 1.0 | 1400 | $1,100 | $0.79 | 44d | 1 | 1.07mi |
Listing history 1 events
-
2026-05-15$100,000 Active 1105-char remark
ⓘ Source: listings_history table (triggers on properties + properties_extension) + one-shot
backfill from property_details.listing_events for pre-trigger history.
Tax reassessment forecast IN · Partial reset (capped growth)
- Current annual tax
- $2,808 · $234/mo
- Projected year-2 tax
- $2,808 · $234/mo
- Expected delta
- $0/yr ($0/mo · 0.0%)
ⓘ Screening estimate from a state-policy table — verify with the county assessor before closing.
Climate risk First Street
- Flood 7/10 Severe FEMA zone X (unshaded) · 75% chance over 30 yrs
- Wildfire 1/10 Low
- Heat 3/10 Moderate 7 d/yr ≥102°F today · 19 d/yr by 30 yrs out
- Wind 2/10 Low 100% chance of damaging wind over 30 yrs
- Air quality 4/10 Moderate 5 unhealthy d/yr today · 7 by 30 yrs out
Nearby sold comps map
Loading sold comps map…
Walkable amenities ~0.75 mi
Loading nearby amenities…
Taxation est. · year 1
- Rental income
- $17,364
- − Mortgage interest
- −$5,602
- − Property taxes
- −$2,808
- − Insurance
- −$1,166
- − Repairs & maintenance
- −$1,389
- − Management
- −$1,389
- − Depreciation
- −$2,909
- Taxable income
- $2,100
- Est. tax owed @ 24.0%
- −$504
- After-tax cash flow
- $2,946/yr
For passive investors: Depreciation is non-cash, so a rental often shows a tax loss while cash-flowing — sheltering income. Rental losses are passive: they offset passive income freely, and up to $25,000/yr can offset ordinary (W-2) income if you actively participate and your MAGI is under $100k (phasing out to $0 by $150k); unused losses carry forward. On sale, claimed depreciation is recaptured at up to 25%, and gains may owe capital-gains tax (a 1031 exchange can defer both). Figures are a year-1 estimate at your 24.0% rate — not tax advice; consult a CPA.
Schools (NCES district)
- District
- Indianapolis Public Schools
- NCES district ID
- 1804770
- Math proficiency
- 14% ▼ -7.00%
- Reading proficiency
- 20% ▼ -3.00%
- Median HH income
- $32,034
- Composite
- 13.69/100
- National rank
- #9499
- State rank
- #286 of 301 in IN
Livability — Indianapolis city (balance)
No livability data for this city. (Only ~50 U.S. cities are tracked.)
Census & demographics
- Census place
- Indianapolis city (balance), IN
- County
- Marion County · 998,460 people
- City population
- 881,119
- Metro
- Indianapolis-Carmel-Anderson, IN
- Population (ZIP)
- 29,360
- Household income
- $38,063
- Rent vs Own
- Severe rent burden
- 2340.0
Population outlook (Marion County) Hauer SSP2
- Today (2025)
- 1,025,572 people
- By 2030
- 1,065,727 · +3.9%
- By 2040
- 1,141,577 · +11.3%
- By 2050
- 1,208,920 · +17.9%
- By 2075
- 1,367,288 · +33.3%
- By 2100
- 1,438,201 · +40.2%
Race, ethnicity, and origin ACS 2023
- Neighborhood character
- Predominantly Black (68%)
- Race & ethnicity
- Black 68% White 18% Hispanic / Latino 9% Two or more races 6%
- Hispanic origin (detail)
- Mexican 6%
- Common ancestry
- Romanian 1%
- Foreign-born
- 5% · Canada, Philippines
- Languages at home
- 92% English-only · Spanish 7%
Political lean MEDSL · Marion
- 2024 margin
- Strong D (+27.7) · D 63.0% · R 35.3% · Other 1.7%
- 2008→2024 swing
- -0.7pp no change · 2008: 28.4pp · 2024: 27.7pp
- All cycles
- 2024: D+27.7 2020: D+29.1 2016: D+22.8 2012: D+22.2 2008: D+28.4
Not yet ingested
- Civics
- —
Market trends
- HPI YoY
- ▼ -81.57%
- Current HPI
- 395.7071
- Rent YoY
- ▲ 0.81%
- Metro
- Indianapolis-Carmel-Anderson, IN
- State GDP YoY
- ▲ 2.90%
- F500 in state
- 18
Industry mix (Fortune 500 HQ in IN)
| Industry | F500 HQs | Revenue |
|---|---|---|
| Industrial Machinery | 2 | $37B |
|
||
| Healthcare | 1 | $177B |
|
||
| Pharmaceuticals | 1 | $45B |
|
||
| Metals / Steel | 1 | $18B |
|
||
| Agriculture | 1 | $17B |
|
||
| Packaging | 1 | $12B |
|
||
Price history
2 events — show timeline
- 2026-05-19 Pending — MIBOR as Distributed by MLS Grid
- 2026-05-15 Listed $100,000 MIBOR as Distributed by MLS Grid
Property tax history
+10.0%/yrLatest (2025): $2,808 · -26.5% YoY. Source: county tax records.
Cash-flow waterfall
monthlySold comps — $/sqft
last 12 mo · ≤1 miLoading sold comps…