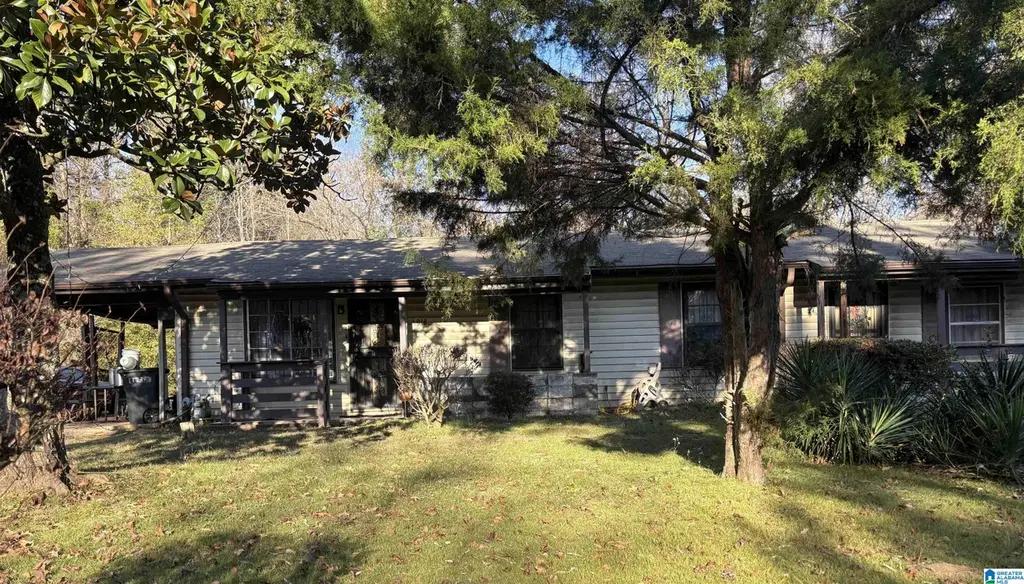
1018 Pleasant View Rd · Bessemer, AL
Flood risk 1/10 · Minimal
- FEMA flood zone
- X (unshaded)
- Chance of flooding over 30 yrs
- 0.0%
- Est. flood insurance / yr
- $507 – $1,088
Fire risk 2/10 · Minimal
- Est. fire insurance / yr
- $916 – $1,700
Heat risk 6/10 · Moderate
- Hot days now (above 108°F)
- 7 days/yr
- Hot days in 30 yrs
- 19 days/yr
Wind risk 6/10 · Moderate
- Chance of severe wind over 30 yrs
- 46.0%
Air-quality risk 3/10 · Minor
- Unhealthy air days now
- 2 days/yr
- Unhealthy air days in 30 yrs
- 5 days/yr
Risk factors via First Street. Map © Google.
Why this score? — see what drove the B- grade
The composite is a weighted blend of 9 inputs, each scored 0–100. Each bar is that input's sub-score; the figure is the points it added to the 100-point composite (weight × sub-score).
- Cash flow +30.0/30.0
- ARV discount +12.3/15.0
- DSCR +10.0/10.0
- 1% rule +7.4/10.0
- Livability +3.0/5.0
- Condition / age +2.5/5.0
- Schools +1.8/10.0
- Rent growth +1.7/5.0
- Appreciation +0.0/10.0
$90,000
🖨 Deal sheet 📄 Offer letter ✓ Due diligence
Listing remarks MLS
Property is owner-occupied. Advance notice required for all showings. Small dog on premises—please do not let pet out and ensure all doors are secured. Property may function as a multi-family or shared-living layout, with shared kitchen and bathroom areas. Buyer to verify zoning, permitted use, and suitability for intended purpose. All information, including square footage and use, to be verified by buyer.
Key facts
- 0.37 acre lot
- Built 1960
- Listed 180 days
Neighborhood map
What this means for you Summary
Snapshot
- This is a 2-bed/1.0-bath single-family listed at $90k.
Deal economics
- At list price, monthly cash flow is $351 ($4k/yr) — positive.
- The deal already cash-flows at list — no discount required.
- Meets the 1% rule at list price ($1k rent vs $90k).
- Recommended offer: $79k (12.0% below list) — sets the bar for market timing.
- Cap rate 11.0% vs local median 5.9% in Bessemer — top-decile yield for the area; either an underpriced asset or a hidden risk that comps aren't pricing in. Stress-test before assuming the spread holds.
Location & tenants
- Location reads 59/100 on livability (#331 in AL) — a working-class tenant base; expect higher turnover. Strengths: commute A+, cost of living A+, housing A; Watch: schools D-, crime F, amenities F.
- Jefferson County (suburban): math 9% / reading 32% proficiency, ranked #104 of 129 in AL (top 81%) — low school quality limits family demand, transient renter base, plan for 1-2y turnover.
- Market conditions: Rents falling (-3.1%/yr); 115 active listings in the ZIP; 16 comparable units currently listed for rent nearby; rentals at typical pace (median 24d on market — plan ~3-4 weeks tenant-placement turnaround); lower-income renter base — watch delinquency; 2,114 units permitted in Jefferson County in 2024 (556 in 5+ unit buildings).
- This rent runs 38% of the median local income ($35k/yr) — at the standard rent-burdened threshold; future hikes will face affordability resistance.
Forward outlook
- Local home prices are declining (-3.0%/yr); year-one equity from $622 of loan paydown is wiped out by about $3k of value loss. Plan a longer hold.
- Jefferson County population projected to shrink 4% by 2050 — rents likely to lag national; underwrite the cash flow, not the appreciation.
- At projected returns (-3.0% appreciation + 0.0% rent growth), your $25k cash investment doubles in ~10 years — after that, you're playing with house money.
Negotiation context
- It's been on market 180 days — a 12% lower offer ($79k) is reasonable based on typical stale-listing flexibility.
Risks & watch-outs
- Climate carrying-cost: major wind risk, 46% chance of damaging wind over 30y; extreme-heat days projected 7→19/yr by 2055 (HVAC capex compounding) — expect insurance premiums to compound above CPI over the hold.
Questions for the listing agent
- It's been on market 180 days. Have you received any prior offers? Is the seller open to a 12% concession, seller financing, or rate buy-down credit?
- Built in 1960 — when were the roof, HVAC, electrical panel, plumbing, and water heater last replaced?
- Why hasn't it sold? Are there any deal-killer items the seller is aware of (foundation, flood, title, zoning, code violations)?
- Is there a deadline driving the sale (1031 exchange, divorce, estate, relocation)? That informs how much negotiation room exists.
- Schools are D-rated, which usually means shorter tenancies and higher turnover. Who's the typical renter profile here, and what's been the actual vacancy rate?
- Crime grade is F in this area — have there been break-ins, vandalism, or insurance claims at this property in the last 3 years? What carrier currently insures it and at what premium?
- What's the average days-on-market for RENTAL listings here right now (not sales)? A rising rental-DOM trend means longer vacancies and softer asking-rent achievability than the comps imply.
- What's the recent tenant-quality profile in this submarket — average credit score on applications, eviction rate, late-payment / NSF rate, and stable-employment percentage? A property-management company in the area should have these aggregated.
- How much new for-sale + rental construction is in the pipeline within 1–3 miles? Heavy new supply typically softens prices + rents 12–24 months out; constrained supply supports both.
Investment metrics
- 1% rule
- 1.24% ✓
- Cap rate
- 10.97%
- Cash-on-cash
- 16.72%
- DSCR
- 1.74
- GRM
- 6.7
CMA / ARV
- ARV (median comp)
- $100,642
- List price
- $90,000
- Delta
- -10.57%
- Verdict
- UNDERPRICED
- Comps
- 20 within 1.0 mi
Show comp detail 4 sales within ~0.75 mi
| Address | Dist | Beds/Ba | Sqft | Sold | Price | $/sf | Match |
|---|---|---|---|---|---|---|---|
| 408 Joseph St | 0.73mi | 2/1.0 | 1,410 (+9%) | 5mo | $62,000 | $44 | 47 |
| 104 Raimund Ave | 0.41mi | 2/1.0 | 1,145 (-12%) | 22mo | $60,000 | $52 | 43 |
| 208 Raimund Ave | 0.51mi | 3/2.0 (+1) | 1,424 (+10%) | 10mo | $100,000 | $70 | 42 |
| 412 Raimund Ave | 0.71mi | 2/1.0 | 1,212 (-6%) | 20mo | $47,800 | $39 | 40 |
Match score weights: distance 35% · size 25% · config 20% · recency 20%. Top-matched comps best support the ARV.
Projected returns pro-forma
-3.0% appreciation · 0.0% rent growth · sell at horizon
- IRR
- 4.7%
- Equity multiple
- 1.18×
- Total profit
- $4,460
- Equity at exit
- $13,419
- IRR
- 11.5%
- Equity multiple
- 1.79×
- Total profit
- $19,860
- Equity at exit
- $7,782
Cash invested: $25,200 (down + closing). Projections, not guarantees.
Landlord ↔ Tenant lean methodology
- Overall (STATE)
- 90 Strongly Landlord-Friendly
- State Alabama
- 90 Strongly Landlord-Friendly · R+15
- County
- — inherits STATE
- City
- — inherits STATE
ZIP-level market 35020
- Home prices YoY
- -24.2%
- Rents YoY
- -3.1%
- Active inventory
- 115
- Price-to-rent
- 6.7×
Monthly cashflow live
- Estimated rent
- $1,117 high interval (Pro) →
- Mortgage (P&I)
- −$472
- Tax from tax record
- −$22 /mo · $267/yr
- Insurance
- −$38
- HOA
- −$0
- Vacancy / Maint / Mgmt
- −$235
- Net cashflow
- $351
Break-even live
UW: 25.0% down · 7.5% · 30yr · 1.5% tax · 5.0% vac · 8.0% maint · 8.0% mgmt
Financing live
Cash to close
- Down payment
- $22,500
- Closing costs
- $2,700
- Reserves months
- —
- Total cash needed
- —
Loan-product check · same deal, 3 products live
Conventional
25% down · 7.5% · 30yr
- Down + closing
- —
- Monthly P&I
- —
- Monthly cashflow
- —
- DSCR
- —
- Eligible?
- —
Personal DTI + credit; lowest rate.
DSCR
20% down · 8.5% · 30yr
- Down + closing
- —
- Monthly P&I
- —
- Monthly cashflow
- —
- DSCR
- —
- Eligible?
- —
No personal income docs; deal must DSCR.
Hard money
10% down · 12.0% · 12mo
- Down + closing
- —
- Monthly P&I
- —
- Monthly cashflow
- —
- DSCR
- —
- Eligible?
- —
Short-term bridge; refi at stabilization.
Rent comps 16 comps
| Address | Beds | Baths | Sqft | Rent | $/sqft | DOM | Units | Dist |
|---|---|---|---|---|---|---|---|---|
| 704 Avenue I Bessemer, AL | 3.0 | 1.0 | 1232 | $1,200 | $0.97 | 23d | 1 | 0.68mi |
| 808 Fairfax Ave Bessemer, AL | 3.0 | 1.0 | 1042 | $1,050 | $1.01 | 23d | 1 | 0.91mi |
| 810 Fairfax Ave Bessemer, AL | 3.0 | 1.0 | 1042 | $1,050 | $1.01 | 23d | 1 | 0.92mi |
| 4015 Goodwin Rd Bessemer, AL | 3.0 | 2.0 | 1200 | $1,211 | $1.01 | 15d | 1 | 0.94mi |
| 236 Clifton St Bessemer, AL | 3.0 | 1.0 | 1450 | $1,100 | $0.76 | 43d | 1 | 0.96mi |
| 931 Dartmouth Ave Bessemer, AL | 3.0 | 1.0 | 984 | $925 | $0.94 | 43d | 1 | 1.10mi |
| 3626 Wind Ridge Ln Bessemer, AL | 3.0 | 2.0 | 1305 | $1,850 | $1.42 | 2d | 1 | 1.15mi |
| 200 Center St Bessemer, AL | 3.0 | 1.5 | 1826 | $1,200 | $0.66 | 10d | 1 | 1.18mi |
| 300 Norwood Ave Bessemer, AL | 3.0 | 1.0 | 966 | $900 | $0.93 | 11d | 1 | 1.18mi |
| 300 Norwood Ave Bessemer, AL | 3.0 | 1.0 | 966 | $1,000 | $1.04 | 23d | 1 | 1.18mi |
| 1600 Holbrook Ave Bessemer, AL | 3.0 | 1.0 | 885 | $999 | $1.13 | 1d | 1 | 1.25mi |
| 18 Center St Bessemer, AL | 3.0 | 1.0 | 1418 | $1,100 | $0.78 | 43d | 1 | 1.29mi |
| 10 Center St Bessemer, AL | 3.0 | 1.0 | 1152 | $1,000 | $0.87 | 43d | 1 | 1.32mi |
| 1622 Fairfax Ave Bessemer, AL | 2.0 | 2.0 | 1104 | $995 | $0.90 | 1d | 1 | 1.39mi |
| 320 16th St S Bessemer, AL | 3.0 | 1.5 | 1792 | $950 | $0.53 | 43d | 1 | 1.45mi |
| 1909 Holbrook Ave Bessemer, AL | 2.0 | 1.0 | 1064 | $930 | $0.87 | 43d | 1 | 1.49mi |
Listing history 17 events
-
2026-06-18days on market $90,000 Active 180 DOM
-
2026-06-17days on market $90,000 Active 179 DOM
-
2026-06-16days on market $90,000 Active 178 DOM
-
2026-06-15days on market $90,000 Active 177 DOM
-
2026-06-13days on market $90,000 Active 175 DOM
-
2026-06-10days on market $90,000 Active 172 DOM
-
2026-06-09days on market $90,000 Active 171 DOM
-
2026-06-08days on market $90,000 Active 170 DOM
-
2026-06-07days on market $90,000 Active 169 DOM
-
2026-06-03days on market $90,000 Active 165 DOM
-
2026-06-02days on market $90,000 Active 164 DOM
-
2026-06-01days on market $90,000 Active 163 DOM
-
2026-05-31days on market $90,000 Active 162 DOM
-
2026-05-01price $90,000 415-char remark
Show marketing remark (415 chars)
Property is owner-occupied. Advance notice required for all showings. Small dog on premises—please do not let pet out and ensure all doors are secured. Property may function as a multi-family or shared-living layout, with shared kitchen and bathroom areas. Buyer to verify zoning, permitted use, and suitability for intended purpose. All information, including square footage and use, to be verified by buyer.
-
2026-04-21price $95,000 415-char remark
Show marketing remark (415 chars)
Property is owner-occupied. Advance notice required for all showings. Small dog on premises—please do not let pet out and ensure all doors are secured. Property may function as a multi-family or shared-living layout, with shared kitchen and bathroom areas. Buyer to verify zoning, permitted use, and suitability for intended purpose. All information, including square footage and use, to be verified by buyer.
-
2026-03-27price $100,000 415-char remark
Show marketing remark (415 chars)
Property is owner-occupied. Advance notice required for all showings. Small dog on premises—please do not let pet out and ensure all doors are secured. Property may function as a multi-family or shared-living layout, with shared kitchen and bathroom areas. Buyer to verify zoning, permitted use, and suitability for intended purpose. All information, including square footage and use, to be verified by buyer.
-
2025-12-20$110,000 Active 415-char remark
Show marketing remark (415 chars)
Property is owner-occupied. Advance notice required for all showings. Small dog on premises—please do not let pet out and ensure all doors are secured. Property may function as a multi-family or shared-living layout, with shared kitchen and bathroom areas. Buyer to verify zoning, permitted use, and suitability for intended purpose. All information, including square footage and use, to be verified by buyer.
ⓘ Source: listings_history table (triggers on properties + properties_extension) + one-shot
backfill from property_details.listing_events for pre-trigger history.
Tax reassessment forecast AL · Resets to sale price
- Current annual tax
- $267 · $22/mo
- Projected year-2 tax
- $369 · $31/mo
- Expected delta
- +$102/yr (+$9/mo · 38.4%)
ⓘ Screening estimate from a state-policy table — verify with the county assessor before closing.
Climate risk First Street
- Flood 1/10 Low FEMA zone X (unshaded) · 0% chance over 30 yrs
- Wildfire 2/10 Low
- Heat 6/10 Major 7 d/yr ≥108°F today · 19 d/yr by 30 yrs out
- Wind 6/10 Major 46% chance of damaging wind over 30 yrs
- Air quality 3/10 Moderate 2 unhealthy d/yr today · 5 by 30 yrs out
Nearby sold comps map
Loading sold comps map…
Walkable amenities ~0.75 mi
Loading nearby amenities…
Taxation est. · year 1
- Rental income
- $13,408
- − Mortgage interest
- −$5,041
- − Property taxes
- −$267
- − Insurance
- −$450
- − Repairs & maintenance
- −$1,073
- − Management
- −$1,073
- − Depreciation
- −$2,618
- Taxable income
- $2,887
- Est. tax owed @ 24.0%
- −$693
- After-tax cash flow
- $3,519/yr
For passive investors: Depreciation is non-cash, so a rental often shows a tax loss while cash-flowing — sheltering income. Rental losses are passive: they offset passive income freely, and up to $25,000/yr can offset ordinary (W-2) income if you actively participate and your MAGI is under $100k (phasing out to $0 by $150k); unused losses carry forward. On sale, claimed depreciation is recaptured at up to 25%, and gains may owe capital-gains tax (a 1031 exchange can defer both). Figures are a year-1 estimate at your 24.0% rate — not tax advice; consult a CPA.
Schools (NCES district)
- District
- Jefferson County
- NCES district ID
- 0101920
- Math proficiency
- 9% ▼ -24.00%
- Reading proficiency
- 32% ▼ -5.00%
- Median HH income
- $51,712
- Composite
- 18.4/100
- National rank
- #8937
- State rank
- #104 of 129 in AL
Livability — Bessemer
- Score
- 59/100
- State rank
- #331
- US rank
- #20078
Category grades
Schools grade is shown separately in the Schools card above.
Census & demographics
- County
- Jefferson County · 527,445 people
- City population
- 48,018
- Metro
- Birmingham-Hoover, AL
- Population (ZIP)
- 24,892
- Household income
- $35,362
- Rent vs Own
- Severe rent burden
- 1001.0
Population outlook (Jefferson County) Hauer SSP2
- Today (2025)
- 669,185 people
- By 2030
- 669,694 · +0.1%
- By 2040
- 661,388 · -1.2%
- By 2050
- 643,086 · -3.9%
- By 2075
- 577,267 · -13.7%
- By 2100
- 474,758 · -29.1%
Race, ethnicity, and origin ACS 2023
- Neighborhood character
- Predominantly Black (74%)
- Race & ethnicity
- Black 74% Hispanic / Latino 13% White 11% Two or more races 6%
- Hispanic origin (detail)
- Mexican 10%
- Foreign-born
- 5% · Canada
- Languages at home
- 89% English-only · Spanish 11%
Political lean MEDSL · Jefferson
- 2024 margin
- D (+10.4) · D 54.6% · R 44.2% · Other 1.2%
- 2008→2024 swing
- +5.4pp toward D · 2008: 5.1pp · 2024: 10.4pp
- All cycles
- 2024: D+10.4 2020: D+13.2 2016: D+7.2 2012: D+6.0 2008: D+5.1
Not yet ingested
- Civics
- —
Market trends
- HPI YoY
- ▼ -57.54%
- Current HPI
- 179.7702
- Rent YoY
- ▼ -3.12%
- Metro
- Birmingham-Hoover, AL
- State GDP YoY
- ▲ 2.94%
- F500 in state
- 4
Industry mix (Fortune 500 HQ in AL)
| Industry | F500 HQs | Revenue |
|---|---|---|
| Financial Services | 1 | $8B |
|
||
| Healthcare | 1 | $5B |
|
||
Price history
-18.2% since first listed4 events — show timeline
- 2026-05-01 Price Changed $90,000 Greater Alabama MLS
- 2026-04-21 Price Changed $95,000 Greater Alabama MLS
- 2026-03-27 Price Changed $100,000 Greater Alabama MLS
- 2025-12-20 Listed $110,000 Greater Alabama MLS
Property tax history
+7.9%/yrLatest (2025): $267 · +0.0% YoY. Source: county tax records.
Cash-flow waterfall
monthlySold comps — $/sqft
last 12 mo · ≤1 miLoading sold comps…