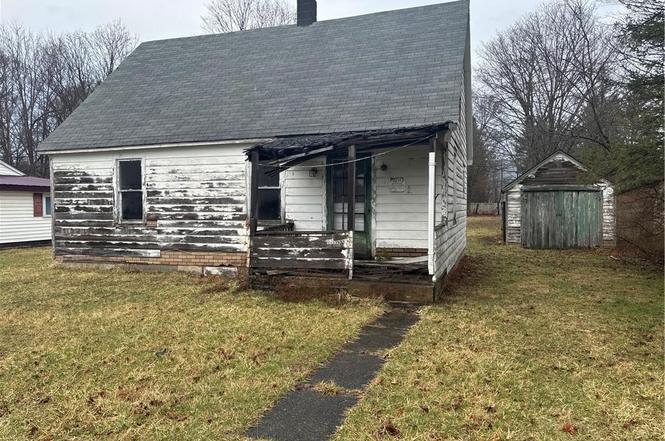
17 Seaman Pl · Savona, NY
Flood risk 1/10 · Minimal
- FEMA flood zone
- X
- Chance of flooding over 30 yrs
- 0.0%
- Est. flood insurance / yr
- $473 – $860
Fire risk 2/10 · Minimal
- Est. fire insurance / yr
- $691 – $1,283
Heat risk 3/10 · Minor
- Hot days now (above 93°F)
- 7 days/yr
- Hot days in 30 yrs
- 17 days/yr
Wind risk 1/10 · Minimal
- Chance of severe wind over 30 yrs
- —
Air-quality risk 1/10 · Minimal
- Unhealthy air days now
- 0 days/yr
- Unhealthy air days in 30 yrs
- 0 days/yr
Risk factors via First Street. Map © Google.
Why this score? — see what drove the B+ grade
The composite is a weighted blend of 9 inputs, each scored 0–100. Each bar is that input's sub-score; the figure is the points it added to the 100-point composite (weight × sub-score).
- Cash flow +30.0/30.0
- 1% rule +10.0/10.0
- DSCR +10.0/10.0
- ARV discount +7.5/15.0
- Appreciation +7.3/10.0
- Schools +4.5/10.0
- Livability +2.9/5.0
- Rent growth +2.5/5.0
- Condition / age +2.5/5.0
$50,000
🖨 Deal sheet 📄 Offer letter ✓ Due diligence
Listing remarks MLS
Opportunity awaits with this rural property set on a spacious lot in upstate New York. The existing home offers a footprint ready for renovation or potential redevelopment, along with a detached garage for additional storage or workshop space. The level yard provides ample room for outdoor use, gardening, or future improvements. Property is being sold as-is, where-is, with all contents remaining. Condition of utilities and systems is unknown. Cash or rehab financing likely required.
Key facts
- 0.35 acre lot
- Garage
- Built 1950
Neighborhood map
What this means for you Summary
Snapshot
- This is a 3-bed/1.0-bath single-family listed at $50k.
Deal economics
- At list price, monthly cash flow is $485 ($6k/yr) — positive.
- The deal already cash-flows at list — no discount required.
- Meets the 1% rule at list price ($1k rent vs $50k).
Location & tenants
- Location reads 58/100 on livability (#1,050 in NY) — a working-class tenant base; expect higher turnover. Strengths: cost of living A+, housing A+; Watch: health & safety D, schools D-, crime F.
- Campbell-Savona Central School District (rural): math 50% / reading 56% proficiency, ranked #334 of 590 in NY (top 57%) — acceptable for families but not a draw, mixed tenant base, ~2y average lease.
- Market conditions: 11 active listings in the ZIP; 196 units permitted in Steuben County in 2024 (0 in 5+ unit buildings).
Forward outlook
- In year one you build about $3k of equity ($346 loan paydown + $2k appreciation (4.6% local appreciation)).
- Steuben County population projected at -20% by 2050 — secular population decline; favor cash flow + early exit over multi-decade hold.
- At projected returns (4.6% appreciation + 3.0% rent growth), your $14k cash investment doubles in ~2 years — after that, you're playing with house money.
Negotiation context
- Only 1 days on market — expect competitive offers; lowballing is unlikely to land.
Risks & watch-outs
- Watch-outs: built in 1950 — expect roof / HVAC / electrical / plumbing capex.
Questions for the listing agent
- Built in 1950 — when were the roof, HVAC, electrical panel, plumbing, and water heater last replaced?
- Is there a deadline driving the sale (1031 exchange, divorce, estate, relocation)? That informs how much negotiation room exists.
- Schools are D-rated, which usually means shorter tenancies and higher turnover. Who's the typical renter profile here, and what's been the actual vacancy rate?
- Crime grade is F in this area — have there been break-ins, vandalism, or insurance claims at this property in the last 3 years? What carrier currently insures it and at what premium?
- What's the average days-on-market for RENTAL listings here right now (not sales)? A rising rental-DOM trend means longer vacancies and softer asking-rent achievability than the comps imply.
- What's the recent tenant-quality profile in this submarket — average credit score on applications, eviction rate, late-payment / NSF rate, and stable-employment percentage? A property-management company in the area should have these aggregated.
- How much new for-sale + rental construction is in the pipeline within 1–3 miles? Heavy new supply typically softens prices + rents 12–24 months out; constrained supply supports both.
Investment metrics
- 1% rule
- 2.18% ✓
- Cap rate
- 17.94%
- Cash-on-cash
- 41.60%
- DSCR
- 2.85
- GRM
- 3.8
CMA / ARV
- ARV (median comp)
- $114,445
- List price
- $50,000
- Delta
- -56.31%
- Verdict
- UNDERPRICED
- Comps
- 5 within 1.0 mi
Show comp detail 1 sale within ~0.75 mi
| Address | Dist | Beds/Ba | Sqft | Sold | Price | $/sf | Match |
|---|---|---|---|---|---|---|---|
| 5 Church St | 0.40mi | 2/1.0 (-1) | 944 (-13%) | 18mo | $47,000 | $50 | 40 |
Match score weights: distance 35% · size 25% · config 20% · recency 20%. Top-matched comps best support the ARV.
Projected returns pro-forma
4.56% appreciation · 3.0% rent growth · sell at horizon
- IRR
- 49.2%
- Equity multiple
- 3.95×
- Total profit
- $41,232
- Equity at exit
- $27,017
- IRR
- 47.4%
- Equity multiple
- 8.04×
- Total profit
- $98,613
- Equity at exit
- $45,573
Cash invested: $14,000 (down + closing). Projections, not guarantees.
Landlord ↔ Tenant lean methodology
- Overall (STATE)
- 15 Strongly Tenant-Friendly
- State New York
- 15 Strongly Tenant-Friendly · D+10
- County
- — inherits STATE
- City
- — inherits STATE
ZIP-level market 14879
- Home prices YoY
- 2.3%
- Active inventory
- 11
- Price-to-rent
- 3.8×
Monthly cashflow live
- Estimated rent
- $1,091 medium interval (Pro) →
- Mortgage (P&I)
- −$262
- Tax from tax record
- −$94 /mo · $1,122/yr
- Insurance
- −$21
- HOA
- −$0
- Vacancy / Maint / Mgmt
- −$229
- Net cashflow
- $485
Break-even live
UW: 25.0% down · 7.5% · 30yr · 1.5% tax · 5.0% vac · 8.0% maint · 8.0% mgmt
Financing live
Cash to close
- Down payment
- $12,500
- Closing costs
- $1,500
- Reserves months
- —
- Total cash needed
- —
Loan-product check · same deal, 3 products live
Conventional
25% down · 7.5% · 30yr
- Down + closing
- —
- Monthly P&I
- —
- Monthly cashflow
- —
- DSCR
- —
- Eligible?
- —
Personal DTI + credit; lowest rate.
DSCR
20% down · 8.5% · 30yr
- Down + closing
- —
- Monthly P&I
- —
- Monthly cashflow
- —
- DSCR
- —
- Eligible?
- —
No personal income docs; deal must DSCR.
Hard money
10% down · 12.0% · 12mo
- Down + closing
- —
- Monthly P&I
- —
- Monthly cashflow
- —
- DSCR
- —
- Eligible?
- —
Short-term bridge; refi at stabilization.
Listing history 15 events
-
2026-06-19days on market $50,000 Active 1 DOM
-
2026-06-18days on market $50,000 Active 88 DOM
-
2026-06-17days on market $50,000 Active 87 DOM
-
2026-06-16days on market $50,000 Active 86 DOM
-
2026-06-15days on market $50,000 Active 85 DOM
-
2026-06-14days on market $50,000 Active 83 DOM
-
2026-06-12days on market $50,000 Active 82 DOM
-
2026-06-09days on market $50,000 Active 79 DOM
-
2026-06-08days on market $50,000 Active 78 DOM
-
2026-06-07days on market $50,000 Active 77 DOM
-
2026-06-02days on market $50,000 Active 72 DOM
-
2026-06-01days on market $50,000 Active 71 DOM
-
2026-05-31days on market $50,000 Active 70 DOM
-
2026-05-30days on market $50,000 Active 69 DOM
-
2026-03-22$50,000 Active 487-char remark
Show marketing remark (487 chars)
Opportunity awaits with this rural property set on a spacious lot in upstate New York. The existing home offers a footprint ready for renovation or potential redevelopment, along with a detached garage for additional storage or workshop space. The level yard provides ample room for outdoor use, gardening, or future improvements. Property is being sold as-is, where-is, with all contents remaining. Condition of utilities and systems is unknown. Cash or rehab financing likely required.
ⓘ Source: listings_history table (triggers on properties + properties_extension) + one-shot
backfill from property_details.listing_events for pre-trigger history.
Tax reassessment forecast NY · Partial reset (capped growth)
- Current annual tax
- $1,122 · $94/mo
- Projected year-2 tax
- $1,122 · $94/mo
- Expected delta
- $0/yr ($0/mo · 0.0%)
ⓘ Screening estimate from a state-policy table — verify with the county assessor before closing.
Climate risk First Street
- Flood 1/10 Low FEMA zone X · 0% chance over 30 yrs
- Wildfire 2/10 Low
- Heat 3/10 Moderate 7 d/yr ≥93°F today · 17 d/yr by 30 yrs out
- Wind 1/10 Low
- Air quality 1/10 Low 0 unhealthy d/yr today · 0 by 30 yrs out
Nearby sold comps map
Loading sold comps map…
Walkable amenities ~0.75 mi
Loading nearby amenities…
Taxation est. · year 1
- Rental income
- $13,092
- − Mortgage interest
- −$2,801
- − Property taxes
- −$1,122
- − Insurance
- −$250
- − Repairs & maintenance
- −$1,047
- − Management
- −$1,047
- − Depreciation
- −$1,455
- Taxable income
- $5,370
- Est. tax owed @ 24.0%
- −$1,289
- After-tax cash flow
- $4,535/yr
For passive investors: Depreciation is non-cash, so a rental often shows a tax loss while cash-flowing — sheltering income. Rental losses are passive: they offset passive income freely, and up to $25,000/yr can offset ordinary (W-2) income if you actively participate and your MAGI is under $100k (phasing out to $0 by $150k); unused losses carry forward. On sale, claimed depreciation is recaptured at up to 25%, and gains may owe capital-gains tax (a 1031 exchange can defer both). Figures are a year-1 estimate at your 24.0% rate — not tax advice; consult a CPA.
Schools (NCES district)
- District
- Campbell-Savona Central School District
- NCES district ID
- 3600020
- Math proficiency
- 50% ▬ 0.00%
- Reading proficiency
- 56% ▲ 12.00%
- Median HH income
- $49,653
- Composite
- 45.22/100
- National rank
- #2667
- State rank
- #334 of 590 in NY
Livability — Savona
- Score
- 58/100
- State rank
- #1050
- US rank
- #20815
Category grades
Schools grade is shown separately in the Schools card above.
Census & demographics
- Census place
- Savona, NY
- Population (ZIP)
- 2,345
Population outlook (Steuben County) Hauer SSP2
- Today (2025)
- 93,062 people
- By 2030
- 89,793 · -3.5%
- By 2040
- 82,353 · -11.5%
- By 2050
- 74,286 · -20.2%
- By 2075
- 55,589 · -40.3%
- By 2100
- 37,587 · -59.6%
Race, ethnicity, and origin ACS 2023
- Neighborhood character
- Predominantly White (94%)
- Race & ethnicity
- White 94% Two or more races 5%
- Common ancestry
- Subsaharan African 4% Romanian 4% Italian 3%
- Foreign-born
- 1%
- Languages at home
- 99% English-only · Tagalog/Filipino 1%
Political lean MEDSL · Steuben
- 2024 margin
- Solid R (+31.8) · D 34.1% · R 65.9%
- 2008→2024 swing
- -15.0pp toward R · 2008: -16.8pp · 2024: -31.8pp
- All cycles
- 2024: R+31.8 2020: R+29.6 2016: R+36.2 2012: R+16.4 2008: R+16.8
Not yet ingested
- Civics
- —
Market trends
- HPI YoY
- ▲ 4.56%
- Current HPI
- 206.0792
- Rent YoY
- —
- Metro
- —
- State GDP YoY
- ▲ 2.60%
- F500 in state
- 92
Industry mix (Fortune 500 HQ in NY)
| Industry | F500 HQs | Revenue |
|---|---|---|
| Financial Services | 10 | $950B |
|
||
| Consumer Goods | 9 | $162B |
|
||
| Insurance | 4 | $225B |
|
||
| Telecommunications | 2 | $144B |
|
||
| Pharmaceuticals | 2 | $112B |
|
||
| Media / Entertainment | 2 | $69B |
|
||
Price history
1 event — show timeline
- 2026-03-22 Listed $50,000 UNYREIS
Property tax history
-1.9%/yrLatest (2025): $1,122 · +0.5% YoY. Source: county tax records.
Cash-flow waterfall
monthlySold comps — $/sqft
last 12 mo · ≤1 miLoading sold comps…