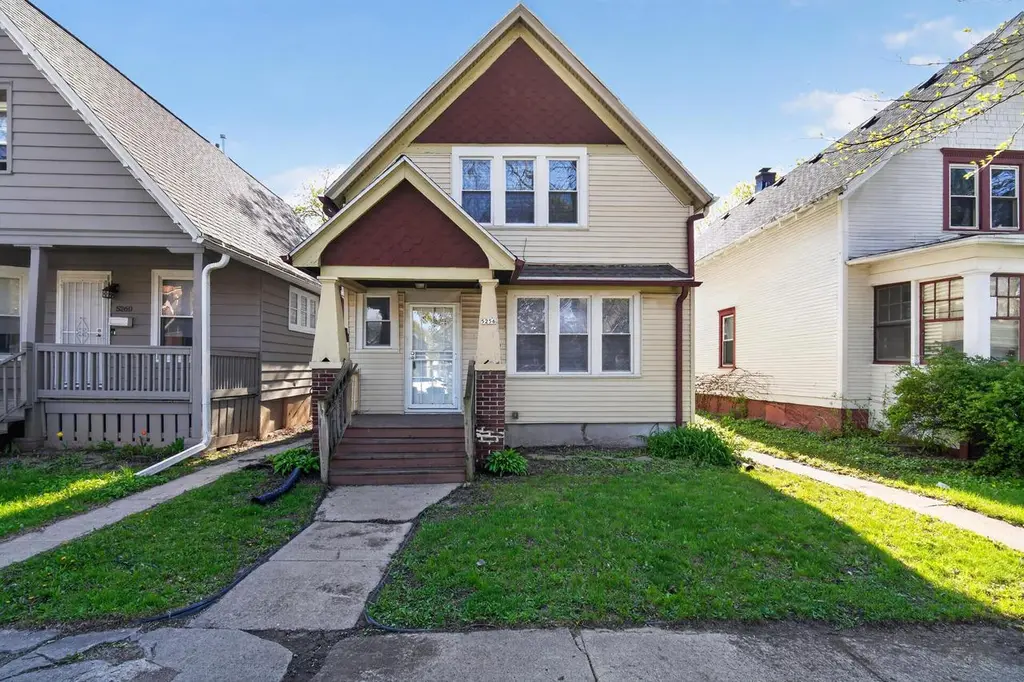
5256 N 36th St · Milwaukee, WI
Flood risk 1/10 · Minimal
- FEMA flood zone
- X (unshaded)
- Chance of flooding over 30 yrs
- 0.0%
- Est. flood insurance / yr
- $473 – $860
Fire risk 1/10 · Minimal
- Est. fire insurance / yr
- $636 – $1,182
Heat risk 2/10 · Minimal
- Hot days now (above 98°F)
- 7 days/yr
- Hot days in 30 yrs
- 13 days/yr
Wind risk 2/10 · Minimal
- Chance of severe wind over 30 yrs
- —
Air-quality risk 2/10 · Minimal
- Unhealthy air days now
- 2 days/yr
- Unhealthy air days in 30 yrs
- 2 days/yr
Risk factors via First Street. Map © Google.
Why this score? — see what drove the C grade
The composite is a weighted blend of 9 inputs, each scored 0–100. Each bar is that input's sub-score; the figure is the points it added to the 100-point composite (weight × sub-score).
- Cash flow +27.6/30.0
- DSCR +9.7/10.0
- 1% rule +7.8/10.0
- Rent growth +4.7/5.0
- Livability +4.0/5.0
- Condition / age +2.5/5.0
- Schools +1.2/10.0
- ARV discount +0.0/15.0
- Appreciation +0.0/10.0
$144,900
🖨 Deal sheet 📄 Offer letter ✓ Due diligence
Listing remarks MLS
One party listing. This was sold as a bulk package - see MLS 1729110 and 1729112.
Key facts
- Bright kitchen
- Hardwood floors
- Detached garage
Tags
Property features AI
Exterior
- Parking: Detached 1-car garage
- Utilities: Municipal water; Municipal sewer
- Home design: 1.5-story single-family home; Zoned RT3 Residential; Lot of about 0.11 acres (less than 1/2 acre)
- Construction: Year built from assessor/public record
- Exterior features: Vinyl siding; Other exterior materials
Interior
- Bedrooms: Primary bedroom (upper level) — 13 x 9; Bedroom 2 (main level) — 8 x 10; Bedroom 3 (upper level) — 10 x 8; Bedroom 4 (upper level) — 10 x 12; Bedroom 5 (upper level) — 10 x 8
- Bathrooms: 2 full bathrooms
- Heating & cooling: Forced air heating; Natural gas fuel
- Interior features: Full, partially finished basement
Neighborhood map
What this means for you Summary
Snapshot
- This is a 5-bed/2.0-bath single-family listed at $145k.
Deal economics
- At list price, monthly cash flow is $432 ($5k/yr) — positive.
- The deal already cash-flows at list — no discount required.
- Meets the 1% rule at list price ($2k rent vs $145k).
- Recommended offer: $141k (3.0% below list) — sets the bar for market timing.
- Cap rate 9.9% vs local median 5.1% in Milwaukee — top-decile yield for the area; either an underpriced asset or a hidden risk that comps aren't pricing in. Stress-test before assuming the spread holds.
Location & tenants
- Location reads 81/100 on livability (#55 in WI, #1,534 nationally) — a professional / high-income tenant draw. Strengths: amenities A+, commute A+, cost of living A+; Watch: employment D+, schools F, crime F.
- Milwaukee School District (urban): math 10% / reading 18% proficiency, ranked #337 of 342 in WI (top 98%) — low school quality limits family demand, transient renter base, plan for 1-2y turnover; 77% free/reduced lunch — lower-income household profile, screen leases tightly.
- Market conditions: Rents rising fast (+8.6%/yr); 168 active listings in the ZIP; 4 comparable units currently listed for rent nearby; rentals at typical pace (median 24d on market — plan ~3-4 weeks tenant-placement turnaround); 1,017 units permitted in Milwaukee County in 2024 (803 in 5+ unit buildings).
- At $1,850/mo this rent would consume 46% of the median local household income ($48k/yr) (locally 3390% of renters already pay >50% of income on rent) — very limited rent-growth headroom before tenants either downsize or default.
Forward outlook
- Local home prices are declining (-3.0%/yr); year-one equity from $1k of loan paydown is wiped out by about $4k of value loss. Plan a longer hold.
- Milwaukee County population projected at +4% by 2050 — modest demand growth; plan on rents tracking national, not racing it.
- At projected returns (-3.0% appreciation + 8.0% rent growth), your $41k cash investment doubles in ~7 years — after that, you're playing with house money.
Negotiation context
- It's been on market 41 days — a 3% lower offer ($141k) is reasonable based on typical stale-listing flexibility.
- 11 sale attempts since 13y ago with the ask held roughly flat each time — persistent listings suggest the price (not the market) is what's stuck; bring a comps-based counter.
Risks & watch-outs
- Watch-outs: built in 1901 — expect roof / HVAC / electrical / plumbing capex.
Questions for the listing agent
- It's been on market 41 days. Have you received any prior offers? Is the seller open to a 3% concession, seller financing, or rate buy-down credit?
- Built in 1901 — when were the roof, HVAC, electrical panel, plumbing, and water heater last replaced?
- Is there a deadline driving the sale (1031 exchange, divorce, estate, relocation)? That informs how much negotiation room exists.
- Schools are F-rated, which usually means shorter tenancies and higher turnover. Who's the typical renter profile here, and what's been the actual vacancy rate?
- Crime grade is F in this area — have there been break-ins, vandalism, or insurance claims at this property in the last 3 years? What carrier currently insures it and at what premium?
- What's the average days-on-market for RENTAL listings here right now (not sales)? A rising rental-DOM trend means longer vacancies and softer asking-rent achievability than the comps imply.
- What's the recent tenant-quality profile in this submarket — average credit score on applications, eviction rate, late-payment / NSF rate, and stable-employment percentage? A property-management company in the area should have these aggregated.
- How much new for-sale + rental construction is in the pipeline within 1–3 miles? Heavy new supply typically softens prices + rents 12–24 months out; constrained supply supports both.
Investment metrics
- 1% rule
- 1.28% ✓
- Cap rate
- 9.87%
- Cash-on-cash
- 12.77%
- DSCR
- 1.57
- GRM
- 6.5
CMA / ARV
- ARV (median comp)
- $121,631
- List price
- $144,900
- Delta
- 19.13%
- Verdict
- OVERPRICED
- Comps
- 20 within 1.0 mi
Show comp detail 12 sales within ~0.75 mi
| Address | Dist | Beds/Ba | Sqft | Sold | Price | $/sf | Match |
|---|---|---|---|---|---|---|---|
| 5378 N 36th St | 0.16mi | 4/2.0 (-1) | 1,345 (-2%) | 1mo | $165,000 | $123 | 83 |
| 5324 N 34th St | 0.15mi | 4/1.0 (-1) | 1,324 (-4%) | 2mo | $75,000 | $57 | 76 |
| 5354 N 34th St | 0.18mi | 4/1.0 (-1) | 1,324 (-4%) | 11mo | $93,400 | $71 | 67 |
| 3223 W Fairmount Ave | 0.40mi | 4/1.0 (-1) | 1,358 (-2%) | 3mo | $124,000 | $91 | 67 |
| 5403 N 37th St | 0.20mi | 4/1.5 (-1) | 1,498 (+9%) | 4mo | $129,000 | $86 | 66 |
| 4025 W Fairmount Ave | 0.47mi | 4/2.0 (-1) | 1,350 (-2%) | 4mo | $151,000 | $112 | 66 |
| 3726 W Fairmount Ave | 0.35mi | 4/1.0 (-1) | 1,411 (+2%) | 7mo | $75,000 | $53 | 65 |
| 2710 W Fairmount Ave | 0.62mi | 5/1.0 | 1,392 (+1%) | 11mo | $180,000 | $129 | 56 |
| 5402 N 41st St | 0.35mi | 4/1.5 (-1) | 1,522 (+10%) | 4mo | $145,000 | $95 | 56 |
| 4841 N 39th St | 0.57mi | 4/2.0 (-1) | 1,444 (+5%) | 8mo | $87,900 | $61 | 53 |
| 5527 N 34th St | 0.35mi | 4/1.5 (-1) | 1,201 (-13%) | 6mo | $85,000 | $71 | 50 |
| 3918 W Hampton Ave | 0.62mi | 4/1.5 (-1) | 1,543 (+12%) | 9mo | $160,000 | $104 | 36 |
Match score weights: distance 35% · size 25% · config 20% · recency 20%. Top-matched comps best support the ARV.
Projected returns pro-forma
-3.0% appreciation · 8.0% rent growth · sell at horizon
- IRR
- 8.2%
- Equity multiple
- 1.34×
- Total profit
- $13,834
- Equity at exit
- $21,605
- IRR
- 21.4%
- Equity multiple
- 3.27×
- Total profit
- $92,134
- Equity at exit
- $12,528
Cash invested: $40,572 (down + closing). Projections, not guarantees.
Landlord ↔ Tenant lean methodology
- Overall (STATE)
- 73 Landlord-Friendly
- State Wisconsin
- 73 Landlord-Friendly · R+2
- County
- — inherits STATE
- City
- — inherits STATE
ZIP-level market 53209
- Rents YoY
- 8.6%
- Active inventory
- 168
- Price-to-rent
- 6.5×
Monthly cashflow live
- Estimated rent
- $1,850 medium interval (Pro) →
- Mortgage (P&I)
- −$760
- Tax from tax record
- −$210 /mo · $2,518/yr
- Insurance
- −$60
- HOA
- −$0
- Vacancy / Maint / Mgmt
- −$389
- Net cashflow
- $432
Break-even live
UW: 25.0% down · 7.5% · 30yr · 1.5% tax · 5.0% vac · 8.0% maint · 8.0% mgmt
Financing live
Cash to close
- Down payment
- $36,225
- Closing costs
- $4,347
- Reserves months
- —
- Total cash needed
- —
Loan-product check · same deal, 3 products live
Conventional
25% down · 7.5% · 30yr
- Down + closing
- —
- Monthly P&I
- —
- Monthly cashflow
- —
- DSCR
- —
- Eligible?
- —
Personal DTI + credit; lowest rate.
DSCR
20% down · 8.5% · 30yr
- Down + closing
- —
- Monthly P&I
- —
- Monthly cashflow
- —
- DSCR
- —
- Eligible?
- —
No personal income docs; deal must DSCR.
Hard money
10% down · 12.0% · 12mo
- Down + closing
- —
- Monthly P&I
- —
- Monthly cashflow
- —
- DSCR
- —
- Eligible?
- —
Short-term bridge; refi at stabilization.
Rent comps 4 comps
| Address | Beds | Baths | Sqft | Rent | $/sqft | DOM | Units | Dist |
|---|---|---|---|---|---|---|---|---|
| 4334 W Eggert Pl Milwaukee, WI | 4.0 | 1.0 | 1077 | $1,695 | $1.57 | 23d | 1 | 0.55mi |
| 4340 W Eggert Pl Milwaukee, WI | 4.0 | 1.0 | 1066 | $1,695 | $1.59 | 23d | 1 | 0.56mi |
| 5696 N 42nd St Milwaukee, WI | 4.0 | 1.0 | 1023 | $1,495 | $1.46 | 23d | 1 | 0.69mi |
| 5073 N 48th St Milwaukee, WI | 4.0 | 1.0 | 1152 | $1,595 | $1.38 | 14d | 1 | 0.83mi |
Listing history 39 events
-
2026-06-18days on market $144,900 Active 41 DOM
-
2026-06-17days on market $144,900 Active 40 DOM
-
2026-06-16days on market $144,900 Active 39 DOM
-
2026-06-15days on market $144,900 Active 38 DOM
-
2026-06-13days on market $144,900 Active 36 DOM
-
2026-06-13days on market $144,900 Active 35 DOM
-
2026-06-09days on market $144,900 Active 32 DOM
-
2026-06-08days on market $144,900 Active 31 DOM
-
2026-06-07days on market $144,900 Active 30 DOM
-
2026-06-05days on market $144,900 Active 27 DOM
-
2026-06-03days on market $144,900 Active 26 DOM
-
2026-06-02days on market $144,900 Active 25 DOM
-
2026-06-01days on market $144,900 Active 24 DOM
-
2026-05-31days on market $144,900 Active 23 DOM
-
2026-05-08$144,900 Active 660-char remark
-
2024-08-29soldstatus $934,300
-
2021-03-09soldstatus $70,000
-
2021-03-04soldstatus $69,000 81-char remark
Show marketing remark (81 chars)
One party listing. This was sold as a bulk package - see MLS 1729110 and 1729112.
-
2021-02-13$75,000 81-char remark
Show marketing remark (81 chars)
One party listing. This was sold as a bulk package - see MLS 1729110 and 1729112.
-
2019-08-03historical
Show marketing remark (185 chars)
This classic Milwaukee house is a proven rental property. Great for investors who are looking to expand their portfolio or those wishing to purchase their first home. Take a look today!
-
2019-06-13status Active
Show marketing remark (185 chars)
This classic Milwaukee house is a proven rental property. Great for investors who are looking to expand their portfolio or those wishing to purchase their first home. Take a look today!
-
2019-06-12historical
Show marketing remark (185 chars)
This classic Milwaukee house is a proven rental property. Great for investors who are looking to expand their portfolio or those wishing to purchase their first home. Take a look today!
-
2019-05-06$79,900 Active
Show marketing remark (185 chars)
This classic Milwaukee house is a proven rental property. Great for investors who are looking to expand their portfolio or those wishing to purchase their first home. Take a look today!
-
2014-06-12historical
-
2014-06-12$12,000
-
2014-06-06soldstatus $5,000
-
2014-02-25$97,900
-
2014-02-25historical
-
2014-02-18historical
-
2014-02-18$15,000
-
2013-02-02$102,900
-
2013-02-02historical
-
2013-02-02$104,900
-
2013-02-02historical
-
2013-01-31historical
-
2013-01-31$50,000
-
2013-01-11historical
-
2013-01-11$24,900
-
2005-07-28soldstatus $60,000
ⓘ Source: listings_history table (triggers on properties + properties_extension) + one-shot
backfill from property_details.listing_events for pre-trigger history.
Tax reassessment forecast WI · Partial reset (capped growth)
- Current annual tax
- $2,518 · $210/mo
- Projected year-2 tax
- $2,599 · $217/mo
- Expected delta
- +$81/yr (+$7/mo · 3.2%)
ⓘ Screening estimate from a state-policy table — verify with the county assessor before closing.
Climate risk First Street
- Flood 1/10 Low FEMA zone X (unshaded) · 0% chance over 30 yrs
- Wildfire 1/10 Low
- Heat 2/10 Low 7 d/yr ≥98°F today · 13 d/yr by 30 yrs out
- Wind 2/10 Low
- Air quality 2/10 Low 2 unhealthy d/yr today · 2 by 30 yrs out
Nearby sold comps map
Loading sold comps map…
Walkable amenities ~0.75 mi
Loading nearby amenities…
Taxation est. · year 1
- Rental income
- $22,203
- − Mortgage interest
- −$8,117
- − Property taxes
- −$2,518
- − Insurance
- −$724
- − Repairs & maintenance
- −$1,776
- − Management
- −$1,776
- − Depreciation
- −$4,215
- Taxable income
- $3,076
- Est. tax owed @ 24.0%
- −$738
- After-tax cash flow
- $4,441/yr
For passive investors: Depreciation is non-cash, so a rental often shows a tax loss while cash-flowing — sheltering income. Rental losses are passive: they offset passive income freely, and up to $25,000/yr can offset ordinary (W-2) income if you actively participate and your MAGI is under $100k (phasing out to $0 by $150k); unused losses carry forward. On sale, claimed depreciation is recaptured at up to 25%, and gains may owe capital-gains tax (a 1031 exchange can defer both). Figures are a year-1 estimate at your 24.0% rate — not tax advice; consult a CPA.
Schools (NCES district)
- District
- Milwaukee School District
- NCES district ID
- 5509600
- Math proficiency
- 10% ▼ -5.00%
- Reading proficiency
- 18% ▬ 0.00%
- Median HH income
- $36,339
- Composite
- 11.61/100
- National rank
- #9696
- State rank
- #337 of 342 in WI
Livability — Milwaukee
- Score
- 81/100
- State rank
- #55
- US rank
- #1534
Category grades
Schools grade is shown separately in the Schools card above.
Census & demographics
- Census place
- Milwaukee, WI
- County
- Milwaukee County · 926,379 people
- City population
- 573,768
- Metro
- Milwaukee-Waukesha, WI
- Population (ZIP)
- 45,170
- Household income
- $48,486
- Rent vs Own
- Severe rent burden
- 3390.0
Population outlook (Milwaukee County) Hauer SSP2
- Today (2025)
- 995,758 people
- By 2030
- 1,009,124 · +1.3%
- By 2040
- 1,028,128 · +3.3%
- By 2050
- 1,040,066 · +4.4%
- By 2075
- 1,057,849 · +6.2%
- By 2100
- 1,039,774 · +4.4%
Race, ethnicity, and origin ACS 2023
- Neighborhood character
- Predominantly Black (66%)
- Race & ethnicity
- Black 66% White 22% Hispanic / Latino 5% Two or more races 5% Asian 2%
- Hispanic origin (detail)
- Mexican 2% Puerto Rican 3%
- Common ancestry
- Romanian 3% Portuguese 1% Iranian 1%
- Foreign-born
- 3% · Canada
- Languages at home
- 92% English-only · Spanish 4% Other Asian/Pacific 1% Russian/Polish/Slavic 1%
Political lean MEDSL · Milwaukee
- 2024 margin
- Solid D (+38.5) · D 68.3% · R 29.8% · Other 1.8%
- 2008→2024 swing
- +2.7pp toward D · 2008: 35.9pp · 2024: 38.5pp
- All cycles
- 2024: D+38.5 2020: D+39.9 2016: D+37.5 2012: D+34.6 2008: D+35.9
Not yet ingested
- Civics
- —
Market trends
- HPI YoY
- ▼ -194.98%
- Current HPI
- 172.4275
- Rent YoY
- ▲ 8.61%
- Metro
- Milwaukee-Waukesha, WI
- State GDP YoY
- ▲ 2.10%
- F500 in state
- 20
Industry mix (Fortune 500 HQ in WI)
| Industry | F500 HQs | Revenue |
|---|---|---|
| Industrial Machinery | 4 | $23B |
|
||
| Industrial Technology | 2 | $36B |
|
||
| Insurance | 1 | $36B |
|
||
| Professional Services | 1 | $19B |
|
||
| Utilities | 1 | $9B |
|
||
| Consumer Goods | 1 | $3B |
|
||
Price history
+141.5% since first listed25 events — show timeline
- 2026-05-08 Listed $144,900 METROMLS
- 2024-08-29 Sold (Public Records) $934,300 Public Records
- 2021-03-09 Sold (Public Records) $70,000 Public Records
- 2021-03-04 Sold (MLS) $69,000 METROMLS
- 2021-02-13 Listed $75,000 METROMLS
- 2019-08-03 Listing Removed — METROMLS
- 2019-06-13 Relisted — METROMLS
- 2019-06-12 Listing Removed — METROMLS
- 2019-05-06 Listed $79,900 METROMLS
- 2014-06-12 Listed $12,000 METROMLS
- 2014-06-12 Listing Removed — METROMLS
- 2014-06-06 Sold (MLS) $5,000 METROMLS
- 2014-02-25 Listing Removed — METROMLS
- 2014-02-25 Listed $97,900 METROMLS
- 2014-02-18 Listed $15,000 METROMLS
- 2014-02-18 Listing Removed — METROMLS
- 2013-02-02 Listing Removed — METROMLS
- 2013-02-02 Listed $102,900 METROMLS
- 2013-02-02 Listing Removed — METROMLS
- 2013-02-02 Listed $104,900 METROMLS
- 2013-01-31 Listed $50,000 METROMLS
- 2013-01-31 Listing Removed — METROMLS
- 2013-01-11 Listed $24,900 METROMLS
- 2013-01-11 Listing Removed — METROMLS
- 2005-07-28 Sold (Public Records) $60,000 Public Records
Property tax history
+11.4%/yrLatest (2024): $2,518 · +1.5% YoY. Source: county tax records.
Cash-flow waterfall
monthlySold comps — $/sqft
last 12 mo · ≤1 miLoading sold comps…