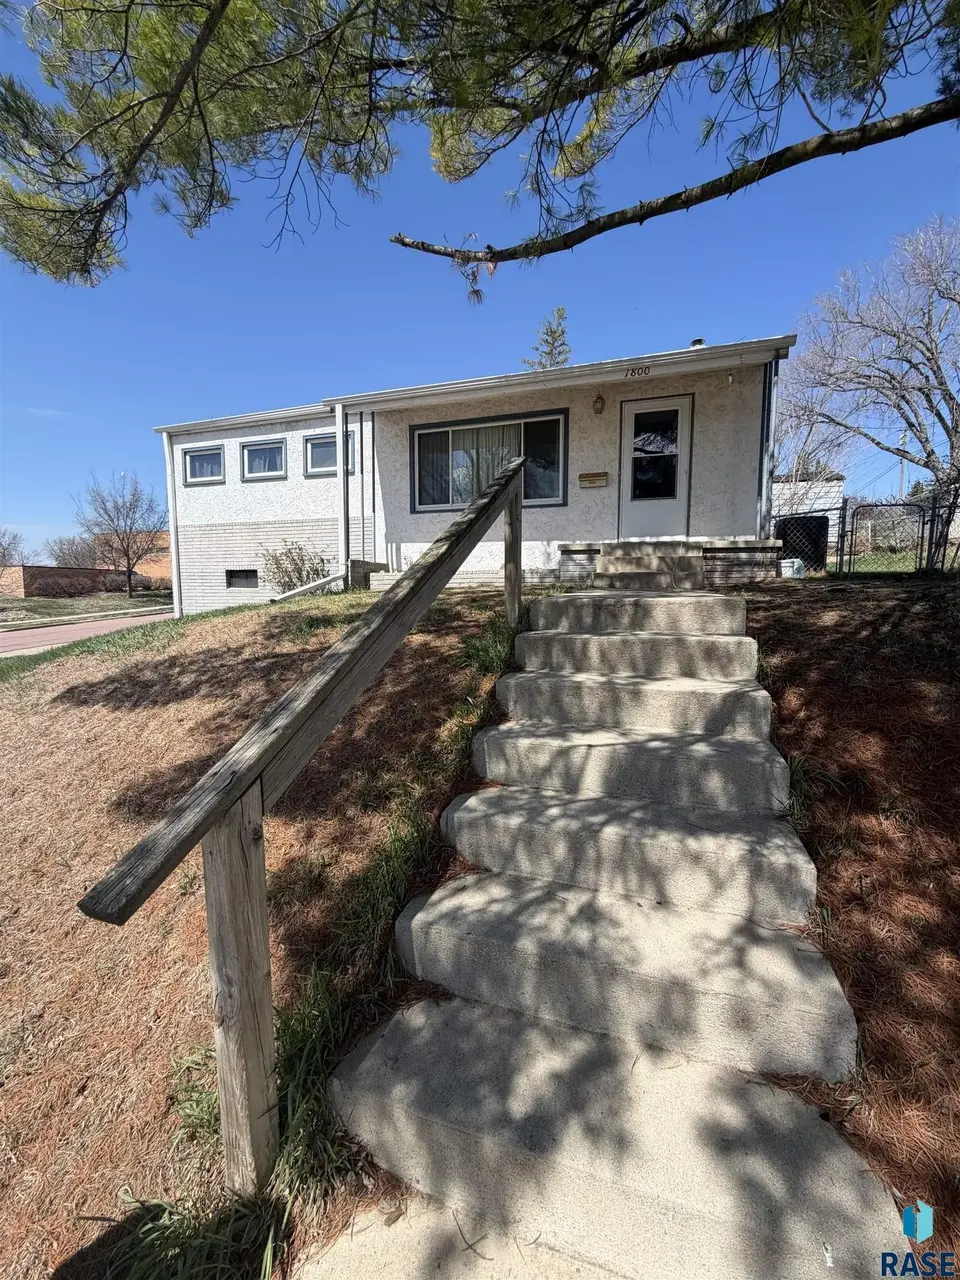
1800 E 13th St St · Sioux Falls, SD
Flood risk 1/10 · Minimal
- FEMA flood zone
- X (unshaded)
- Chance of flooding over 30 yrs
- 0.0%
- Est. flood insurance / yr
- $473 – $860
Fire risk 2/10 · Minimal
- Est. fire insurance / yr
- $1,342 – $2,492
Heat risk 2/10 · Minimal
- Hot days now (above 99°F)
- 7 days/yr
- Hot days in 30 yrs
- 14 days/yr
Wind risk 2/10 · Minimal
- Chance of severe wind over 30 yrs
- —
Air-quality risk 2/10 · Minimal
- Unhealthy air days now
- 1 days/yr
- Unhealthy air days in 30 yrs
- 1 days/yr
Risk factors via First Street. Map © Google.
Why this score? — see what drove the D- grade
The composite is a weighted blend of 9 inputs, each scored 0–100. Each bar is that input's sub-score; the figure is the points it added to the 100-point composite (weight × sub-score).
- Cash flow +8.9/30.0
- ARV discount +7.5/15.0
- Appreciation +5.0/10.0
- Livability +4.2/5.0
- Schools +3.7/10.0
- 1% rule +3.1/10.0
- Rent growth +2.5/5.0
- Condition / age +2.5/5.0
- DSCR +2.4/10.0
$135,000
🖨 Deal sheet (PDF) 📄 Offer letter ✓ Due diligence
Key facts
- 5,506 sq ft lot
- Garage
- Built 1956
Neighborhood map
What this means for you Summary
Snapshot
- This is a 3-bed/2.0-bath other listed at $135k.
Deal economics
- At list price, monthly cash flow is $-110 ($-1k/yr) — negative.
- To cash-flow at today's rent, offer at most $116k (14.4% below list).
- To meet the 1% rule (rent ≥ 1% of price), the offer needs to be $109k (19.1% below list).
- Recommended offer: $109k (19.1% below list) — sets the bar for 1% rule.
- Cap rate 5.3% vs local median 2.6% in Sioux Falls — top-decile yield for the area; either an underpriced asset or a hidden risk that comps aren't pricing in. Stress-test before assuming the spread holds.
Location & tenants
- Location reads 85/100 on livability (#3 in SD, #610 nationally) — a professional / high-income tenant draw. Strengths: amenities A+, commute A+, cost of living A+; Watch: crime F.
- Sioux Falls School District 49-5 (urban): math 39% / reading 48% proficiency, ranked #45 of 59 in SD (top 76%) — families likely to look elsewhere, expect single-tenant / working-renter base with shorter leases.
- Zoned schools: Eugene Field A+ Elementary - 16 (math 37% / reading 42%, grade F, #169 of 253 statewide, top 71%, 413 students, 30% FRL); Whittier Middle School - 08 (math 14% / reading 26%, grade F, #133 of 143 statewide, top 93%, 704 students, 70% FRL); Washington High School - 01 (math 33% / reading 57%, grade D-, #110 of 151 statewide, top 73%, 1,910 students, 39% FRL).
- Market conditions: 1 active listings in the ZIP; 40 comparable units currently listed for rent nearby; rentals at typical pace (median 23d on market — plan ~3-4 weeks tenant-placement turnaround); 2,425 units permitted in Minnehaha County in 2024 (1,367 in 5+ unit buildings).
Forward outlook
- In year one you build about $5k of equity ($933 loan paydown + $4k appreciation (3.0% local appreciation)).
- Minnehaha County population projected at +46% by 2050 — long-run rental-demand tailwind backs the buy-and-hold thesis.
- By year 7, paydown + projected appreciation supports a ~$32k cash-out refi (75% LTV) — recoverable capital for the next deal without selling this one.
Negotiation context
- Only 0 days on market — expect competitive offers; lowballing is unlikely to land.
- Current owner paid $57k; list at $135k implies a 137% gain — meaningful room to come down on a strong offer.
Risks & watch-outs
- Watch-outs: built in 1956 — expect roof / HVAC / electrical / plumbing capex.
Questions for the listing agent
- What do current leases actually rent for vs. the listed asking? Can we see a recent rent roll and the last 12 months of T-12 income?
- Built in 1956 — when were the roof, HVAC, electrical panel, plumbing, and water heater last replaced?
- Is there a deadline driving the sale (1031 exchange, divorce, estate, relocation)? That informs how much negotiation room exists.
- Schools are B-rated — typically a magnet for longer-tenancy family renters. What's the average tenant stay here, and is there a school-zone premium baked into asking?
- Crime grade is F in this area — have there been break-ins, vandalism, or insurance claims at this property in the last 3 years? What carrier currently insures it and at what premium?
- The area grade is low — what's the realistic commute time and amenity access for the typical tenant pool here? Any planned neighborhood developments (good or bad) we should know about?
- What's the average days-on-market for RENTAL listings here right now (not sales)? A rising rental-DOM trend means longer vacancies and softer asking-rent achievability than the comps imply.
- What's the recent tenant-quality profile in this submarket — average credit score on applications, eviction rate, late-payment / NSF rate, and stable-employment percentage? A property-management company in the area should have these aggregated.
- How much new for-sale + rental construction is in the pipeline within 1–3 miles? Heavy new supply typically softens prices + rents 12–24 months out; constrained supply supports both.
Investment metrics
- 1% rule
- 0.81% ✗
- Cap rate
- 5.32%
- Cash-on-cash
- -3.48%
- DSCR
- 0.84
- GRM
- 10.3
CMA / ARV
No comps found within radius.
Projected returns pro-forma
3.0% appreciation · 3.0% rent growth · sell at horizon
- IRR
- 4.3%
- Equity multiple
- 1.25×
- Total profit
- $9,313
- Equity at exit
- $60,702
- IRR
- 7.5%
- Equity multiple
- 2.14×
- Total profit
- $43,027
- Equity at exit
- $93,549
Cash invested: $37,800 (down + closing). Projections, not guarantees.
Landlord ↔ Tenant lean methodology
- Overall (STATE)
- 83 Strongly Landlord-Friendly
- State South Dakota
- 83 Strongly Landlord-Friendly · R+16
- County
- — inherits STATE
- City
- — inherits STATE
ZIP-level market 57103-2219
- Active inventory
- 1
- Price-to-rent
- 10.3×
Monthly cashflow live
- Estimated rent
- $1,092 high interval (Pro) →
- Mortgage (P&I)
- −$708
- Tax from tax record
- −$208 /mo · $2,496/yr
- Insurance
- −$56
- HOA
- −$0
- Vacancy / Maint / Mgmt
- −$229
- Net cashflow
- $-110
Break-even live
Sensitivity live
| Price | -10% $-33 | -5% $-72 | +0% $-110 | +5% $-148 | +10% $-186 |
|---|---|---|---|---|---|
| Rent | -10% $-196 | -5% $-153 | +0% $-110 | +5% $-67 | +10% $-24 |
| Rate | -1.0pp $-42 | -0.5pp $-75 | base $-110 | +0.5pp $-145 | +1.0pp $-180 |
UW: 25.0% down · 7.5% · 30yr · 1.5% tax · 5.0% vac · 8.0% maint · 8.0% mgmt
Financing live
Cash to close
- Down payment
- $33,750
- Closing costs
- $4,050
- Reserves months
- —
- Total cash needed
- —
Loan-product check · same deal, 3 products live
Conventional
25% down · 7.5% · 30yr
- Down + closing
- —
- Monthly P&I
- —
- Monthly cashflow
- —
- DSCR
- —
- Eligible?
- —
Personal DTI + credit; lowest rate.
DSCR
20% down · 8.5% · 30yr
- Down + closing
- —
- Monthly P&I
- —
- Monthly cashflow
- —
- DSCR
- —
- Eligible?
- —
No personal income docs; deal must DSCR.
Hard money
10% down · 12.0% · 12mo
- Down + closing
- —
- Monthly P&I
- —
- Monthly cashflow
- —
- DSCR
- —
- Eligible?
- —
Short-term bridge; refi at stabilization.
Rent comps 40 comps
| Address | Beds | Baths | Sqft | Rent | $/sqft | DOM | Units | Dist |
|---|---|---|---|---|---|---|---|---|
| 1511 E Nye St Sioux Falls, SD | 2.0 | 1.0 | 907 | $975 | $1.07 | 45d | 1 | 0.28mi |
| 113 S Mable Ave Unit 212 Sioux Falls, SD | 2.0 | 2.0 | 900 | $1,095 | $1.22 | 15d | 1 | 0.37mi |
| 124 S Blauvelt Ave Unit 117 Sioux Falls, SD | 2.0 | 2.0 | 900 | $1,095 | $1.22 | 23d | 1 | 0.37mi |
| 300 S Lowell Ave Unit 300-17 Sioux Falls, SD | 2.0 | 1.0 | 625 | $792 | $1.27 | 23d | 1 | 0.47mi |
| 300 S Lowell Ave Sioux Falls, SD | 1.0–2.0 | 1.0 | 648 | $885 | $1.36 | 15d | 16 | 0.47mi |
| 1227 E 8th St Sioux Falls, SD | 2.0 | 1.0 | 700 | $749 | $1.07 | 45d | 1 | 0.54mi |
| 1011 S Blaine Ave Sioux Falls, SD | 2.0 | 1.0 | 1000 | $975 | $0.97 | 23d | 1 | 0.64mi |
| 1210 S Majestic View Pl Sioux Falls, SD | 2.0–3.0 | 1.5–2.0 | 1170 | $1,220 | $1.04 | 15d | 3 | 0.74mi |
| 1209 S Cleveland Ave Sioux Falls, SD | 2.0 | 1.0 | 900 | $875 | $0.97 | 45d | 1 | 0.78mi |
| 221 N Cleveland Ave Sioux Falls, SD | 1.0–3.0 | 1.0–1.5 | 922 | $922 | $1.00 | 23d | 1 | 0.79mi |
| 1612 S Cliff Ave Sioux Falls, SD | 2.0 | 1.0 | 1000 | $1,400 | $1.40 | 45d | 1 | 0.80mi |
| 1301 S Cleveland Ave Sioux Falls, SD | 1.0–2.0 | 1.0 | 800 | $825 | $1.03 | 45d | 2 | 0.82mi |
| 1301 S Cleveland Ave Sioux Falls, SD | 2.0 | 1.0 | 900 | $825 | $0.92 | 23d | 1 | 0.82mi |
| 1329 E 4th St Sioux Falls, SD | 2.0 | 1.0 | 700 | $1,050 | $1.50 | 45d | 1 | 0.83mi |
| 514 N French Ave Sioux Falls, SD | 2.0 | 1.0 | 850 | $1,450 | $1.71 | 15d | 1 | 0.89mi |
| 1710 S 9th Ave Sioux Falls, SD | 2.0 | 1.0 | 800 | $1,590 | $1.99 | 23d | 1 | 0.93mi |
| 325 E 12th St Sioux Falls, SD | 1.0–2.0 | 1.0–2.0 | 954 | $1,680 | $1.76 | 15d | 11 | 0.94mi |
| 1600 S Rock Creek Dr Sioux Falls, SD | 1.0–2.0 | 1.0 | 765 | $825 | $1.08 | 45d | 1 | 0.94mi |
| 758 S 3rd Ave Sioux Falls, SD | 2.0 | 1.0 | 900 | $900 | $1.00 | 23d | 1 | 0.95mi |
| 600 E 21st St Unit 1 (F) Sioux Falls, SD | 2.0 | 1.0 | 800 | $1,476 | $1.84 | 23d | 1 | 0.95mi |
| 1723 S 9th Ave Sioux Falls, SD | 2.0 | 1.0 | 1071 | $1,506 | $1.41 | 23d | 1 | 0.98mi |
| 1716 S 8th Ave Sioux Falls, SD | 2.0 | 1.5 | 1080 | $1,732 | $1.60 | 23d | 1 | 0.99mi |
| 530 N Indiana Ave Sioux Falls, SD | 2.0 | 1.0 | 575 | $890 | $1.55 | 45d | 1 | 0.99mi |
| 3401 E 11th St Sioux Falls, SD | 2.0 | 1.0–2.0 | 775 | $1,025 | $1.32 | 23d | 1 | 0.99mi |
| 2909 E 6th St Sioux Falls, SD | 3.0 | 1.0–2.0 | 773 | $1,539 | $1.99 | 15d | 1 | 1.00mi |
| 807 N Cleveland Ave Unit 801-301 Sioux Falls, SD | 2.0 | 1.0 | 840 | $1,005 | $1.20 | 15d | 1 | 1.02mi |
| 807 N Cleveland Ave Unit 801-307 Sioux Falls, SD | 2.0 | 1.0 | 820 | $975 | $1.19 | 45d | 1 | 1.02mi |
| 807 N Cleveland Ave Unit 805-308 Sioux Falls, SD | 2.0 | 1.0 | 840 | $975 | $1.16 | 15d | 1 | 1.02mi |
| 205 E 12th St Sioux Falls, SD | 1.0–2.0 | 1.0–2.0 | 772 | $2,430 | $3.15 | 15d | 28 | 1.05mi |
| 310 N Reid Pl Sioux Falls, SD | 3.0 | 1.0–3.0 | 1251 | $5,000 | $4.00 | 15d | 7 | 1.08mi |
| 350 N Reid Pl Sioux Falls, SD | 2.0 | 1.0–2.0 | 898 | $3,000 | $3.34 | 15d | 9 | 1.13mi |
| 230 S Phillips Ave Unit 405 Sioux Falls, SD | 2.0 | 1.0 | 925 | $1,625 | $1.76 | 23d | 1 | 1.14mi |
| 1904 S Cleveland Ave Sioux Falls, SD | 2.0 | 1.0 | 1055 | $1,050 | $1.00 | 15d | 1 | 1.15mi |
| 909 N Cleveland Ave Sioux Falls, SD | 2.0 | 1.0 | 917 | $853 | $0.93 | 15d | 2 | 1.16mi |
| 1966 S Cleveland Ave Sioux Falls, SD | 2.0 | 1.0 | 1055 | $1,095 | $1.04 | 45d | 1 | 1.17mi |
| 950 N Cliff Ave Sioux Falls, SD | 1.0–3.0 | 1.0–2.0 | 970 | $899 | $0.93 | 45d | 1 | 1.18mi |
| 100 W 17th St Apt 15 Sioux Falls, SD | 2.0 | 1.5 | 1000 | $1,195 | $1.20 | 23d | 1 | 1.20mi |
| 1940 S Cleveland Ave Sioux Falls, SD | 2.0 | 1.0 | 995 | $1,095 | $1.10 | 45d | 1 | 1.20mi |
| 1938 S Cleveland Ave Sioux Falls, SD | 2.0 | 1.0 | 995 | $1,095 | $1.10 | 45d | 1 | 1.20mi |
| 1106 S Bahnson Ave Sioux Falls, SD | 2.0 | 1.0 | 700 | $399 | $0.57 | 45d | 1 | 1.21mi |
Listing history 3 events
-
2026-05-26$135,000
-
2026-05-26historical
-
2005-01-17soldstatus $57,000
ⓘ Source: listings_history table (triggers on properties + properties_extension) + one-shot
backfill from property_details.listing_events for pre-trigger history.
Tax reassessment forecast SD · Resets to sale price
- Current annual tax
- $2,496 · $208/mo
- Projected year-2 tax
- $2,496 · $208/mo
- Expected delta
- $0/yr ($0/mo · 0.0%)
ⓘ Screening estimate from a state-policy table — verify with the county assessor before closing.
Climate risk First Street
- Flood 1/10 Low FEMA zone X (unshaded) · 0% chance over 30 yrs
- Wildfire 2/10 Low
- Heat 2/10 Low 7 d/yr ≥99°F today · 14 d/yr by 30 yrs out
- Wind 2/10 Low
- Air quality 2/10 Low 1 unhealthy d/yr today · 1 by 30 yrs out
Nearby sold comps map
Loading sold comps map…
Walkable amenities ~0.75 mi
Loading nearby amenities…
Taxation est. · year 1
- Rental income
- $13,100
- − Mortgage interest
- −$7,562
- − Property taxes
- −$2,496
- − Insurance
- −$675
- − Repairs & maintenance
- −$1,048
- − Management
- −$1,048
- − Depreciation
- −$3,927
- Taxable loss
- −$3,656
- Est. tax savings @ 24.0%
- +$877
- After-tax cash flow
- $-440/yr
For passive investors: Depreciation is non-cash, so a rental often shows a tax loss while cash-flowing — sheltering income. Rental losses are passive: they offset passive income freely, and up to $25,000/yr can offset ordinary (W-2) income if you actively participate and your MAGI is under $100k (phasing out to $0 by $150k); unused losses carry forward. On sale, claimed depreciation is recaptured at up to 25%, and gains may owe capital-gains tax (a 1031 exchange can defer both). Figures are a year-1 estimate at your 24.0% rate — not tax advice; consult a CPA.
Schools (NCES district)
- District
- Sioux Falls School District 49-5
- NCES district ID
- 4666270
- Math proficiency
- 39% ▼ -4.00%
- Reading proficiency
- 48% ▼ -2.00%
- Median HH income
- $51,093
- Composite
- 37.47/100
- National rank
- #4407
- State rank
- #45 of 59 in SD
Livability — Sioux Falls
- Score
- 85/100
- State rank
- #3
- US rank
- #610
Category grades
Schools grade is shown separately in the Schools card above.
Census & demographics
- Census place
- Sioux Falls, SD
Population outlook (Minnehaha County) Hauer SSP2
- Today (2025)
- 222,323 people
- By 2030
- 241,430 · +8.6%
- By 2040
- 281,643 · +26.7%
- By 2050
- 325,574 · +46.4%
- By 2075
- 469,313 · +111.1%
- By 2100
- 664,763 · +199.0%
Not yet ingested
- Political lean
- —
- Race & ethnicity
- —
- Common origin
- —
- Civics
- —
Market trends
- HPI YoY
- —
- Current HPI
- —
- Rent YoY
- —
- Metro
- —
- State GDP YoY
- ▲ 0.70%
- F500 in state
- 2
Industry mix (Fortune 500 HQ in SD)
| Industry | F500 HQs | Revenue |
|---|---|---|
| Utilities | 1 | $1B |
|
||
Price history
+136.8% since first listed3 events — show timeline
- 2026-05-26 Listing Removed — REALTOR® Association of the Sioux Empire
- 2026-05-26 Listed $135,000 REALTOR® Association of the Sioux Empire
- 2005-01-17 Sold (Public Records) $57,000 Public Records
Property tax history
+3.6%/yrLatest (2024): $2,496 · -0.8% YoY. Source: county tax records.
Cash-flow waterfall
monthlySold comps — $/sqft
last 12 mo · ≤1 miLoading sold comps…