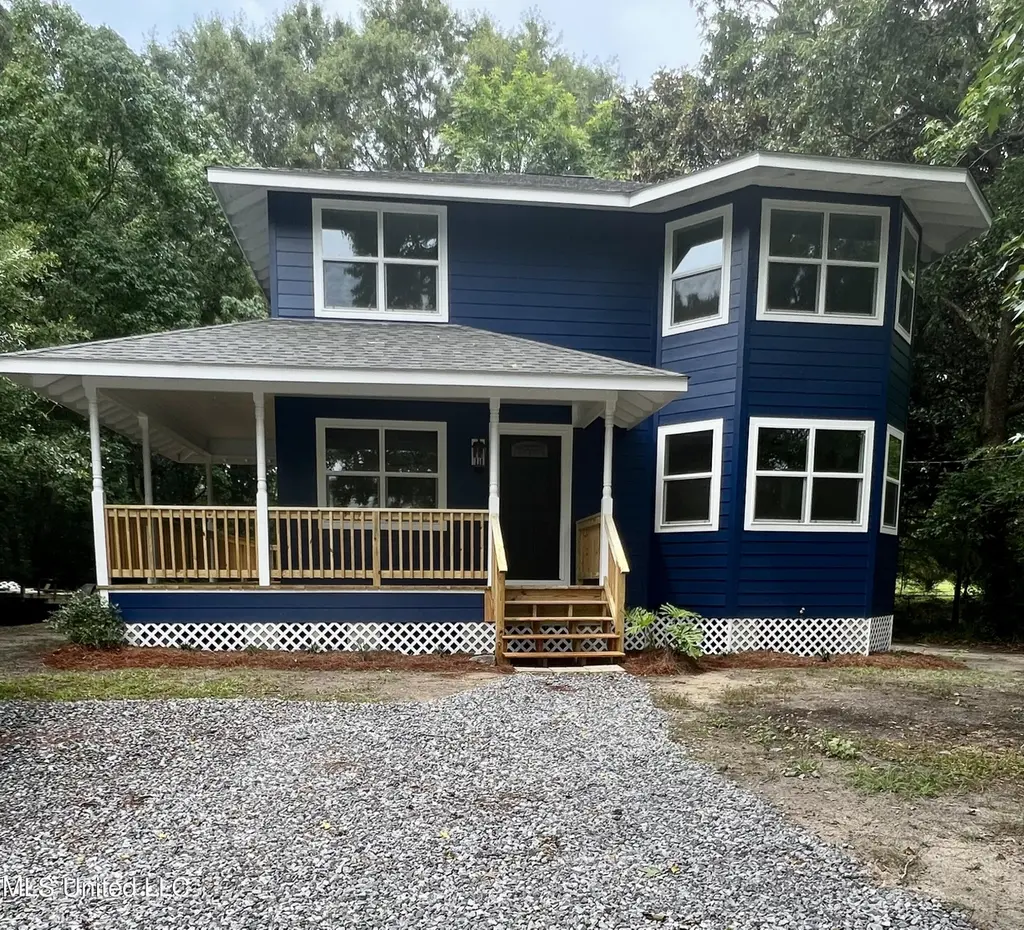
10110 Blossom St · Vancleave, MS
Flood risk 1/10 · Minimal
- FEMA flood zone
- X (unshaded)
- Chance of flooding over 30 yrs
- 0.0%
- Est. flood insurance / yr
- $507 – $1,088
Fire risk 7/10 · Major
- Est. fire insurance / yr
- $1,241 – $2,305
Heat risk 10/10 · Severe
- Hot days now (above 107°F)
- 7 days/yr
- Hot days in 30 yrs
- 22 days/yr
Wind risk 9/10 · Severe
- Chance of severe wind over 30 yrs
- 99.0%
Air-quality risk 2/10 · Minimal
- Unhealthy air days now
- 1 days/yr
- Unhealthy air days in 30 yrs
- 1 days/yr
Risk factors via First Street. Map © Google.
Why this score? — see what drove the C+ grade
The composite is a weighted blend of 9 inputs, each scored 0–100. Each bar is that input's sub-score; the figure is the points it added to the 100-point composite (weight × sub-score).
- Cash flow +22.6/30.0
- ARV discount +12.3/15.0
- DSCR +7.2/10.0
- 1% rule +5.1/10.0
- Schools +4.4/10.0
- Livability +3.6/5.0
- Rent growth +2.5/5.0
- Condition / age +2.5/5.0
- Appreciation +0.0/10.0
$247,500
🖨 Deal sheet 📄 Offer letter ✓ Due diligence
Listing remarks
Welcome to your new home! Nestled on a quiet street, this updated property offers the perfect blend of convenience and tranquil living. Located just a short stroll from Paige bayou Marina, this home is ideal for boating enthusiasts and nature lovers alike. Featuring three spacious bedrooms with ample closet space and two and half bathrooms. The primary bathroom boast a double vanity sink and a private shower. The kitchen area has an open concept that flows seamlessly into the living space. While the dining area is adorned with large windows, allowing plenty of natural light to fill the room offering both comfort and style. This home offers an exceptional combination of modern updates, spaci
Key facts
- Quiet street
- Large windows
- Paige bayou marina
Tags
Neighborhood map
What this means for you Summary
Snapshot
- This is a 3-bed/3.0-bath single-family listed at $248k.
Deal economics
- At list price, monthly cash flow is $421 ($5k/yr) — positive.
- The deal already cash-flows at list — no discount required.
- Meets the 1% rule at list price ($2k rent vs $248k).
- Recommended offer: $244k (1.5% below list) — sets the bar for market timing.
- Cap rate 8.3% vs local median 2.9% in Vancleave — top-decile yield for the area; either an underpriced asset or a hidden risk that comps aren't pricing in. Stress-test before assuming the spread holds.
Location & tenants
- Location reads 71/100 on livability (#34 in MS) — a middle-class / working-renter tenant base. Strengths: crime A+, cost of living A+, housing A+; Watch: health & safety D+, amenities F, commute F.
- Jackson County School District (rural): math 53% / reading 48% proficiency, ranked #10 of 130 in MS (top 8%) — acceptable for families but not a draw, mixed tenant base, ~2y average lease.
- Zoned schools: Vancleave Upper Elementary (math 51% / reading 48%, grade D, #65 of 375 statewide, top 20%, 351 students, 99% FRL); Vancleave High School (math 48% / reading 52%, grade D+, #19 of 197 statewide, top 10%, 737 students, 100% FRL) — zoned schools average 99% FRL vs 50% district-wide (49 pts higher); higher-poverty schools than district average — tighter screening recommended.
- Market conditions: 194 active listings in the ZIP; 1 comparable units currently listed for rent nearby; 516 units permitted in Jackson County in 2024 (6 in 5+ unit buildings).
Forward outlook
- Local home prices are declining (-3.0%/yr); year-one equity from $2k of loan paydown is wiped out by about $7k of value loss. Plan a longer hold.
Negotiation context
- It's been on market 24 days — a 2% lower offer ($244k) is reasonable based on typical stale-listing flexibility.
- 4 sale attempts since 9y ago with the ask held roughly flat each time — persistent listings suggest the price (not the market) is what's stuck; bring a comps-based counter.
Risks & watch-outs
- Climate carrying-cost: severe wind risk, 99% chance of damaging wind over 30y; major wildfire risk; extreme-heat days projected 7→22/yr by 2055 (HVAC capex compounding) — expect insurance premiums to compound above CPI over the hold.
Questions for the listing agent
- Is there a deadline driving the sale (1031 exchange, divorce, estate, relocation)? That informs how much negotiation room exists.
- What's the average days-on-market for RENTAL listings here right now (not sales)? A rising rental-DOM trend means longer vacancies and softer asking-rent achievability than the comps imply.
- What's the recent tenant-quality profile in this submarket — average credit score on applications, eviction rate, late-payment / NSF rate, and stable-employment percentage? A property-management company in the area should have these aggregated.
- How much new for-sale + rental construction is in the pipeline within 1–3 miles? Heavy new supply typically softens prices + rents 12–24 months out; constrained supply supports both.
Investment metrics
- 1% rule
- 1.01% ✓
- Cap rate
- 8.33%
- Cash-on-cash
- 7.29%
- DSCR
- 1.32
- GRM
- 8.2
CMA / ARV
- ARV (on-the-fly)
- $277,182
- Comps found
- 1
Show comp detail 1 sale within ~0.75 mi
| Address | Dist | Beds/Ba | Sqft | Sold | Price | $/sf | Match |
|---|---|---|---|---|---|---|---|
| 10120 Isle Wood Dr | 0.05mi | 3/2.0 | 1,640 (+5%) | 13mo | $289,900 | $177 | 75 |
Match score weights: distance 35% · size 25% · config 20% · recency 20%. Top-matched comps best support the ARV.
Projected returns pro-forma
-3.0% appreciation · 3.0% rent growth · sell at horizon
- IRR
- -5.2%
- Equity multiple
- 0.81×
- Total profit
- $-13,341
- Equity at exit
- $36,903
- IRR
- 4.5%
- Equity multiple
- 1.33×
- Total profit
- $22,684
- Equity at exit
- $21,399
Cash invested: $69,300 (down + closing). Projections, not guarantees.
Landlord ↔ Tenant lean methodology
- Overall (STATE)
- 90 Strongly Landlord-Friendly
- State Mississippi
- 90 Strongly Landlord-Friendly · R+11
- County
- — inherits STATE
- City
- — inherits STATE
ZIP-level market 39565
- Home prices YoY
- -28.8%
- Active inventory
- 194
- Price-to-rent
- 8.2×
Monthly cashflow live
- Estimated rent
- $2,500 medium interval (Pro) →
- Mortgage (P&I)
- −$1,298
- Tax from tax record
- −$153 /mo · $1,834/yr
- Insurance
- −$103
- HOA
- −$0
- Vacancy / Maint / Mgmt
- −$525
- Net cashflow
- $421
Break-even live
UW: 25.0% down · 7.5% · 30yr · 1.5% tax · 5.0% vac · 8.0% maint · 8.0% mgmt
Financing live
Cash to close
- Down payment
- $61,875
- Closing costs
- $7,425
- Reserves months
- —
- Total cash needed
- —
Loan-product check · same deal, 3 products live
Conventional
25% down · 7.5% · 30yr
- Down + closing
- —
- Monthly P&I
- —
- Monthly cashflow
- —
- DSCR
- —
- Eligible?
- —
Personal DTI + credit; lowest rate.
DSCR
20% down · 8.5% · 30yr
- Down + closing
- —
- Monthly P&I
- —
- Monthly cashflow
- —
- DSCR
- —
- Eligible?
- —
No personal income docs; deal must DSCR.
Hard money
10% down · 12.0% · 12mo
- Down + closing
- —
- Monthly P&I
- —
- Monthly cashflow
- —
- DSCR
- —
- Eligible?
- —
Short-term bridge; refi at stabilization.
Rent comps 1 comps
| Address | Beds | Baths | Sqft | Rent | $/sqft | DOM | Units | Dist |
|---|---|---|---|---|---|---|---|---|
| 10325 Clearwater Rd Vancleave, MS | 4.0 | 2.0 | 2219 | $2,500 | $1.13 | 13d | 1 | 0.70mi |
Listing history 8 events
-
2026-04-28status Pending
-
2026-04-03$247,500 Active
-
2024-07-15historical
-
2024-06-07$274,900 Active
-
2021-10-01historical
-
2019-02-22soldstatus
-
2018-11-30$69,900
-
2017-12-07$79,900
ⓘ Source: listings_history table (triggers on properties + properties_extension) + one-shot
backfill from property_details.listing_events for pre-trigger history.
Tax reassessment forecast MS · Resets to sale price
- Current annual tax
- $1,834 · $153/mo
- Projected year-2 tax
- $1,955 · $163/mo
- Expected delta
- +$122/yr (+$10/mo · 6.6%)
ⓘ Screening estimate from a state-policy table — verify with the county assessor before closing.
Climate risk First Street
- Flood 1/10 Low FEMA zone X (unshaded) · 0% chance over 30 yrs
- Wildfire 7/10 Severe
- Heat 10/10 Extreme 7 d/yr ≥107°F today · 22 d/yr by 30 yrs out
- Wind 9/10 Extreme 99% chance of damaging wind over 30 yrs
- Air quality 2/10 Low 1 unhealthy d/yr today · 1 by 30 yrs out
Nearby sold comps map
Loading sold comps map…
Walkable amenities ~0.75 mi
Loading nearby amenities…
Taxation est. · year 1
- Rental income
- $30,000
- − Mortgage interest
- −$13,864
- − Property taxes
- −$1,834
- − Insurance
- −$1,238
- − Repairs & maintenance
- −$2,400
- − Management
- −$2,400
- − Depreciation
- −$7,200
- Taxable income
- $1,065
- Est. tax owed @ 24.0%
- −$256
- After-tax cash flow
- $4,798/yr
For passive investors: Depreciation is non-cash, so a rental often shows a tax loss while cash-flowing — sheltering income. Rental losses are passive: they offset passive income freely, and up to $25,000/yr can offset ordinary (W-2) income if you actively participate and your MAGI is under $100k (phasing out to $0 by $150k); unused losses carry forward. On sale, claimed depreciation is recaptured at up to 25%, and gains may owe capital-gains tax (a 1031 exchange can defer both). Figures are a year-1 estimate at your 24.0% rate — not tax advice; consult a CPA.
Schools (NCES district)
- District
- Jackson County School District
- NCES district ID
- 2802160
- Math proficiency
- 53% ▼ -5.00%
- Reading proficiency
- 48% ▼ -5.00%
- Median HH income
- $53,569
- Composite
- 43.57/100
- National rank
- #2980
- State rank
- #10 of 130 in MS
Livability — Vancleave
- Score
- 71/100
- State rank
- #34
- US rank
- #7039
Category grades
Schools grade is shown separately in the Schools card above.
Census & demographics
- Census place
- Vancleave, MS
- Population (ZIP)
- 20,692
Population outlook (Jackson County) Hauer SSP2
- Today (2025)
- 146,926 people
- By 2030
- 148,442 · +1.0%
- By 2040
- 149,631 · +1.8%
- By 2050
- 148,723 · +1.2%
- By 2075
- 147,845 · +0.6%
- By 2100
- 144,510 · -1.6%
Race, ethnicity, and origin ACS 2023
- Neighborhood character
- Predominantly White (85%)
- Race & ethnicity
- White 85% Black 6% Two or more races 4% Hispanic / Latino 3% Asian 2%
- Common ancestry
- Lithuanian 4% Slovak 1% Subsaharan African 1%
- Foreign-born
- 2% · Vietnam
- Languages at home
- 95% English-only · Spanish 2% Vietnamese 1% Tagalog/Filipino 1%
Political lean MEDSL · Jackson
- 2024 margin
- Solid R (+39.9) · D 29.5% · R 69.4% · Other 1.1%
- 2008→2024 swing
- -6.4pp toward R · 2008: -33.5pp · 2024: -39.9pp
- All cycles
- 2024: R+39.9 2020: R+34.6 2016: R+39.9 2012: R+36.1 2008: R+33.5
Not yet ingested
- Civics
- —
Market trends
- HPI YoY
- ▼ -75.68%
- Current HPI
- 187.1025
- Rent YoY
- —
- Metro
- —
- State GDP YoY
- —
- F500 in state
- 0
Price history
+209.8% since first listed8 events — show timeline
- 2026-04-28 Pending — MLSU
- 2026-04-03 Listed $247,500 MLSU
- 2024-07-15 Listing Removed — MLSU
- 2024-06-07 Listed $274,900 MLSU
- 2021-10-01 Listing Removed — MLSU
- 2019-02-22 Sold (MLS) — MLSU
- 2018-11-30 Listed $69,900 MLSU
- 2017-12-07 Listed $79,900 MLSU
Property tax history
+15.2%/yrLatest (2025): $1,834 · +21.7% YoY. Source: county tax records.
Cash-flow waterfall
monthlySold comps — $/sqft
last 12 mo · ≤1 miLoading sold comps…