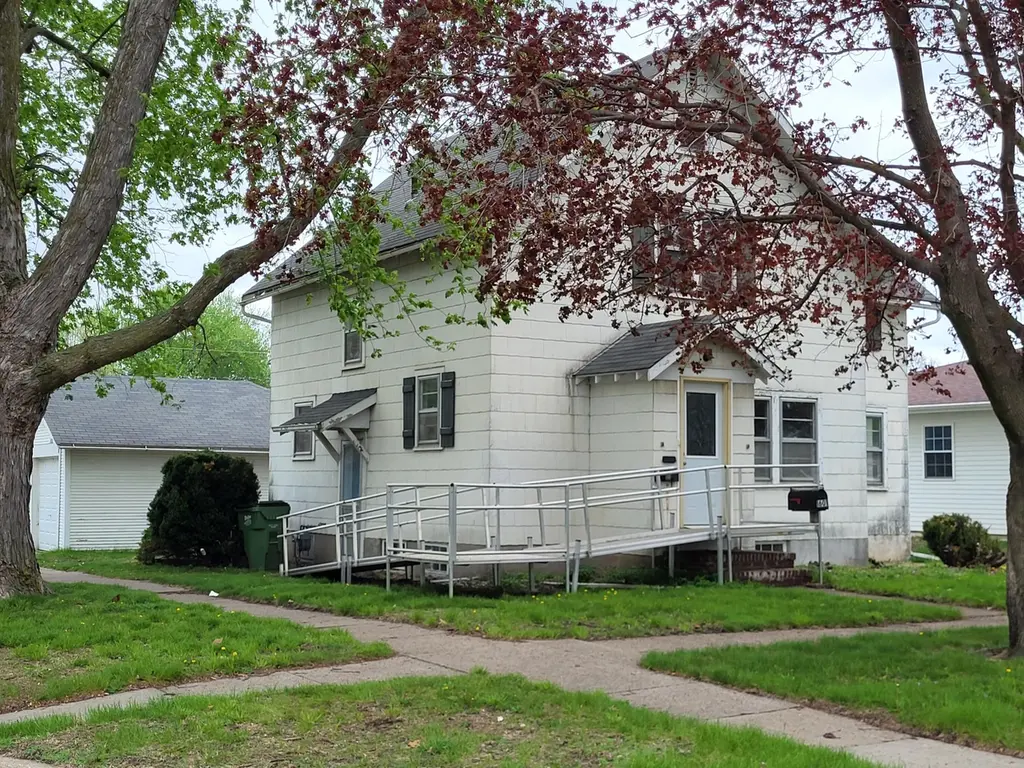
1601 2nd St · Boone, IA
Flood risk 3/10 · Minor
- FEMA flood zone
- X (unshaded)
- Chance of flooding over 30 yrs
- 0.2%
- Est. flood insurance / yr
- $473 – $860
Fire risk 1/10 · Minimal
- Est. fire insurance / yr
- $902 – $1,676
Heat risk 3/10 · Minor
- Hot days now (above 103°F)
- 7 days/yr
- Hot days in 30 yrs
- 15 days/yr
Wind risk 2/10 · Minimal
- Chance of severe wind over 30 yrs
- —
Air-quality risk 1/10 · Minimal
- Unhealthy air days now
- 0 days/yr
- Unhealthy air days in 30 yrs
- 0 days/yr
Risk factors via First Street. Map © Google.
Why this score? — see what drove the B+ grade
The composite is a weighted blend of 9 inputs, each scored 0–100. Each bar is that input's sub-score; the figure is the points it added to the 100-point composite (weight × sub-score).
- Cash flow +30.0/30.0
- ARV discount +15.0/15.0
- 1% rule +10.0/10.0
- DSCR +10.0/10.0
- Schools +5.2/10.0
- Livability +4.0/5.0
- Rent growth +2.5/5.0
- Condition / age +2.5/5.0
- Appreciation +0.0/10.0
$99,999
🖨 Deal sheet 📄 Offer letter ✓ Due diligence
Listing remarks
BIG PRICE REDUCTION!!! Great Location!! Close to the Middle School, Ledges Grade School and Cedar Pointe Golf Course. Solid, well built home. Property tax incentives with the City of Boone. The first $75,000.00 of assessed value will be forgiven for 5 years with $10,000.00 in updates. Info at www. boonegov.com Main level includes living room, dining room, sunroom, kitchen and 3/4 bath. Upper floor has a full bath, 2 bedrooms with an adjoining 3rd bedroom. Full basement with 3/4 bath, possible future rec room and lots of storage. Newer furnace and water heater. 2 car detached garage. Located on a full corner lot, mature trees, on the east side of Boone.
Key facts
- Kitchen
- Living room
- Sunroom
Tags
Property features AI
Exterior
- Parking: 2-car garage
- Utilities: Public water; Public sewer
- Home design: Single family residence; Two levels
- Construction: Other construction materials
- Exterior features: Level lot; Shed(s)
Interior
- Kitchen: Range; Microwave; Refrigerator
- Flooring: Vinyl; Hardwood; Carpet
- Bathrooms: 1 full bathroom; 2 three-quarter bathrooms
- Heating & cooling: Forced air heating; Natural gas
- Interior features: Ceiling fan(s); Gas fireplace; Full basement with sump pump; 12 total rooms
- Laundry & utility: Washer; Dryer
Neighborhood map
What this means for you Summary
Snapshot
- This is a 3-bed/1.5-bath single-family listed at $100k.
Deal economics
- At list price, monthly cash flow is $658 ($8k/yr) — positive.
- The deal already cash-flows at list — no discount required.
- Meets the 1% rule at list price ($2k rent vs $100k).
- Recommended offer: $97k (3.0% below list) — sets the bar for market timing.
- Cap rate 14.2% vs local median 3.6% in Boone — top-decile yield for the area; either an underpriced asset or a hidden risk that comps aren't pricing in. Stress-test before assuming the spread holds.
Location & tenants
- Location reads 79/100 on livability (#112 in IA, #2,144 nationally) — a middle-class / working-renter tenant base. Strengths: cost of living A+, housing A+, health & safety A+; Watch: amenities F, commute F.
- Boone Community School District (town): math 57% / reading 66% proficiency, ranked #232 of 289 in IA (top 80%) — acceptable for families but not a draw, mixed tenant base, ~2y average lease.
- Market conditions: 215 active listings in the ZIP; 5 comparable units currently listed for rent nearby; rentals lingering (median 44d on market — plan ~5-8 weeks vacancy on turnover, expect pricing pressure); 80% of comp listings sitting > 30 days — soft ceiling on asking rent; 80 units permitted in Boone County in 2024 (16 in 5+ unit buildings).
Forward outlook
- Local home prices are declining (-3.0%/yr); year-one equity from $691 of loan paydown is wiped out by about $3k of value loss. Plan a longer hold.
- At projected returns (-3.0% appreciation + 3.0% rent growth), your $28k cash investment doubles in ~5 years — after that, you're playing with house money.
Negotiation context
- It's been on market 55 days — a 3% lower offer ($97k) is reasonable based on typical stale-listing flexibility.
- 2 sale attempts; this cycle's ask has dropped $30k (23%) from the opening price — seller is motivated, your offer sets the floor, not the list.
Risks & watch-outs
- Watch-outs: built in 1912 — expect roof / HVAC / electrical / plumbing capex.
Questions for the listing agent
- It's been on market 55 days. Have you received any prior offers? Is the seller open to a 3% concession, seller financing, or rate buy-down credit?
- Built in 1912 — when were the roof, HVAC, electrical panel, plumbing, and water heater last replaced?
- Is there a deadline driving the sale (1031 exchange, divorce, estate, relocation)? That informs how much negotiation room exists.
- Schools are B-rated — typically a magnet for longer-tenancy family renters. What's the average tenant stay here, and is there a school-zone premium baked into asking?
- What's the average days-on-market for RENTAL listings here right now (not sales)? A rising rental-DOM trend means longer vacancies and softer asking-rent achievability than the comps imply.
- What's the recent tenant-quality profile in this submarket — average credit score on applications, eviction rate, late-payment / NSF rate, and stable-employment percentage? A property-management company in the area should have these aggregated.
- How much new for-sale + rental construction is in the pipeline within 1–3 miles? Heavy new supply typically softens prices + rents 12–24 months out; constrained supply supports both.
Investment metrics
- 1% rule
- 1.72% ✓
- Cap rate
- 14.18%
- Cash-on-cash
- 28.19%
- DSCR
- 2.25
- GRM
- 4.8
CMA / ARV
- ARV (median comp)
- $145,034
- List price
- $99,999
- Delta
- -31.05%
- Verdict
- UNDERPRICED
- Comps
- 20 within 1.0 mi
Show comp detail 12 sales within ~0.75 mi
| Address | Dist | Beds/Ba | Sqft | Sold | Price | $/sf | Match |
|---|---|---|---|---|---|---|---|
| 127 Tama St | 0.50mi | 3/1.5 | 1,512 (-1%) | 2mo | $240,000 | $159 | 74 |
| 1632 Mamie Eisenhower Ave | 0.13mi | 4/2.0 (+1) | 1,647 (+8%) | 2mo | $169,000 | $103 | 72 |
| 1427 Garst Ave | 0.25mi | 3/3.0 | 1,602 (+5%) | 3mo | $282,500 | $176 | 72 |
| 514 S Jackson St | 0.43mi | 3/3.0 | 1,559 (+2%) | 1mo | $280,000 | $180 | 69 |
| 1322 7th St | 0.41mi | 3/1.5 | 1,406 (-8%) | 2mo | $225,000 | $160 | 66 |
| 522 Linn St | 0.38mi | 4/3.0 (+1) | 1,554 (+2%) | 4mo | $310,000 | $199 | 65 |
| 1115 Garst Ave | 0.51mi | 3/2.0 | 1,600 (+5%) | 3mo | $230,000 | $144 | 64 |
| 1554 6th St | 0.26mi | 4/2.0 (+1) | 1,393 (-9%) | 6mo | $257,930 | $185 | 61 |
| 1022 Linn St | 0.67mi | 3/2.0 | 1,545 (+1%) | 5mo | $282,000 | $183 | 60 |
| 1110 Aldrich Ave | 0.58mi | 4/2.0 (+1) | 1,409 (-8%) | 3mo | $131,000 | $93 | 51 |
| 1116 Linn St | 0.74mi | 3/1.0 | 1,652 (+8%) | 1mo | $99,000 | $60 | 49 |
| 815 3rd St | 0.70mi | 2/1.0 (-1) | 1,675 (+10%) | 1mo | $150,000 | $90 | 43 |
Match score weights: distance 35% · size 25% · config 20% · recency 20%. Top-matched comps best support the ARV.
Projected returns pro-forma
-3.0% appreciation · 3.0% rent growth · sell at horizon
- IRR
- 22.4%
- Equity multiple
- 1.92×
- Total profit
- $25,714
- Equity at exit
- $14,910
- IRR
- 30.4%
- Equity multiple
- 3.73×
- Total profit
- $76,456
- Equity at exit
- $8,646
Cash invested: $28,000 (down + closing). Projections, not guarantees.
Landlord ↔ Tenant lean methodology
- Overall (STATE)
- 83 Strongly Landlord-Friendly
- State Iowa
- 83 Strongly Landlord-Friendly · R+6
- County
- — inherits STATE
- City
- — inherits STATE
ZIP-level market 50036
- Home prices YoY
- -27.1%
- Active inventory
- 215
- Price-to-rent
- 4.8×
Monthly cashflow live
- Estimated rent
- $1,720 high interval (Pro) →
- Mortgage (P&I)
- −$524
- Tax from tax record
- −$135 /mo · $1,618/yr
- Insurance
- −$42
- HOA
- −$0
- Vacancy / Maint / Mgmt
- −$361
- Net cashflow
- $658
Break-even live
UW: 25.0% down · 7.5% · 30yr · 1.5% tax · 5.0% vac · 8.0% maint · 8.0% mgmt
Financing live
Cash to close
- Down payment
- $25,000
- Closing costs
- $3,000
- Reserves months
- —
- Total cash needed
- —
Loan-product check · same deal, 3 products live
Conventional
25% down · 7.5% · 30yr
- Down + closing
- —
- Monthly P&I
- —
- Monthly cashflow
- —
- DSCR
- —
- Eligible?
- —
Personal DTI + credit; lowest rate.
DSCR
20% down · 8.5% · 30yr
- Down + closing
- —
- Monthly P&I
- —
- Monthly cashflow
- —
- DSCR
- —
- Eligible?
- —
No personal income docs; deal must DSCR.
Hard money
10% down · 12.0% · 12mo
- Down + closing
- —
- Monthly P&I
- —
- Monthly cashflow
- —
- DSCR
- —
- Eligible?
- —
Short-term bridge; refi at stabilization.
Rent comps 5 comps
| Address | Beds | Baths | Sqft | Rent | $/sqft | DOM | Units | Dist |
|---|---|---|---|---|---|---|---|---|
| 1318 SE Linn St Boone, IA | 3.0 | 2.0 | 1896 | $1,695 | $0.89 | 44d | 1 | 0.52mi |
| 1208 S Linn St Boone, IA | 3.0 | 2.5 | 1449 | $1,800 | $1.24 | 44d | 1 | 1.08mi |
| 1428 Story St Boone, IA | 4.0 | 3.0 | 1900 | $2,000 | $1.05 | 44d | 1 | 1.11mi |
| 1221 S Linn St Boone, IA | 2.0–3.0 | 1.0 | 1025 | $1,025 | $1.00 | 14d | 2 | 1.11mi |
| 1109 Ida Pl Boone, IA | 3.0 | 2.5 | 1715 | $1,950 | $1.14 | 44d | 1 | 1.12mi |
Listing history 20 events
-
2026-06-18days on market $99,999 Active 55 DOM
-
2026-06-18price $99,999 Active 54 DOM
-
2026-06-17days on market $110,000 Active 54 DOM
-
2026-06-16days on market $110,000 Active 53 DOM
-
2026-06-15days on market $110,000 Active 52 DOM
-
2026-06-13days on market $110,000 Active 50 DOM
-
2026-06-12days on market $110,000 Active 49 DOM
-
2026-06-09days on market $110,000 Active 46 DOM
-
2026-06-08days on market $110,000 Active 45 DOM
-
2026-06-07days on market $110,000 Active 44 DOM
-
2026-06-05days on market $110,000 Active 42 DOM
-
2026-06-04days on market $110,000 Active 40 DOM
-
2026-06-02days on market $110,000 Active 39 DOM
-
2026-06-01days on market $110,000 Active 38 DOM
-
2026-05-31days on market $110,000 Active 37 DOM
-
2026-05-31days on market $110,000 Active 36 DOM
-
2026-05-11price $122,000
-
2026-05-11price $122,000 641-char remark
-
2026-04-23$130,000 Active
-
2026-04-23$130,000 Active 641-char remark
ⓘ Source: listings_history table (triggers on properties + properties_extension) + one-shot
backfill from property_details.listing_events for pre-trigger history.
Tax reassessment forecast IA · Partial reset (capped growth)
- Current annual tax
- $1,618 · $135/mo
- Projected year-2 tax
- $1,618 · $135/mo
- Expected delta
- $0/yr ($0/mo · 0.0%)
ⓘ Screening estimate from a state-policy table — verify with the county assessor before closing.
Climate risk First Street
- Flood 3/10 Moderate FEMA zone X (unshaded) · 20% chance over 30 yrs
- Wildfire 1/10 Low
- Heat 3/10 Moderate 7 d/yr ≥103°F today · 15 d/yr by 30 yrs out
- Wind 2/10 Low
- Air quality 1/10 Low 0 unhealthy d/yr today · 0 by 30 yrs out
Nearby sold comps map
Loading sold comps map…
Walkable amenities ~0.75 mi
Loading nearby amenities…
Taxation est. · year 1
- Rental income
- $20,636
- − Mortgage interest
- −$5,601
- − Property taxes
- −$1,618
- − Insurance
- −$500
- − Repairs & maintenance
- −$1,651
- − Management
- −$1,651
- − Depreciation
- −$2,909
- Taxable income
- $6,706
- Est. tax owed @ 24.0%
- −$1,609
- After-tax cash flow
- $6,282/yr
For passive investors: Depreciation is non-cash, so a rental often shows a tax loss while cash-flowing — sheltering income. Rental losses are passive: they offset passive income freely, and up to $25,000/yr can offset ordinary (W-2) income if you actively participate and your MAGI is under $100k (phasing out to $0 by $150k); unused losses carry forward. On sale, claimed depreciation is recaptured at up to 25%, and gains may owe capital-gains tax (a 1031 exchange can defer both). Figures are a year-1 estimate at your 24.0% rate — not tax advice; consult a CPA.
Schools (NCES district)
- District
- Boone Community School District
- NCES district ID
- 1905130
- Math proficiency
- 57% ▼ -6.00%
- Reading proficiency
- 66% ▲ 1.00%
- Median HH income
- $48,703
- Composite
- 52.16/100
- National rank
- #1613
- State rank
- #232 of 289 in IA
Livability — Boone
- Score
- 79/100
- State rank
- #112
- US rank
- #2144
Category grades
Schools grade is shown separately in the Schools card above.
Census & demographics
- Census place
- Boone, IA
- Population (ZIP)
- 16,318
Population outlook (Boone County) Hauer SSP2
- Today (2025)
- 27,674 people
- By 2030
- 28,058 · +1.4%
- By 2040
- 28,474 · +2.9%
- By 2050
- 28,383 · +2.6%
- By 2075
- 27,647 · -0.1%
- By 2100
- 25,485 · -7.9%
Race, ethnicity, and origin ACS 2023
- Neighborhood character
- Predominantly White (92%)
- Race & ethnicity
- White 92% Two or more races 4% Hispanic / Latino 3%
- Common ancestry
- Portuguese 10% Iranian 3% Slovak 3%
- Foreign-born
- 1%
- Languages at home
- 98% English-only · Spanish 1%
Political lean MEDSL · Boone
- 2024 margin
- Strong R (+21.5) · D 38.4% · R 59.9% · Other 1.6%
- 2008→2024 swing
- -29.2pp toward R · 2008: 7.6pp · 2024: -21.5pp
- All cycles
- 2024: R+21.5 2020: R+15.6 2016: R+13.9 2012: D+6.4 2008: D+7.6
Not yet ingested
- Civics
- —
Market trends
- HPI YoY
- ▼ -80.62%
- Current HPI
- 216.6814
- Rent YoY
- —
- Metro
- —
- State GDP YoY
- ▲ 2.48%
- F500 in state
- 4
Industry mix (Fortune 500 HQ in IA)
| Industry | F500 HQs | Revenue |
|---|---|---|
| Financial Services | 1 | $16B |
|
||
| Retail / Convenience | 1 | $15B |
|
||
Price history
-23.1% since first listed8 events — show timeline
- 2026-06-18 Price Changed $99,999 DMMLS
- 2026-06-18 Price Changed $99,999 CIBOR
- 2026-05-29 Price Changed $110,000 DMMLS
- 2026-05-29 Price Changed $110,000 CIBOR
- 2026-05-11 Price Changed $122,000 DMMLS
- 2026-05-11 Price Changed $122,000 CIBOR
- 2026-04-23 Listed $130,000 CIBOR
- 2026-04-23 Listed $130,000 DMMLS
Property tax history
+4.4%/yrLatest (2025): $1,618 · -3.1% YoY. Source: county tax records.
Cash-flow waterfall
monthlySold comps — $/sqft
last 12 mo · ≤1 miLoading sold comps…