6728 Apollo Trl · Bradfordville, FL
Flood risk 1/10 · Minimal
- FEMA flood zone
- X (unshaded)
- Chance of flooding over 30 yrs
- 0.0%
- Est. flood insurance / yr
- $507 – $1,088
Fire risk 3/10 · Minor
- Est. fire insurance / yr
- $947 – $1,759
Heat risk 8/10 · Major
- Hot days now (above 108°F)
- 7 days/yr
- Hot days in 30 yrs
- 20 days/yr
Wind risk 9/10 · Severe
- Chance of severe wind over 30 yrs
- 99.0%
Air-quality risk 5/10 · Moderate
- Unhealthy air days now
- 7 days/yr
- Unhealthy air days in 30 yrs
- 8 days/yr
Risk factors via First Street. Map © Google.
Why this score? — see what drove the B- grade
The composite is a weighted blend of 9 inputs, each scored 0–100. Each bar is that input's sub-score; the figure is the points it added to the 100-point composite (weight × sub-score).
- Cash flow +25.8/30.0
- ARV discount +15.0/15.0
- DSCR +8.6/10.0
- 1% rule +6.0/10.0
- Rent growth +4.8/5.0
- Schools +4.3/10.0
- Livability +2.5/5.0
- Condition / age +2.5/5.0
- Appreciation +0.0/10.0
$199,950
🖨 Deal sheet 📄 Offer letter ✓ Due diligence
Listing remarks
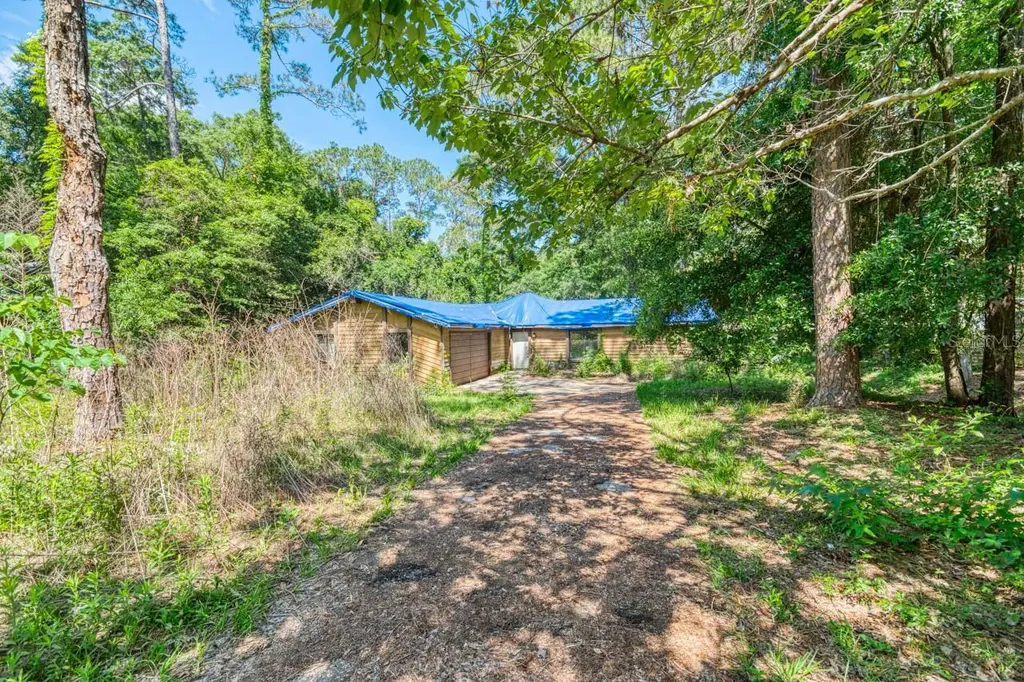
Investor special in the highly desirable Killearn Acres community! This 3BR/2BA fixer-upper offers endless potential for renovation, resale, or a personalized forever home. Situated on a spacious . 36-acre lot with mature trees, this property features over 1,600 sq ft, a fireplace, garage, and solid bones ready for your vision. Prime Northeast Tallahassee location just minutes from Bannerman Crossing, shopping, dining, parks, and easy access to I-10. Zoned for sought-after Desoto Trail, Montford, and Chiles schools. Rare opportunity to create value in one of Tallahassee’s most established and convenient neighborhoods. Sold as-is.
Key facts
- Spacious lot
- Easy access to i-10
- Mature trees
Tags
Property features AI
Finance
- Other: Lot size about 0.36 acre (approximately 0.25–0.49 acre)
Exterior
- Parking: Attached garage; 2-car garage
- Utilities: Well water; Septic tank; Other utilities
- Home design: Single family residence; Residential property; One story; Faces east
- Construction: Other construction materials; Other roof; Slab foundation; Building area approximately 2,121 square feet
- Exterior features: Other exterior features; Concrete road surface
Interior
- Kitchen: No appliances included
- Bedrooms: 3 bedrooms
- Flooring: Concrete floors
- Bathrooms: 2 full bathrooms
- Heating & cooling: Central heating; Central air conditioning
- Interior features: Fireplace in the living room; Other interior features
- Laundry & utility: Laundry closet
Neighborhood map
What this means for you Summary
Snapshot
- This is a 3-bed/2.0-bath single-family listed at $200k.
Deal economics
- At list price, monthly cash flow is $483 ($6k/yr) — positive.
- The deal already cash-flows at list — no discount required.
- Meets the 1% rule at list price ($2k rent vs $200k).
- Recommended offer: $194k (3.0% below list) — sets the bar for market timing.
- Cap rate 9.2% vs local median 3.0% in Bradfordville — top-decile yield for the area; either an underpriced asset or a hidden risk that comps aren't pricing in. Stress-test before assuming the spread holds.
Location & tenants
- Location reads: area grade B — affects rentability + tenant quality, not the cash-flow math above.
- Leon (urban): math 48% / reading 53% proficiency, ranked #33 of 73 in FL (top 45%) — acceptable for families but not a draw, mixed tenant base, ~2y average lease.
- Market conditions: Rents rising fast (+9.1%/yr); 107 active listings in the ZIP; 4 comparable units currently listed for rent nearby; rentals at typical pace (median 22d on market — plan ~3-4 weeks tenant-placement turnaround); high-income renter base; 1,765 units permitted in Leon County in 2024 (975 in 5+ unit buildings).
Forward outlook
- Local home prices are declining (-3.0%/yr); year-one equity from $1k of loan paydown is wiped out by about $6k of value loss. Plan a longer hold.
- Leon County population projected at +23% by 2050 — long-run rental-demand tailwind backs the buy-and-hold thesis.
- At projected returns (-3.0% appreciation + 8.0% rent growth), your $56k cash investment doubles in ~8 years — after that, you're playing with house money.
Negotiation context
- It's been on market 36 days — a 3% lower offer ($194k) is reasonable based on typical stale-listing flexibility.
- Current owner paid $66k; list at $200k implies a 205% gain — meaningful room to come down on a strong offer.
Risks & watch-outs
- Climate carrying-cost: severe wind risk, 99% chance of damaging wind over 30y; extreme-heat days projected 7→20/yr by 2055 (HVAC capex compounding) — expect insurance premiums to compound above CPI over the hold.
Questions for the listing agent
- It's been on market 36 days. Have you received any prior offers? Is the seller open to a 3% concession, seller financing, or rate buy-down credit?
- Built in 1979 — when were the roof, HVAC, electrical panel, plumbing, and water heater last replaced?
- Is there a deadline driving the sale (1031 exchange, divorce, estate, relocation)? That informs how much negotiation room exists.
- What's the average days-on-market for RENTAL listings here right now (not sales)? A rising rental-DOM trend means longer vacancies and softer asking-rent achievability than the comps imply.
- What's the recent tenant-quality profile in this submarket — average credit score on applications, eviction rate, late-payment / NSF rate, and stable-employment percentage? A property-management company in the area should have these aggregated.
- How much new for-sale + rental construction is in the pipeline within 1–3 miles? Heavy new supply typically softens prices + rents 12–24 months out; constrained supply supports both.
Investment metrics
- 1% rule
- 1.10% ✓
- Cap rate
- 9.19%
- Cash-on-cash
- 10.34%
- DSCR
- 1.46
- GRM
- 7.6
CMA / ARV
- ARV (on-the-fly)
- $344,540
- Comps found
- 12
Show comp detail 12 sales within ~0.75 mi
| Address | Dist | Beds/Ba | Sqft | Sold | Price | $/sf | Match |
|---|---|---|---|---|---|---|---|
| 6428 Count Turf Trl | 0.37mi | 3/2.0 | 1,612 (+0%) | 4mo | $359,900 | $223 | 79 |
| 3413 Native Dancer Trl | 0.33mi | 3/2.0 | 1,516 (-6%) | 2mo | $325,000 | $214 | 73 |
| 3504 Whirlaway Trl | 0.48mi | 3/2.0 | 1,668 (+4%) | 4mo | $320,000 | $192 | 68 |
| 6631 Kingman Trl | 0.27mi | 3/2.0 | 1,444 (-10%) | 4mo | $330,000 | $229 | 67 |
| 6732 Secretariat Dr | 0.37mi | 3/2.0 | 1,437 (-11%) | 3mo | $260,000 | $181 | 63 |
| 5024 Pimlico Dr | 0.62mi | 3/2.0 | 1,500 (-7%) | 1mo | $315,000 | $210 | 58 |
| 6530 Iron Liege Trl | 0.57mi | 3/2.0 | 1,476 (-8%) | 4mo | $327,400 | $222 | 56 |
| 6528 Kingman Trl | 0.41mi | 4/2.0 (+1) | 1,764 (+10%) | 5mo | $330,000 | $187 | 55 |
| 3105 Elwood Trl | 0.68mi | 4/2.0 (+1) | 1,665 (+3%) | 5mo | $305,000 | $183 | 53 |
| 3228 Lord Murphy Trl | 0.47mi | 3/2.0 | 1,836 (+14%) | 3mo | $289,000 | $157 | 53 |
| 6525 Iron Liege Trl | 0.56mi | 3/2.0 | 1,403 (-13%) | 2mo | $310,000 | $221 | 51 |
| 6842 Hill Gail Trl | 0.68mi | 3/2.0 | 1,426 (-11%) | 2mo | $360,000 | $252 | 48 |
Match score weights: distance 35% · size 25% · config 20% · recency 20%. Top-matched comps best support the ARV.
Projected returns pro-forma
-3.0% appreciation · 8.0% rent growth · sell at horizon
- IRR
- 4.4%
- Equity multiple
- 1.18×
- Total profit
- $9,910
- Equity at exit
- $29,813
- IRR
- 17.8%
- Equity multiple
- 2.80×
- Total profit
- $100,917
- Equity at exit
- $17,288
Cash invested: $55,986 (down + closing). Projections, not guarantees.
Landlord ↔ Tenant lean methodology
- Overall (STATE)
- 87 Strongly Landlord-Friendly
- State Florida
- 87 Strongly Landlord-Friendly · R+3
- County
- — inherits STATE
- City
- — inherits STATE
ZIP-level market 32309
- Rents YoY
- 9.1%
- Active inventory
- 107
- Price-to-rent
- 7.6×
Monthly cashflow live
- Estimated rent
- $2,199 medium interval (Pro) →
- Mortgage (P&I)
- −$1,049
- Tax from tax record
- −$123 /mo · $1,475/yr
- Insurance
- −$83
- HOA
- −$0
- Vacancy / Maint / Mgmt
- −$462
- Net cashflow
- $483
Break-even live
UW: 25.0% down · 7.5% · 30yr · 1.5% tax · 5.0% vac · 8.0% maint · 8.0% mgmt
Financing live
Cash to close
- Down payment
- $49,988
- Closing costs
- $5,998
- Reserves months
- —
- Total cash needed
- —
Loan-product check · same deal, 3 products live
Conventional
25% down · 7.5% · 30yr
- Down + closing
- —
- Monthly P&I
- —
- Monthly cashflow
- —
- DSCR
- —
- Eligible?
- —
Personal DTI + credit; lowest rate.
DSCR
20% down · 8.5% · 30yr
- Down + closing
- —
- Monthly P&I
- —
- Monthly cashflow
- —
- DSCR
- —
- Eligible?
- —
No personal income docs; deal must DSCR.
Hard money
10% down · 12.0% · 12mo
- Down + closing
- —
- Monthly P&I
- —
- Monthly cashflow
- —
- DSCR
- —
- Eligible?
- —
Short-term bridge; refi at stabilization.
Rent comps 4 comps
| Address | Beds | Baths | Sqft | Rent | $/sqft | DOM | Units | Dist |
|---|---|---|---|---|---|---|---|---|
| 3208 Majestic Prince Trl Unit NA Tallahassee, FL | 3.0 | 2.0 | 1397 | $2,700 | $1.93 | 21d | 1 | 0.30mi |
| 6742 Alan a Dale Trl Tallahassee, FL | 3.0 | 2.0 | 1550 | $2,300 | $1.48 | 21d | 1 | 0.54mi |
| 6837 Hill Gail Trl Tallahassee, FL | 3.0 | 2.0 | 1800 | $2,200 | $1.22 | 14d | 1 | 0.64mi |
| 2948 Whirlaway Trl Tallahassee, FL | 3.0 | 2.0 | 1394 | $2,150 | $1.54 | 21d | 1 | 1.07mi |
Listing history 17 events
-
2026-06-18days on market $199,950 Active 36 DOM
-
2026-06-17days on market $199,950 Active 35 DOM
-
2026-06-16days on market $199,950 Active 34 DOM
-
2026-06-15days on market $199,950 Active 33 DOM
-
2026-06-14days on market $199,950 Active 31 DOM
-
2026-06-10days on market $199,950 Active 28 DOM
-
2026-06-09days on market $199,950 Active 27 DOM
-
2026-06-08days on market $199,950 Active 26 DOM
-
2026-06-07days on market $199,950 Active 25 DOM
-
2026-06-05days on market $199,950 Active 22 DOM
-
2026-06-03days on market $199,950 Active 21 DOM
-
2026-06-02days on market $199,950 Active 20 DOM
-
2026-06-01days on market $199,950 Active 19 DOM
-
2026-05-31days on market $199,950 Active 18 DOM
-
2026-05-30days on market $199,950 Active 17 DOM
-
2026-05-13$199,950 Active
-
1980-05-01soldstatus $65,600
ⓘ Source: listings_history table (triggers on properties + properties_extension) + one-shot
backfill from property_details.listing_events for pre-trigger history.
Tax reassessment forecast FL · Resets to sale price
- Current annual tax
- $1,475 · $123/mo
- Projected year-2 tax
- $1,660 · $138/mo
- Expected delta
- +$185/yr (+$15/mo · 12.6%)
ⓘ Screening estimate from a state-policy table — verify with the county assessor before closing.
Climate risk First Street
- Flood 1/10 Low FEMA zone X (unshaded) · 0% chance over 30 yrs
- Wildfire 3/10 Moderate
- Heat 8/10 Severe 7 d/yr ≥108°F today · 20 d/yr by 30 yrs out
- Wind 9/10 Extreme 99% chance of damaging wind over 30 yrs
- Air quality 5/10 Major 7 unhealthy d/yr today · 8 by 30 yrs out
Nearby sold comps map
Loading sold comps map…
Walkable amenities ~0.75 mi
Loading nearby amenities…
Taxation est. · year 1
- Rental income
- $26,389
- − Mortgage interest
- −$11,200
- − Property taxes
- −$1,475
- − Insurance
- −$1,000
- − Repairs & maintenance
- −$2,111
- − Management
- −$2,111
- − Depreciation
- −$5,817
- Taxable income
- $2,676
- Est. tax owed @ 24.0%
- −$642
- After-tax cash flow
- $5,148/yr
For passive investors: Depreciation is non-cash, so a rental often shows a tax loss while cash-flowing — sheltering income. Rental losses are passive: they offset passive income freely, and up to $25,000/yr can offset ordinary (W-2) income if you actively participate and your MAGI is under $100k (phasing out to $0 by $150k); unused losses carry forward. On sale, claimed depreciation is recaptured at up to 25%, and gains may owe capital-gains tax (a 1031 exchange can defer both). Figures are a year-1 estimate at your 24.0% rate — not tax advice; consult a CPA.
Schools (NCES district)
- District
- Leon
- NCES district ID
- 1201110
- Math proficiency
- 48% ▼ -13.00%
- Reading proficiency
- 53% ▼ -5.00%
- Median HH income
- $46,339
- Composite
- 42.84/100
- National rank
- #3131
- State rank
- #33 of 73 in FL
Livability — Bradfordville
No livability data for this city. (Only ~50 U.S. cities are tracked.)
Census & demographics
- Census place
- Bradfordville, FL
- County
- Leon County · 294,472 people
- City population
- 31,966
- Metro
- Tallahassee, FL
- Population (ZIP)
- 33,544
- Household income
- $113,412
- Rent vs Own
- Severe rent burden
- 789.0
Population outlook (Leon County) Hauer SSP2
- Today (2025)
- 315,507 people
- By 2030
- 330,677 · +4.8%
- By 2040
- 358,465 · +13.6%
- By 2050
- 386,804 · +22.6%
- By 2075
- 465,480 · +47.5%
- By 2100
- 519,959 · +64.8%
Race, ethnicity, and origin ACS 2023
- Neighborhood character
- Predominantly White (75%)
- Race & ethnicity
- White 75% Black 9% Two or more races 9% Hispanic / Latino 8% Asian 3%
- Hispanic origin (detail)
- Mexican 2% Cuban 3%
- Common ancestry
- Slovak 4% Lithuanian 3% Italian 3%
- Foreign-born
- 7% · Canada, South Korea
- Languages at home
- 92% English-only · Spanish 3% Russian/Polish/Slavic 1% Other Asian/Pacific 1%
Political lean MEDSL · Leon
- 2024 margin
- Strong D (+21.8) · D 60.3% · R 38.5% · Other 1.2%
- 2008→2024 swing
- -2.5pp toward R · 2008: 24.3pp · 2024: 21.8pp
- All cycles
- 2024: D+21.8 2020: D+28.3 2016: D+25.1 2012: D+23.6 2008: D+24.3
Not yet ingested
- Civics
- —
Market trends
- HPI YoY
- ▼ -212.85%
- Current HPI
- 247.4336
- Rent YoY
- ▲ 9.06%
- Metro
- Tallahassee, FL
- State GDP YoY
- ▲ 3.28%
- F500 in state
- 36
Industry mix (Fortune 500 HQ in FL)
| Industry | F500 HQs | Revenue |
|---|---|---|
| Industrial Technology | 2 | $29B |
|
||
| Insurance | 2 | $17B |
|
||
| Retail | 1 | $60B |
|
||
| Technology Distribution | 1 | $58B |
|
||
| Homebuilding | 1 | $35B |
|
||
| Technology Manufacturing | 1 | $35B |
|
||
Price history
+204.8% since first listed2 events — show timeline
- 2026-05-13 Listed $199,950 Stellar MLS as Distributed by MLS Grid
- 1980-05-01 Sold (Public Records) $65,600 Public Records
Property tax history
+2.9%/yrLatest (2025): $1,475 · +22.0% YoY. Source: county tax records.
Cash-flow waterfall
monthlySold comps — $/sqft
last 12 mo · ≤1 miLoading sold comps…