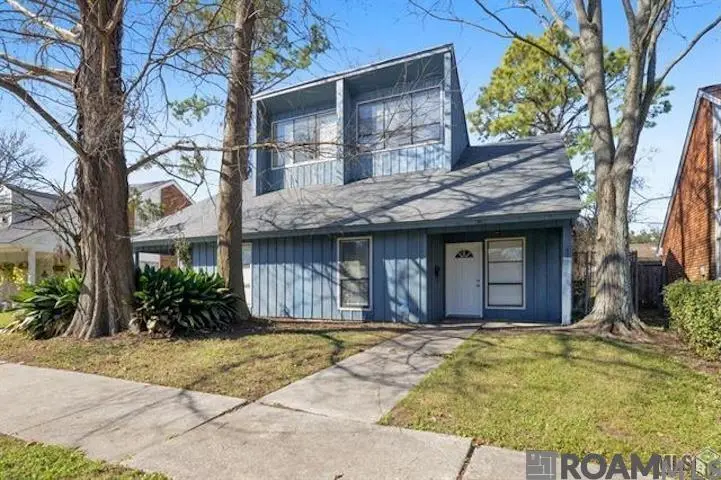
4932 Alvin Dark Ave · Baton Rouge, LA
Flood risk 1/10 · Minimal
- FEMA flood zone
- X
- Chance of flooding over 30 yrs
- 0.0%
- Est. flood insurance / yr
- $507 – $1,088
Fire risk 1/10 · Minimal
- Est. fire insurance / yr
- $1,269 – $2,357
Heat risk 8/10 · Major
- Hot days now (above 108°F)
- 7 days/yr
- Hot days in 30 yrs
- 20 days/yr
Wind risk 9/10 · Severe
- Chance of severe wind over 30 yrs
- 99.0%
Air-quality risk 2/10 · Minimal
- Unhealthy air days now
- 1 days/yr
- Unhealthy air days in 30 yrs
- 1 days/yr
Risk factors via First Street. Map © Google.
Why this score? — see what drove the B grade
The composite is a weighted blend of 9 inputs, each scored 0–100. Each bar is that input's sub-score; the figure is the points it added to the 100-point composite (weight × sub-score).
- Cash flow +29.2/30.0
- ARV discount +14.8/15.0
- DSCR +10.0/10.0
- 1% rule +7.9/10.0
- Livability +3.7/5.0
- Rent growth +3.2/5.0
- Condition / age +2.5/5.0
- Schools +2.4/10.0
- Appreciation +0.0/10.0
$124,900
🖨 Deal sheet 📄 Offer letter ✓ Due diligence
Listing remarks MLS
Check out this income-producing duplex just minutes from LSU! Opportunities like this do not come around often, especially in a location with consistent rental demand. This tenant-occupied duplex offers immediate cash flow from day one. This unit features well-maintained interiors with neutral paint tones that appeal to a wide range of tenants and help keep vacancies low. Even better, tenants pay all utilities, helping maximize your return while keeping operating costs simple. Located on the LSU bus route, this property sits in a high-demand rental corridor where student and long-term tenants alike continue to drive strong occupancy. A covered carport provides convenient parking, and with no HOA dues, ownership remains straightforward and investor-friendly. Whether you are looking to expand your portfolio, secure a reliable income property near LSU, or take advantage of the recent price adjustment, this is the kind of opportunity serious investors move quickly on.
Key facts
- Covered carport
- No hoa dues
- 4,356 sq ft lot
Tags
Neighborhood map
What this means for you Summary
Snapshot
- This is a 2-bed/2.0-bath single-family listed at $125k.
Deal economics
- At list price, monthly cash flow is $436 ($5k/yr) — positive.
- The deal already cash-flows at list — no discount required.
- Meets the 1% rule at list price ($2k rent vs $125k).
- Recommended offer: $117k (6.0% below list) — sets the bar for market timing.
- Cap rate 10.5% vs local median 4.3% in Baton Rouge — top-decile yield for the area; either an underpriced asset or a hidden risk that comps aren't pricing in. Stress-test before assuming the spread holds.
Location & tenants
- Location reads 74/100 on livability (#24 in LA, #4,535 nationally) — a middle-class / working-renter tenant base. Strengths: commute A+, cost of living A+, health & safety A+; Watch: amenities D, crime F, employment D-.
- East Baton Rouge Parish (urban): math 22% / reading 34% proficiency, ranked #47 of 98 in LA (top 48%) — low school quality limits family demand, transient renter base, plan for 1-2y turnover; 77% free/reduced lunch — lower-income household profile, screen leases tightly.
- Market conditions: Rents rising (+2.8%/yr); 315 active listings in the ZIP; 40 comparable units currently listed for rent nearby; rentals at typical pace (median 23d on market — plan ~3-4 weeks tenant-placement turnaround); 2,252 units permitted in East Baton Rouge Parish in 2024 (440 in 5+ unit buildings).
- This rent runs 41% of the median local income ($47k/yr) — at the standard rent-burdened threshold; future hikes will face affordability resistance.
Forward outlook
- Local home prices are declining (-3.0%/yr); year-one equity from $864 of loan paydown is wiped out by about $4k of value loss. Plan a longer hold.
- East Baton Rouge County population projected at +4% by 2050 — modest demand growth; plan on rents tracking national, not racing it.
- At projected returns (-3.0% appreciation + 2.8% rent growth), your $35k cash investment doubles in ~8 years — after that, you're playing with house money.
Negotiation context
- It's been on market 70 days — a 6% lower offer ($117k) is reasonable based on typical stale-listing flexibility.
- 9 sale attempts since 28y ago; this cycle's ask has dropped $10k (7%) from the opening price — seller is motivated, your offer sets the floor, not the list.
Risks & watch-outs
- Climate carrying-cost: severe wind risk, 99% chance of damaging wind over 30y; extreme-heat days projected 7→20/yr by 2055 (HVAC capex compounding) — expect insurance premiums to compound above CPI over the hold.
Questions for the listing agent
- It's been on market 70 days. Have you received any prior offers? Is the seller open to a 6% concession, seller financing, or rate buy-down credit?
- Built in 1977 — when were the roof, HVAC, electrical panel, plumbing, and water heater last replaced?
- Why hasn't it sold? Are there any deal-killer items the seller is aware of (foundation, flood, title, zoning, code violations)?
- Is there a deadline driving the sale (1031 exchange, divorce, estate, relocation)? That informs how much negotiation room exists.
- Crime grade is F in this area — have there been break-ins, vandalism, or insurance claims at this property in the last 3 years? What carrier currently insures it and at what premium?
- What's the average days-on-market for RENTAL listings here right now (not sales)? A rising rental-DOM trend means longer vacancies and softer asking-rent achievability than the comps imply.
- What's the recent tenant-quality profile in this submarket — average credit score on applications, eviction rate, late-payment / NSF rate, and stable-employment percentage? A property-management company in the area should have these aggregated.
- How much new for-sale + rental construction is in the pipeline within 1–3 miles? Heavy new supply typically softens prices + rents 12–24 months out; constrained supply supports both.
Investment metrics
- 1% rule
- 1.29% ✓
- Cap rate
- 10.48%
- Cash-on-cash
- 14.96%
- DSCR
- 1.67
- GRM
- 6.4
CMA / ARV
- ARV (median comp)
- $148,978
- List price
- $124,900
- Delta
- -16.16%
- Verdict
- UNDERPRICED
- Comps
- 20 within 1.0 mi
Show comp detail 12 sales within ~0.75 mi
| Address | Dist | Beds/Ba | Sqft | Sold | Price | $/sf | Match |
|---|---|---|---|---|---|---|---|
| 1270 Sharlo Ave | 0.06mi | 2/2.0 | 1,465 (-2%) | 1mo | $140,000 | $96 | 94 |
| 2334 Brightside Dr | 0.19mi | 3/2.0 (+1) | 1,482 (-0%) | 2mo | $148,000 | $100 | 83 |
| 2216 Brightside Dr | 0.14mi | 3/2.0 (+1) | 1,478 (-1%) | 6mo | $164,000 | $111 | 82 |
| 1517 Sharlo Ave | 0.12mi | 2/2.0 | 1,444 (-3%) | 9mo | $120,000 | $83 | 82 |
| 1550 Sharlo Ave | 0.20mi | 2/2.0 | 1,379 (-7%) | 7mo | $123,500 | $90 | 73 |
| 1318 Sharlo Ave | 0.09mi | 2/2.0 | 1,363 (-8%) | 14mo | $156,000 | $114 | 70 |
| 1557 Sharlo Ave | 0.14mi | 2/2.0 | 1,328 (-11%) | 15mo | $134,900 | $102 | 63 |
| 2344 Brightside Dr | 0.20mi | 3/2.0 (+1) | 1,651 (+11%) | 6mo | $179,000 | $108 | 63 |
| 1310 Sharlo Ave | 0.08mi | 3/2.0 (+1) | 1,653 (+11%) | 12mo | $190,000 | $115 | 63 |
| 2405 Brightside Dr Apt 64 | 0.34mi | 2/2.5 | 1,300 (-13%) | 0mo | $168,000 | $129 | 60 |
| 1512 Sharlo Ave | 0.19mi | 3/2.0 (+1) | 1,355 (-9%) | 15mo | $149,900 | $111 | 59 |
| 1361 Harwich Dr | 0.25mi | 3/2.0 (+1) | 1,272 (-15%) | 9mo | $210,000 | $165 | 52 |
Match score weights: distance 35% · size 25% · config 20% · recency 20%. Top-matched comps best support the ARV.
Projected returns pro-forma
-3.0% appreciation · 2.79% rent growth · sell at horizon
- IRR
- 5.3%
- Equity multiple
- 1.21×
- Total profit
- $7,200
- Equity at exit
- $18,623
- IRR
- 14.6%
- Equity multiple
- 2.16×
- Total profit
- $40,678
- Equity at exit
- $10,799
Cash invested: $34,972 (down + closing). Projections, not guarantees.
Landlord ↔ Tenant lean methodology
- Overall (STATE)
- 90 Strongly Landlord-Friendly
- State Louisiana
- 90 Strongly Landlord-Friendly · R+12
- County
- — inherits STATE
- City
- — inherits STATE
ZIP-level market 70820
- Home prices YoY
- -29.9%
- Rents YoY
- 2.8%
- Active inventory
- 315
- Price-to-rent
- 6.4×
Monthly cashflow live
- Estimated rent
- $1,615 high interval (Pro) →
- Mortgage (P&I)
- −$655
- Tax from tax record
- −$133 /mo · $1,597/yr
- Insurance
- −$52
- HOA
- −$0
- Vacancy / Maint / Mgmt
- −$339
- Net cashflow
- $436
Break-even live
UW: 25.0% down · 7.5% · 30yr · 1.5% tax · 5.0% vac · 8.0% maint · 8.0% mgmt
Financing live
Cash to close
- Down payment
- $31,225
- Closing costs
- $3,747
- Reserves months
- —
- Total cash needed
- —
Loan-product check · same deal, 3 products live
Conventional
25% down · 7.5% · 30yr
- Down + closing
- —
- Monthly P&I
- —
- Monthly cashflow
- —
- DSCR
- —
- Eligible?
- —
Personal DTI + credit; lowest rate.
DSCR
20% down · 8.5% · 30yr
- Down + closing
- —
- Monthly P&I
- —
- Monthly cashflow
- —
- DSCR
- —
- Eligible?
- —
No personal income docs; deal must DSCR.
Hard money
10% down · 12.0% · 12mo
- Down + closing
- —
- Monthly P&I
- —
- Monthly cashflow
- —
- DSCR
- —
- Eligible?
- —
Short-term bridge; refi at stabilization.
Rent comps 40 comps
| Address | Beds | Baths | Sqft | Rent | $/sqft | DOM | Units | Dist |
|---|---|---|---|---|---|---|---|---|
| 1274 Sharlo Ave Unit 1519871P Baton Rouge, LA | 3.0 | 2.0 | 1786 | $3,298 | $1.85 | 14d | 1 | 0.06mi |
| 2000 Brightside Dr Baton Rouge, LA | 1.0–3.0 | 1.0–2.0 | 792 | $1,252 | $1.58 | 14d | 1 | 0.10mi |
| 2073 Brightside Dr Baton Rouge, LA | 2.0 | 2.0 | 1100 | $1,200 | $1.09 | 23d | 1 | 0.14mi |
| 5112 Arlington Ct Baton Rouge, LA | 3.0 | 3.0 | 1601 | $1,850 | $1.16 | 43d | 1 | 0.16mi |
| 5124 Brightside View Dr #3 Baton Rouge, LA | 2.0 | 1.5 | 1000 | $875 | $0.88 | 43d | 1 | 0.19mi |
| 5124 Brightside View Dr #4 Baton Rouge, LA | 2.0 | 1.0 | 1000 | $875 | $0.88 | 43d | 1 | 0.19mi |
| 5124 Brightside View Dr #4 Baton Rouge, LA | 2.0 | 1.5 | 1000 | $999 | $1.00 | 23d | 1 | 0.19mi |
| 2452 Brightside Dr Baton Rouge, LA | 2.0 | 2.0 | 1246 | $1,600 | $1.28 | 14d | 1 | 0.21mi |
| 2122 Stonehenge Ave Baton Rouge, LA | 2.0 | 1.5 | 1540 | $1,550 | $1.01 | 43d | 1 | 0.21mi |
| 1345 Harwich Dr Baton Rouge, LA | 3.0 | 2.0 | 1478 | $1,800 | $1.22 | 43d | 1 | 0.25mi |
| 4554 Y A Tittle Ave #2 Baton Rouge, LA | 2.0 | 1.0 | 900 | $825 | $0.92 | 14d | 1 | 0.26mi |
| 5268 S Brightside View Dr Apt 2 Baton Rouge, LA | 3.0 | 2.5 | 1348 | $1,250 | $0.93 | 43d | 1 | 0.27mi |
| 1724 Brightside Dr Apt A Baton Rouge, LA | 2.0 | 1.5 | 1050 | $1,025 | $0.98 | 23d | 1 | 0.29mi |
| 1704 Brightside Dr Unit C Baton Rouge, LA | 2.0 | 2.0 | 1088 | $1,175 | $1.08 | 21d | 1 | 0.30mi |
| 1983 S Brightside View Dr Baton Rouge, LA | 2.0 | 2.0 | 1270 | $1,100 | $0.87 | 21d | 1 | 0.31mi |
| 1983 S Brightside View Dr Unit C Baton Rouge, LA | 2.0 | 2.5 | 1124 | $1,195 | $1.06 | 43d | 1 | 0.31mi |
| 1953 S Brightside View Dr Unit B Baton Rouge, LA | 2.0 | 2.5 | 1218 | $1,300 | $1.07 | 14d | 1 | 0.31mi |
| 4521 Y a Tittle Ave Baton Rouge, LA | 3.0 | 2.0 | 1300 | $1,150 | $0.88 | 14d | 1 | 0.31mi |
| 2021 S Brightside View Dr Unit C Baton Rouge, LA | 2.0 | 2.5 | 1250 | $1,250 | $1.00 | 43d | 1 | 0.31mi |
| 2173 Plantation Ln Baton Rouge, LA | 2.0 | 2.0 | 1374 | $1,200 | $0.87 | 21d | 1 | 0.31mi |
| 1714 Brightside Dr Unit A Baton Rouge, LA | 2.0 | 1.5 | 1050 | $1,025 | $0.98 | 43d | 1 | 0.32mi |
| 1741 Brightside Dr Baton Rouge, LA | 2.0–3.0 | 2.0 | 1436 | $1,500 | $1.04 | 14d | 3 | 0.32mi |
| 5648 Riverstone Dr Unit 94A Baton Rouge, LA | 2.0 | 2.0 | 1603 | $1,250 | $0.78 | 21d | 1 | 0.33mi |
| 1835 S Brightside View Dr Unit C Baton Rouge, LA | 2.0 | 2.5 | 1250 | $1,375 | $1.10 | 23d | 1 | 0.33mi |
| 4445 Alvin Dark Ave Baton Rouge, LA | 1.0–3.0 | 1.0–3.0 | 869 | $1,003 | $1.15 | 14d | 14 | 0.39mi |
| 839 E Boyd Dr Unit C Baton Rouge, LA | 2.0 | 1.5 | 1080 | $1,400 | $1.30 | 18d | 1 | 0.60mi |
| 837 E Boyd Dr Unit A Baton Rouge, LA | 2.0 | 1.5 | 1080 | $1,300 | $1.20 | 18d | 1 | 0.61mi |
| 5107 Nicholson Dr Unit A30 Baton Rouge, LA | 2.0 | 2.0 | 1365 | $1,350 | $0.99 | 23d | 1 | 0.61mi |
| 5111 Nicholson Dr Unit A44 Baton Rouge, LA | 3.0 | 2.0 | 1567 | $1,650 | $1.05 | 23d | 1 | 0.63mi |
| 900 Dean Lee Dr Baton Rouge, LA | 2.0–3.0 | 2.0–3.0 | 1585 | $1,550 | $0.98 | 23d | 3 | 0.71mi |
| 900 Dean Lee Dr Baton Rouge, LA | 2.0–3.0 | 2.0–3.0 | 1585 | $1,300 | $0.82 | 43d | 3 | 0.71mi |
| 5157 Etta St Unit 4G Baton Rouge, LA | 3.0 | 2.0 | 1473 | $1,650 | $1.12 | 43d | 1 | 0.78mi |
| 582 Jennifer Jean Dr Baton Rouge, LA | 3.0 | 2.0 | 1370 | $1,500 | $1.09 | 43d | 1 | 0.78mi |
| 4441 Burbank Dr #108 Baton Rouge, LA | 3.0 | 3.0 | 1500 | $1,725 | $1.15 | 23d | 1 | 0.86mi |
| 436 Jennifer Jean Dr Baton Rouge, LA | 3.0 | 2.0 | 1100 | $1,950 | $1.77 | 14d | 1 | 0.88mi |
| 436 Jennifer Jean Dr Baton Rouge, LA | 3.0 | 2.0 | 1100 | $1,950 | $1.77 | 23d | 1 | 0.88mi |
| 4441 Burbank Dr Baton Rouge, LA | 3.0 | 2.0–3.0 | 1544 | $1,750 | $1.13 | 43d | 2 | 0.90mi |
| 4464 Highland Rd Baton Rouge, LA | 2.0 | 2.0 | 1219 | $1,675 | $1.37 | 43d | 1 | 1.05mi |
| 4264 Oxford Ave Unit 3 Baton Rouge, LA | 2.0 | 1.0 | 1000 | $1,350 | $1.35 | 43d | 1 | 1.15mi |
| 4264 Oxford Ave Unit 4 Baton Rouge, LA | 2.0 | 1.0 | 1000 | $1,295 | $1.29 | 23d | 1 | 1.15mi |
Listing history 32 events
-
2026-06-18days on market $124,900 Active 70 DOM
-
2026-06-17days on market $124,900 Active 69 DOM
-
2026-06-16days on market $124,900 Active 68 DOM
-
2026-06-15price $124,900 Active 67 DOM
-
2026-06-15days on market $127,900 Active 67 DOM
-
2026-06-14days on market $127,900 Active 65 DOM
-
2026-06-10days on market $127,900 Active 62 DOM
-
2026-06-09days on market $127,900 Active 61 DOM
-
2026-06-08days on market $127,900 Active 60 DOM
-
2026-06-07days on market $127,900 Active 59 DOM
-
2026-06-05days on market $127,900 Active 56 DOM
-
2026-06-03pricedays on market $127,900 Active 55 DOM
-
2026-06-02days on market $129,900 Active 54 DOM
-
2026-06-01days on market $129,900 Active 53 DOM
-
2026-05-31days on market $129,900 Active 52 DOM
-
2026-05-31days on market $129,900 Active 51 DOM
-
2026-04-16price $129,900 978-char remark
Show marketing remark (978 chars)
Check out this income-producing duplex just minutes from LSU! Opportunities like this do not come around often, especially in a location with consistent rental demand. This tenant-occupied duplex offers immediate cash flow from day one. This unit features well-maintained interiors with neutral paint tones that appeal to a wide range of tenants and help keep vacancies low. Even better, tenants pay all utilities, helping maximize your return while keeping operating costs simple. Located on the LSU bus route, this property sits in a high-demand rental corridor where student and long-term tenants alike continue to drive strong occupancy. A covered carport provides convenient parking, and with no HOA dues, ownership remains straightforward and investor-friendly. Whether you are looking to expand your portfolio, secure a reliable income property near LSU, or take advantage of the recent price adjustment, this is the kind of opportunity serious investors move quickly on.
-
2026-04-09$134,900 Active 978-char remark
Show marketing remark (978 chars)
Check out this income-producing duplex just minutes from LSU! Opportunities like this do not come around often, especially in a location with consistent rental demand. This tenant-occupied duplex offers immediate cash flow from day one. This unit features well-maintained interiors with neutral paint tones that appeal to a wide range of tenants and help keep vacancies low. Even better, tenants pay all utilities, helping maximize your return while keeping operating costs simple. Located on the LSU bus route, this property sits in a high-demand rental corridor where student and long-term tenants alike continue to drive strong occupancy. A covered carport provides convenient parking, and with no HOA dues, ownership remains straightforward and investor-friendly. Whether you are looking to expand your portfolio, secure a reliable income property near LSU, or take advantage of the recent price adjustment, this is the kind of opportunity serious investors move quickly on.
-
2024-06-14soldstatus
-
2024-05-30$1,400
-
2022-02-01soldstatus
-
2022-01-20$1,295
-
2020-12-02soldstatus
-
2020-11-09$1,095
-
2017-12-01soldstatus Sold
-
2017-10-22$64,900 Active
-
2017-10-17$64,900
-
2008-02-07soldstatus $121,000
-
2007-10-08$125,000
-
1998-01-16$72,500
ⓘ Source: listings_history table (triggers on properties + properties_extension) + one-shot
backfill from property_details.listing_events for pre-trigger history.
Tax reassessment forecast LA · Resets to sale price
- Current annual tax
- $1,597 · $133/mo
- Projected year-2 tax
- $1,597 · $133/mo
- Expected delta
- $0/yr ($0/mo · 0.0%)
ⓘ Screening estimate from a state-policy table — verify with the county assessor before closing.
Climate risk First Street
- Flood 1/10 Low FEMA zone X · 0% chance over 30 yrs
- Wildfire 1/10 Low
- Heat 8/10 Severe 7 d/yr ≥108°F today · 20 d/yr by 30 yrs out
- Wind 9/10 Extreme 99% chance of damaging wind over 30 yrs
- Air quality 2/10 Low 1 unhealthy d/yr today · 1 by 30 yrs out
Nearby sold comps map
Loading sold comps map…
Walkable amenities ~0.75 mi
Loading nearby amenities…
Taxation est. · year 1
- Rental income
- $19,385
- − Mortgage interest
- −$6,996
- − Property taxes
- −$1,597
- − Insurance
- −$624
- − Repairs & maintenance
- −$1,551
- − Management
- −$1,551
- − Depreciation
- −$3,633
- Taxable income
- $3,431
- Est. tax owed @ 24.0%
- −$824
- After-tax cash flow
- $4,409/yr
For passive investors: Depreciation is non-cash, so a rental often shows a tax loss while cash-flowing — sheltering income. Rental losses are passive: they offset passive income freely, and up to $25,000/yr can offset ordinary (W-2) income if you actively participate and your MAGI is under $100k (phasing out to $0 by $150k); unused losses carry forward. On sale, claimed depreciation is recaptured at up to 25%, and gains may owe capital-gains tax (a 1031 exchange can defer both). Figures are a year-1 estimate at your 24.0% rate — not tax advice; consult a CPA.
Schools (NCES district)
- District
- East Baton Rouge Parish
- NCES district ID
- 2200540
- Math proficiency
- 22% ▼ -36.00%
- Reading proficiency
- 34% ▼ -31.00%
- Median HH income
- $46,263
- Composite
- 24.14/100
- National rank
- #7745
- State rank
- #47 of 98 in LA
Livability — Baton Rouge
- Score
- 74/100
- State rank
- #24
- US rank
- #4535
Category grades
Schools grade is shown separately in the Schools card above.
Census & demographics
- Census place
- Baton Rouge, LA
- County
- East Baton Rouge Parish · 399,686 people
- City population
- 351,868
- Metro
- Baton Rouge, LA
- Population (ZIP)
- 23,377
- Household income
- $47,429
- Rent vs Own
- Severe rent burden
- 1879.0
Population outlook (East Baton Rouge County) Hauer SSP2
- Today (2025)
- 464,810 people
- By 2030
- 472,137 · +1.6%
- By 2040
- 480,243 · +3.3%
- By 2050
- 484,422 · +4.2%
- By 2075
- 492,069 · +5.9%
- By 2100
- 476,347 · +2.5%
Race, ethnicity, and origin ACS 2023
- Neighborhood character
- Diverse neighborhood (Simpson 0.63)
- Race & ethnicity
- White 56% Black 21% Hispanic / Latino 13% Asian 7% Two or more races 5% Native American 2%
- Hispanic origin (detail)
- Mexican 3%
- Common ancestry
- Lithuanian 7% Italian 2% Scotch-Irish 1%
- Foreign-born
- 13% · Canada, China, South Korea
- Languages at home
- 84% English-only · Spanish 9% Other Indo-European 3% Chinese 1%
Political lean MEDSL · East Baton Rouge
- 2024 margin
- D (+11.1) · D 54.5% · R 43.4% · Other 2.1%
- 2008→2024 swing
- +8.9pp toward D · 2008: 2.2pp · 2024: 11.1pp
- All cycles
- 2024: D+11.1 2020: D+13.1 2016: D+9.2 2012: D+5.2 2008: D+2.2
Not yet ingested
- Civics
- —
Market trends
- HPI YoY
- ▼ -56.10%
- Current HPI
- 131.5382
- Rent YoY
- ▲ 2.79%
- Metro
- Baton Rouge, LA
- State GDP YoY
- ▲ 3.29%
- F500 in state
- 10
Industry mix (Fortune 500 HQ in LA)
| Industry | F500 HQs | Revenue |
|---|---|---|
| Telecommunications | 2 | $23B |
|
||
| Utilities | 1 | $12B |
|
||
| Wholesale / Distribution | 1 | $5B |
|
||
| Advertising | 1 | $2B |
|
||
Price history
+79.2% since first listed16 events — show timeline
- 2026-04-16 Price Changed $129,900 AcadianaMLS
- 2026-04-16 Price Changed $129,900 GBRMLS
- 2026-04-09 Listed $134,900 GBRMLS
- 2026-04-09 Listed $134,900 AcadianaMLS
- 2024-06-14 Sold (MLS) — GBRMLS
- 2024-05-30 Listed $1,400 GBRMLS
- 2022-02-01 Sold (MLS) — GBRMLS
- 2022-01-20 Listed $1,295 GBRMLS
- 2020-12-02 Sold (MLS) — GBRMLS
- 2020-11-09 Listed $1,095 GBRMLS
- 2017-12-01 Sold (MLS) — GBRMLS
- 2017-10-22 Listed $64,900 GBRMLS
- 2017-10-17 Listed $64,900 AcadianaMLS
- 2008-02-07 Sold (Public Records) $121,000 Public Records
- 2007-10-08 Listed $125,000 AcadianaMLS
- 1998-01-16 Listed $72,500 AcadianaMLS
Property tax history
+8.5%/yrLatest (2025): $1,597 · +4.5% YoY. Source: county tax records.
Cash-flow waterfall
monthlySold comps — $/sqft
last 12 mo · ≤1 miLoading sold comps…