103 Jamie Ct · Crestview, FL
Flood risk 1/10 · Minimal
- FEMA flood zone
- X (unshaded)
- Chance of flooding over 30 yrs
- 0.0%
- Est. flood insurance / yr
- $507 – $1,088
Fire risk 4/10 · Minor
- Est. fire insurance / yr
- $947 – $1,759
Heat risk 9/10 · Severe
- Hot days now (above 107°F)
- 7 days/yr
- Hot days in 30 yrs
- 20 days/yr
Wind risk 9/10 · Severe
- Chance of severe wind over 30 yrs
- 99.0%
Air-quality risk 2/10 · Minimal
- Unhealthy air days now
- 1 days/yr
- Unhealthy air days in 30 yrs
- 1 days/yr
Risk factors via First Street. Map © Google.
Why this score? — see what drove the D grade
The composite is a weighted blend of 9 inputs, each scored 0–100. Each bar is that input's sub-score; the figure is the points it added to the 100-point composite (weight × sub-score).
- Cash flow +11.9/30.0
- ARV discount +11.2/15.0
- Schools +5.2/10.0
- Livability +3.8/5.0
- DSCR +3.5/10.0
- 1% rule +2.6/10.0
- Rent growth +2.5/5.0
- Condition / age +2.5/5.0
- Appreciation +0.0/10.0
$239,900
🖨 Deal sheet (PDF) 📄 Offer letter ✓ Due diligence
Listing remarks MLS
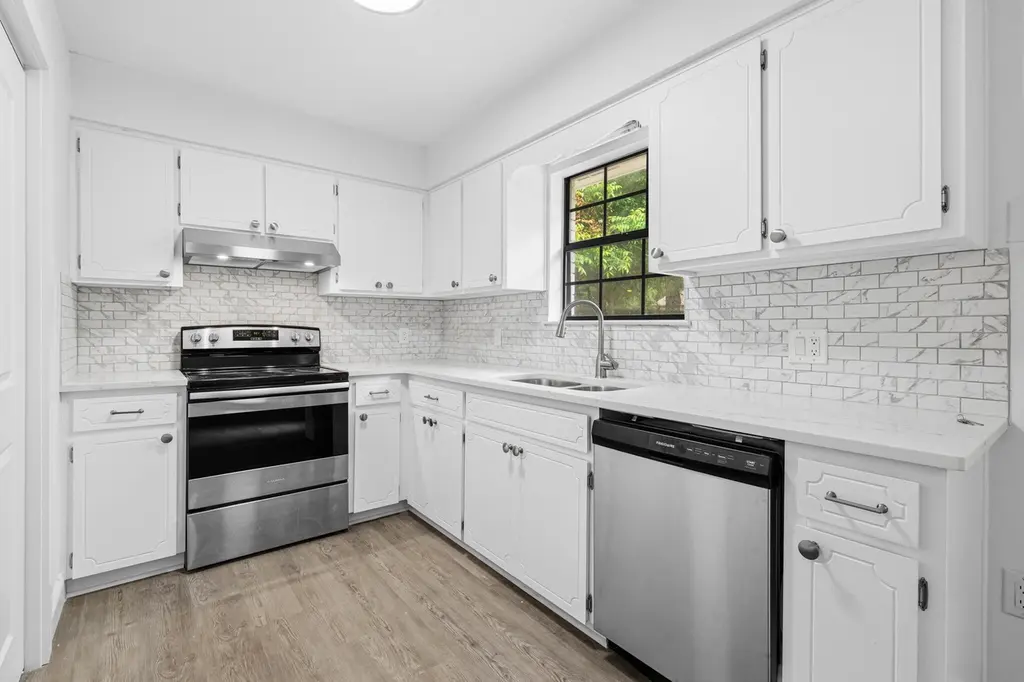
Investor Special / Fixer Opportunity! This 3-bedroom, 2-bath home is a blank canvas ready for your vision. Remodeling has already begun, with the existing flooring removed, giving you a head start on transforming the space to your taste. With a functional layout and solid footprint, this property offers endless potential for investors, flippers, or buyers looking to customize their dream home from the ground up. Bring your contractor and imagination—this is your chance to create something special.
Key facts
- Spacious backyard
- Quiet court
- Updated cabinetry
Tags
Property features AI
Finance
- HOA & community: Subdivision: CORNER OAKS ESTATES
Exterior
- Parking: Driveway with 2 spaces
- Utilities: Electric service; Public water; Public sewer; Electric water heater
- Home design: Traditional single-story home; Entry level: First floor
- Construction: Brick construction; Built in 1985; Slab foundation
- Exterior features: Cleared lot; City street frontage; Paved road access
Interior
- Kitchen: Dishwasher; Microwave; Refrigerator; Electric water heater
- Bedrooms: 3 bedrooms (master on the first floor)
- Bathrooms: 2 full bathrooms
- Heating & cooling: Central heating; Central air
- Interior features: Washer/dryer hookup; Central air conditioning; Central heating
- Laundry & utility: Washer/dryer hookup; Electric water heater
Neighborhood map
What this means for you Summary
Snapshot
- This is a 3-bed/2.0-bath single-family listed at $240k.
Deal economics
- At list price, monthly cash flow is $-64 ($-763/yr) — negative.
- To cash-flow at today's rent, offer at most $229k (4.7% below list).
- To meet the 1% rule (rent ≥ 1% of price), the offer needs to be $182k (24.3% below list).
- Recommended offer: $182k (24.3% below list) — sets the bar for 1% rule.
- Cap rate 6.0% vs local median 4.4% in Crestview — top-decile yield for the area; either an underpriced asset or a hidden risk that comps aren't pricing in. Stress-test before assuming the spread holds.
Location & tenants
- Location reads 75/100 on livability (#252 in FL, #3,858 nationally) — a middle-class / working-renter tenant base. Strengths: cost of living A+, housing A+, health & safety A+; Watch: employment D, amenities F, commute F.
- Okaloosa (other): math 60% / reading 60% proficiency, ranked #12 of 73 in FL (top 16%) — acceptable for families but not a draw, mixed tenant base, ~2y average lease.
- Zoned schools: Walker Elementary School (math 52% / reading 55%, grade C, #949 of 2,144 statewide, top 45%, 864 students, 61% FRL); Crestview High School (math 49% / reading 54%, grade D+, #167 of 667 statewide, top 25%, 2,315 students, 42% FRL) — zoned schools average 52% FRL vs 36% district-wide (16 pts higher); higher-poverty schools than district average — tighter screening recommended.
- Market conditions: Rents flat; 526 active listings in the ZIP; 28 comparable units currently listed for rent nearby; rentals lingering (median 46d on market — plan ~5-8 weeks vacancy on turnover, expect pricing pressure); 57% of comp listings sitting > 30 days — soft ceiling on asking rent; 1,268 units permitted in Okaloosa County in 2024 (175 in 5+ unit buildings).
Forward outlook
- Local home prices are declining (-3.0%/yr); year-one equity from $2k of loan paydown is wiped out by about $7k of value loss. Plan a longer hold.
- Okaloosa County population projected at +37% by 2050 — long-run rental-demand tailwind backs the buy-and-hold thesis.
Negotiation context
- It's been on market 51 days — a 3% lower offer ($233k) is reasonable based on typical stale-listing flexibility.
- 4 sale attempts since 20y ago; this cycle's ask has dropped $44k (16%) from the opening price — seller is motivated, your offer sets the floor, not the list.
- Current owner paid $150k; list at $240k implies a 60% gain — meaningful room to come down on a strong offer.
Risks & watch-outs
- Climate carrying-cost: severe wind risk, 99% chance of damaging wind over 30y; extreme-heat days projected 7→20/yr by 2055 (HVAC capex compounding) — expect insurance premiums to compound above CPI over the hold.
Questions for the listing agent
- What do current leases actually rent for vs. the listed asking? Can we see a recent rent roll and the last 12 months of T-12 income?
- It's been on market 51 days. Have you received any prior offers? Is the seller open to a 24% concession, seller financing, or rate buy-down credit?
- Is there a deadline driving the sale (1031 exchange, divorce, estate, relocation)? That informs how much negotiation room exists.
- Schools are B-rated — typically a magnet for longer-tenancy family renters. What's the average tenant stay here, and is there a school-zone premium baked into asking?
- The area grade is low — what's the realistic commute time and amenity access for the typical tenant pool here? Any planned neighborhood developments (good or bad) we should know about?
- What's the average days-on-market for RENTAL listings here right now (not sales)? A rising rental-DOM trend means longer vacancies and softer asking-rent achievability than the comps imply.
- What's the recent tenant-quality profile in this submarket — average credit score on applications, eviction rate, late-payment / NSF rate, and stable-employment percentage? A property-management company in the area should have these aggregated.
- How much new for-sale + rental construction is in the pipeline within 1–3 miles? Heavy new supply typically softens prices + rents 12–24 months out; constrained supply supports both.
Investment metrics
- 1% rule
- 0.76% ✗
- Cap rate
- 5.97%
- Cash-on-cash
- -1.14%
- DSCR
- 0.95
- GRM
- 11.0
CMA / ARV
- ARV (median comp)
- $261,080
- List price
- $239,900
- Delta
- -8.11%
- Verdict
- FAIR
- Comps
- 20 within 1.0 mi
Show comp detail 12 sales within ~0.75 mi
| Address | Dist | Beds/Ba | Sqft | Sold | Price | $/sf | Match |
|---|---|---|---|---|---|---|---|
| 390 Brackin St | 0.10mi | 3/2.0 | 1,257 (-9%) | 9mo | $245,000 | $195 | 73 |
| 202 Mc Arthur St | 0.24mi | 3/2.0 | 1,291 (-7%) | 6mo | $215,000 | $167 | 72 |
| 548 Hyde Park Dr | 0.34mi | 3/2.0 | 1,276 (-8%) | 2mo | $266,000 | $208 | 69 |
| 438 Brackin St | 0.09mi | 3/2.0 | 1,562 (+13%) | 6mo | $250,000 | $160 | 69 |
| 472 Stillwell Blvd | 0.38mi | 3/2.0 | 1,322 (-4%) | 9mo | $200,000 | $151 | 68 |
| 516 Hyde Park Dr | 0.43mi | 3/2.0 | 1,290 (-7%) | 5mo | $162,000 | $126 | 65 |
| 2893 Pansy Ave | 0.60mi | 2/2.0 (-1) | 1,376 (-0%) | 8mo | $187,500 | $136 | 60 |
| 960 Valley Rd | 0.67mi | 3/2.0 | 1,407 (+2%) | 8mo | $227,000 | $161 | 59 |
| 1126 Farmer St | 0.73mi | 3/2.0 | 1,327 (-4%) | 3mo | $220,000 | $166 | 57 |
| 2920 Patch Ave | 0.56mi | 3/2.0 | 1,514 (+10%) | 5mo | $270,000 | $178 | 54 |
| 786 9th Ave | 0.59mi | 3/2.0 | 1,582 (+14%) | 9mo | $180,000 | $114 | 41 |
| 302 Dixie St | 0.74mi | 3/1.0 | 1,212 (-12%) | 1mo | $183,000 | $151 | 40 |
Match score weights: distance 35% · size 25% · config 20% · recency 20%. Top-matched comps best support the ARV.
Projected returns pro-forma
-3.0% appreciation · 0.12% rent growth · sell at horizon
- IRR
- -21.2%
- Equity multiple
- 0.28×
- Total profit
- $-48,114
- Equity at exit
- $35,770
- IRR
- -22.2%
- Equity multiple
- -0.00×
- Total profit
- $-67,225
- Equity at exit
- $20,742
Cash invested: $67,172 (down + closing). Projections, not guarantees.
Landlord ↔ Tenant lean methodology
- Overall (STATE)
- 87 Strongly Landlord-Friendly
- State Florida
- 87 Strongly Landlord-Friendly · R+3
- County
- — inherits STATE
- City
- — inherits STATE
ZIP-level market 32539
- Home prices YoY
- -17.8%
- Rents YoY
- 0.1%
- Active inventory
- 526
- Price-to-rent
- 11.0×
Monthly cashflow live
- Estimated rent
- $1,817 high interval (Pro) →
- Mortgage (P&I)
- −$1,258
- Tax from tax record
- −$141 /mo · $1,694/yr
- Insurance
- −$100
- HOA
- −$0
- Vacancy / Maint / Mgmt
- −$382
- Net cashflow
- $-64
Break-even live
Sensitivity live
| Price | -10% $72 | -5% $4 | +0% $-64 | +5% $-132 | +10% $-199 |
|---|---|---|---|---|---|
| Rent | -10% $-207 | -5% $-135 | +0% $-64 | +5% $8 | +10% $80 |
| Rate | -1.0pp $57 | -0.5pp $-3 | base $-64 | +0.5pp $-126 | +1.0pp $-189 |
UW: 25.0% down · 7.5% · 30yr · 1.5% tax · 5.0% vac · 8.0% maint · 8.0% mgmt
Financing live
Cash to close
- Down payment
- $59,975
- Closing costs
- $7,197
- Reserves months
- —
- Total cash needed
- —
Loan-product check · same deal, 3 products live
Conventional
25% down · 7.5% · 30yr
- Down + closing
- —
- Monthly P&I
- —
- Monthly cashflow
- —
- DSCR
- —
- Eligible?
- —
Personal DTI + credit; lowest rate.
DSCR
20% down · 8.5% · 30yr
- Down + closing
- —
- Monthly P&I
- —
- Monthly cashflow
- —
- DSCR
- —
- Eligible?
- —
No personal income docs; deal must DSCR.
Hard money
10% down · 12.0% · 12mo
- Down + closing
- —
- Monthly P&I
- —
- Monthly cashflow
- —
- DSCR
- —
- Eligible?
- —
Short-term bridge; refi at stabilization.
Rent comps 28 comps
| Address | Beds | Baths | Sqft | Rent | $/sqft | DOM | Units | Dist |
|---|---|---|---|---|---|---|---|---|
| 507 Eisenhower Dr Crestview, FL | 3.0 | 2.0 | 1809 | $2,200 | $1.22 | 45d | 1 | 0.17mi |
| 311 Dahlquist Dr Crestview, FL | 4.0 | 2.5 | 1770 | $2,050 | $1.16 | 23d | 1 | 0.19mi |
| 304 Strawbridge Dr Crestview, FL | 4.0 | 2.0 | 1650 | $1,850 | $1.12 | 15d | 1 | 0.28mi |
| 502 Hyde Park Dr Crestview, FL | 3.0 | 2.0 | 1302 | $1,795 | $1.38 | 15d | 1 | 0.46mi |
| 812 Carlton St Crestview, FL | 3.0 | 2.5 | 1393 | $1,495 | $1.07 | 23d | 1 | 0.53mi |
| 815 Valley Rd Crestview, FL | 3.0 | 2.5 | 1373 | $1,550 | $1.13 | 45d | 1 | 0.58mi |
| 326 Dixie St Crestview, FL | 3.0 | 1.0 | 1386 | $1,400 | $1.01 | 45d | 1 | 0.73mi |
| 107 Hampton Dr Crestview, FL | 2.0 | 1.5 | 972 | $1,300 | $1.34 | 23d | 1 | 0.78mi |
| 2942 Sholtz Ave Crestview, FL | 3.0 | 2.0 | 1266 | $1,600 | $1.26 | 45d | 1 | 0.78mi |
| 122 Hampton Dr Crestview, FL | 2.0 | 1.5 | 1080 | $1,195 | $1.11 | 45d | 1 | 0.82mi |
| 122 Hampton Dr Unit 1 Crestview, FL | 2.0 | 2.0 | 1080 | $1,195 | $1.11 | 45d | 1 | 0.82mi |
| 124 Hampton Dr Crestview, FL | 2.0 | 1.5 | 952 | $1,195 | $1.26 | 23d | 1 | 0.82mi |
| 124 Hampton Dr Unit 1 Crestview, FL | 2.0 | 1.5 | 952 | $1,195 | $1.26 | 45d | 1 | 0.83mi |
| 498 North Ave E Unit A Crestview, FL | 2.0 | 2.0 | 1081 | $1,450 | $1.34 | 45d | 1 | 0.87mi |
| 149 Shady Ln Crestview, FL | 3.0 | 2.0 | 1680 | $2,000 | $1.19 | 45d | 1 | 0.93mi |
| 408 Arbor Lake Dr Crestview, FL | 3.0 | 2.5 | 1755 | $1,900 | $1.08 | 15d | 1 | 0.99mi |
| 205 Powell Dr Crestview, FL | 3.0 | 1.5 | 1008 | $1,400 | $1.39 | 45d | 1 | 1.04mi |
| 720 Arbor Lake Dr Crestview, FL | 2.0 | 2.5 | 1100 | $1,400 | $1.27 | 45d | 1 | 1.04mi |
| 720 Arbor Lake Dr Crestview, FL | 2.0 | 2.5 | 1100 | $1,375 | $1.25 | 23d | 1 | 1.04mi |
| 830 Arbor Lake Dr Crestview, FL | 2.0 | 2.5 | 1200 | $1,400 | $1.17 | 15d | 1 | 1.05mi |
| 398 N Spring St Crestview, FL | 2.0 | 1.0 | 1200 | $1,300 | $1.08 | 45d | 1 | 1.16mi |
| 197 W 1st Ave Crestview, FL | 3.0 | 2.0 | 1547 | $2,395 | $1.55 | 23d | 1 | 1.25mi |
| 131 Adkinson Dr Crestview, FL | 4.0 | 1.0 | 1332 | $1,750 | $1.31 | 15d | 1 | 1.29mi |
| 812 E Edney Ave Crestview, FL | 2.0 | 2.0 | 1024 | $1,400 | $1.37 | 23d | 1 | 1.34mi |
| 812 E Edney Ave Crestview, FL | 2.0 | 2.0 | 1024 | $1,400 | $1.37 | 46d | 1 | 1.34mi |
| 401 S Booker St Crestview, FL | 3.0 | 1.5 | 1040 | $1,225 | $1.18 | 45d | 1 | 1.36mi |
| 503 W Griffith Ave Crestview, FL | 3.0 | 1.0 | 962 | $1,395 | $1.45 | 45d | 1 | 1.39mi |
| 408 Church St Crestview, FL | 2.0 | 2.0 | 1086 | $1,200 | $1.10 | 45d | 1 | 1.50mi |
Listing history 32 events
-
2026-06-21pricedays on market $239,900 Active 51 DOM
-
2026-06-18days on market $245,000 Active 48 DOM
-
2026-06-17days on market $245,000 Active 47 DOM
-
2026-06-16days on market $245,000 Active 46 DOM
-
2026-06-15days on market $245,000 Active 45 DOM
-
2026-06-14days on market $245,000 Active 43 DOM
-
2026-06-13days on market $245,000 Active 42 DOM
-
2026-06-10days on market $245,000 Active 40 DOM
-
2026-06-09days on market $245,000 Active 39 DOM
-
2026-06-09price $245,000 Active 38 DOM
-
2026-06-08days on market $249,000 Active 38 DOM
-
2026-06-07days on market $249,000 Active 37 DOM
-
2026-06-05days on market $249,000 Active 34 DOM
-
2026-06-02days on market $249,000 Active 32 DOM
-
2026-06-01days on market $249,000 Active 31 DOM
-
2026-05-31days on market $249,000 Active 30 DOM
-
2026-05-30pricedays on market $249,000 Active 29 DOM
-
2026-05-16price $255,000 768-char remark
-
2026-05-14price $259,000 768-char remark
-
2026-05-12price $264,000 768-char remark
-
2026-05-10price $269,000 768-char remark
-
2026-05-07price $279,000 768-char remark
-
2026-05-01$284,000 Active 768-char remark
-
2026-02-19soldstatus $150,000
-
2026-02-17soldstatus $150,000 Sold 508-char remark
Show marketing remark (508 chars)
Investor Special / Fixer Opportunity! This 3-bedroom, 2-bath home is a blank canvas ready for your vision. Remodeling has already begun, with the existing flooring removed, giving you a head start on transforming the space to your taste. With a functional layout and solid footprint, this property offers endless potential for investors, flippers, or buyers looking to customize their dream home from the ground up. Bring your contractor and imagination—this is your chance to create something special.
-
2026-02-11status Pending 508-char remark
Show marketing remark (508 chars)
Investor Special / Fixer Opportunity! This 3-bedroom, 2-bath home is a blank canvas ready for your vision. Remodeling has already begun, with the existing flooring removed, giving you a head start on transforming the space to your taste. With a functional layout and solid footprint, this property offers endless potential for investors, flippers, or buyers looking to customize their dream home from the ground up. Bring your contractor and imagination—this is your chance to create something special.
-
2026-02-01$189,900 Active 508-char remark
Show marketing remark (508 chars)
Investor Special / Fixer Opportunity! This 3-bedroom, 2-bath home is a blank canvas ready for your vision. Remodeling has already begun, with the existing flooring removed, giving you a head start on transforming the space to your taste. With a functional layout and solid footprint, this property offers endless potential for investors, flippers, or buyers looking to customize their dream home from the ground up. Bring your contractor and imagination—this is your chance to create something special.
-
2006-11-30historical
-
2006-05-15$159,000
-
2006-05-15$159,000
-
1993-03-15soldstatus $55,500
-
1986-02-01soldstatus $44,500
ⓘ Source: listings_history table (triggers on properties + properties_extension) + one-shot
backfill from property_details.listing_events for pre-trigger history.
Tax reassessment forecast FL · Resets to sale price
- Current annual tax
- $1,694 · $141/mo
- Projected year-2 tax
- $1,991 · $166/mo
- Expected delta
- +$298/yr (+$25/mo · 17.6%)
ⓘ Screening estimate from a state-policy table — verify with the county assessor before closing.
Climate risk First Street
- Flood 1/10 Low FEMA zone X (unshaded) · 0% chance over 30 yrs
- Wildfire 4/10 Moderate
- Heat 9/10 Extreme 7 d/yr ≥107°F today · 20 d/yr by 30 yrs out
- Wind 9/10 Extreme 99% chance of damaging wind over 30 yrs
- Air quality 2/10 Low 1 unhealthy d/yr today · 1 by 30 yrs out
Nearby sold comps map
Loading sold comps map…
Walkable amenities ~0.75 mi
Loading nearby amenities…
Taxation est. · year 1
- Rental income
- $21,806
- − Mortgage interest
- −$13,438
- − Property taxes
- −$1,694
- − Insurance
- −$1,200
- − Repairs & maintenance
- −$1,744
- − Management
- −$1,744
- − Depreciation
- −$6,979
- Taxable loss
- −$4,993
- Est. tax savings @ 24.0%
- +$1,198
- After-tax cash flow
- $435/yr
For passive investors: Depreciation is non-cash, so a rental often shows a tax loss while cash-flowing — sheltering income. Rental losses are passive: they offset passive income freely, and up to $25,000/yr can offset ordinary (W-2) income if you actively participate and your MAGI is under $100k (phasing out to $0 by $150k); unused losses carry forward. On sale, claimed depreciation is recaptured at up to 25%, and gains may owe capital-gains tax (a 1031 exchange can defer both). Figures are a year-1 estimate at your 24.0% rate — not tax advice; consult a CPA.
Schools (NCES district)
- District
- Okaloosa
- NCES district ID
- 1201380
- Math proficiency
- 60% ▼ -12.00%
- Reading proficiency
- 60% ▼ -4.00%
- Median HH income
- $55,601
- Composite
- 51.62/100
- National rank
- #1705
- State rank
- #12 of 73 in FL
Livability — Crestview
- Score
- 75/100
- State rank
- #252
- US rank
- #3858
Category grades
Schools grade is shown separately in the Schools card above.
Census & demographics
- Census place
- Crestview, FL
- County
- Okaloosa County · 194,352 people
- City population
- 58,889
- Metro
- Crestview-Fort Walton Beach-Destin, FL
- Population (ZIP)
- 33,290
- Household income
- $74,369
- Rent vs Own
- Severe rent burden
- 371.0
Population outlook (Okaloosa County) Hauer SSP2
- Today (2025)
- 235,133 people
- By 2030
- 253,483 · +7.8%
- By 2040
- 289,537 · +23.1%
- By 2050
- 322,954 · +37.3%
- By 2075
- 399,624 · +70.0%
- By 2100
- 425,311 · +80.9%
Race, ethnicity, and origin ACS 2023
- Neighborhood character
- Predominantly White (73%)
- Race & ethnicity
- White 73% Black 12% Two or more races 8% Hispanic / Latino 7% Asian 1%
- Hispanic origin (detail)
- Mexican 3% Puerto Rican 2%
- Common ancestry
- Lithuanian 4% Iranian 2% Romanian 2%
- Foreign-born
- 3% · Canada
- Languages at home
- 94% English-only · Spanish 3% Russian/Polish/Slavic 1% Other Asian/Pacific 1%
Political lean MEDSL · Okaloosa
- 2024 margin
- Solid R (+42.4) · D 28.2% · R 70.7% · Other 1.1%
- 2008→2024 swing
- +2.5pp toward D · 2008: -44.9pp · 2024: -42.4pp
- All cycles
- 2024: R+42.4 2020: R+39.1 2016: R+47.8 2012: R+49.4 2008: R+44.9
Not yet ingested
- Civics
- —
Market trends
- HPI YoY
- ▼ -56.52%
- Current HPI
- 261.1557
- Rent YoY
- ▲ 0.12%
- Metro
- Crestview-Fort Walton Beach-Destin, FL
- State GDP YoY
- ▲ 3.28%
- F500 in state
- 36
Industry mix (Fortune 500 HQ in FL)
| Industry | F500 HQs | Revenue |
|---|---|---|
| Industrial Technology | 2 | $29B |
|
||
| Insurance | 2 | $17B |
|
||
| Retail | 1 | $60B |
|
||
| Technology Distribution | 1 | $58B |
|
||
| Homebuilding | 1 | $35B |
|
||
| Technology Manufacturing | 1 | $35B |
|
||
Price history
+450.6% since first listed18 events — show timeline
- 2026-06-08 Price Changed $245,000 ECAR
- 2026-05-29 Price Changed $249,000 ECAR
- 2026-05-25 Price Changed $254,000 ECAR
- 2026-05-16 Price Changed $255,000 ECAR
- 2026-05-14 Price Changed $259,000 ECAR
- 2026-05-12 Price Changed $264,000 ECAR
- 2026-05-10 Price Changed $269,000 ECAR
- 2026-05-07 Price Changed $279,000 ECAR
- 2026-05-01 Listed $284,000 ECAR
- 2026-02-19 Sold (Public Records) $150,000 Public Records
- 2026-02-17 Sold (MLS) $150,000 ECAR
- 2026-02-11 Pending — ECAR
- 2026-02-01 Listed $189,900 ECAR
- 2006-11-30 Listing Removed — NAMLS
- 2006-05-15 Listed $159,000 NAMLS
- 2006-05-15 Listed $159,000 ECAR
- 1993-03-15 Sold (Public Records) $55,500 Public Records
- 1986-02-01 Sold (Public Records) $44,500 Public Records
Property tax history
+2.7%/yrLatest (2025): $1,694 · +3.0% YoY. Source: county tax records.
Cash-flow waterfall
monthlySold comps — $/sqft
last 12 mo · ≤1 miLoading sold comps…