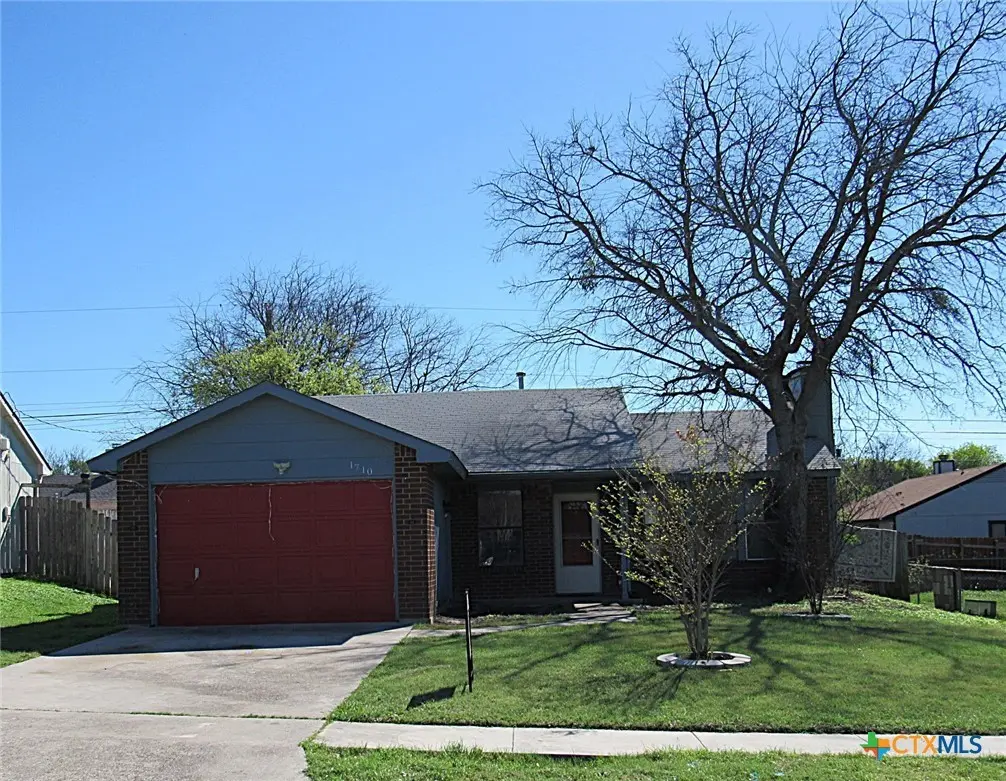
1710 Lea Ann Dr · Killeen, TX
Flood risk 1/10 · Minimal
- FEMA flood zone
- X (unshaded)
- Chance of flooding over 30 yrs
- 0.0%
- Est. flood insurance / yr
- $507 – $1,088
Fire risk 2/10 · Minimal
- Est. fire insurance / yr
- $1,222 – $2,270
Heat risk 8/10 · Major
- Hot days now (above 107°F)
- 7 days/yr
- Hot days in 30 yrs
- 24 days/yr
Wind risk 6/10 · Moderate
- Chance of severe wind over 30 yrs
- 60.0%
Air-quality risk 1/10 · Minimal
- Unhealthy air days now
- 0 days/yr
- Unhealthy air days in 30 yrs
- 0 days/yr
Risk factors via First Street. Map © Google.
Why this score? — see what drove the C- grade
The composite is a weighted blend of 9 inputs, each scored 0–100. Each bar is that input's sub-score; the figure is the points it added to the 100-point composite (weight × sub-score).
- Cash flow +16.1/30.0
- ARV discount +15.0/15.0
- 1% rule +5.1/10.0
- DSCR +5.0/10.0
- Livability +3.2/5.0
- Schools +3.0/10.0
- Rent growth +2.8/5.0
- Condition / age +2.5/5.0
- Appreciation +0.0/10.0
$129,900
🖨 Deal sheet 📄 Offer letter ✓ Due diligence
Listing remarks MLS
Welcome to comfort and style. Inside, enjoy bright, open living spaces with elegant finishes and seamless flow for everyday living and entertaining. The remodeled bath adds modern charm, while the primary suite features peace and tranquility . Step outside to a spacious concrete back patio, perfect for relaxing or hosting gatherings, surrounded by privacy fence. This move-in-ready property blends modern upgrades with everyday functionality in a welcoming setting. Less than 10 minutes to Ft. Hood, shopping and dining. Schedule your private tour!
Key facts
- Concrete back patio
- Privacy fence
- Remodeled bath
Tags
Neighborhood map
What this means for you Summary
Snapshot
- This is a 3-bed/2.0-bath single-family listed at $130k.
Deal economics
- At list price, monthly cash flow is $66 ($789/yr) — positive.
- The deal already cash-flows at list — no discount required.
- Meets the 1% rule at list price ($1k rent vs $130k).
- Recommended offer: $122k (6.0% below list) — sets the bar for market timing.
- Cap rate 6.9% vs local median 3.9% in Killeen — top-decile yield for the area; either an underpriced asset or a hidden risk that comps aren't pricing in. Stress-test before assuming the spread holds.
Location & tenants
- Location reads 63/100 on livability (#853 in TX) — a middle-class / working-renter tenant base. Strengths: cost of living A+, housing A+; Watch: schools D+, amenities D, employment D.
- Killeen ISD (urban): math 31% / reading 38% proficiency, ranked #524 of 826 in TX (top 63%) — families likely to look elsewhere, expect single-tenant / working-renter base with shorter leases.
- Market conditions: Rents rising (+1.1%/yr); 429 active listings in the ZIP; 40 comparable units currently listed for rent nearby; rentals at typical pace (median 23d on market — plan ~3-4 weeks tenant-placement turnaround); 3,222 units permitted in Bell County in 2024 (246 in 5+ unit buildings).
Forward outlook
- Local home prices are declining (-3.0%/yr); year-one equity from $898 of loan paydown is wiped out by about $4k of value loss. Plan a longer hold.
- Bell County population projected at +21% by 2050 — long-run rental-demand tailwind backs the buy-and-hold thesis.
Negotiation context
- It's been on market 88 days — a 6% lower offer ($122k) is reasonable based on typical stale-listing flexibility.
- 2 sale attempts since 7y ago; this cycle's ask has dropped $10k (7%) from the opening price — seller is motivated, your offer sets the floor, not the list.
Risks & watch-outs
- Climate carrying-cost: major wind risk, 60% chance of damaging wind over 30y; extreme-heat days projected 7→24/yr by 2055 (HVAC capex compounding) — expect insurance premiums to compound above CPI over the hold.
Questions for the listing agent
- It's been on market 88 days. Have you received any prior offers? Is the seller open to a 6% concession, seller financing, or rate buy-down credit?
- Why hasn't it sold? Are there any deal-killer items the seller is aware of (foundation, flood, title, zoning, code violations)?
- Is there a deadline driving the sale (1031 exchange, divorce, estate, relocation)? That informs how much negotiation room exists.
- Schools are D-rated, which usually means shorter tenancies and higher turnover. Who's the typical renter profile here, and what's been the actual vacancy rate?
- Crime grade is D in this area — have there been break-ins, vandalism, or insurance claims at this property in the last 3 years? What carrier currently insures it and at what premium?
- What's the average days-on-market for RENTAL listings here right now (not sales)? A rising rental-DOM trend means longer vacancies and softer asking-rent achievability than the comps imply.
- What's the recent tenant-quality profile in this submarket — average credit score on applications, eviction rate, late-payment / NSF rate, and stable-employment percentage? A property-management company in the area should have these aggregated.
- How much new for-sale + rental construction is in the pipeline within 1–3 miles? Heavy new supply typically softens prices + rents 12–24 months out; constrained supply supports both.
Investment metrics
- 1% rule
- 1.01% ✓
- Cap rate
- 6.90%
- Cash-on-cash
- 2.17%
- DSCR
- 1.10
- GRM
- 8.3
CMA / ARV
- ARV (median comp)
- $162,180
- List price
- $129,900
- Delta
- -19.90%
- Verdict
- UNDERPRICED
- Comps
- 20 within 1.0 mi
Show comp detail 10 sales within ~0.75 mi
| Address | Dist | Beds/Ba | Sqft | Sold | Price | $/sf | Match |
|---|---|---|---|---|---|---|---|
| 1706 Bobby Lee Dr | 0.05mi | 3/2.0 | 1,074 (+4%) | 6mo | $149,000 | $139 | 86 |
| 1223 Meadow Dr | 0.18mi | 3/2.0 | 1,056 (+2%) | 4mo | $169,800 | $161 | 84 |
| 2505 Cactus Dr | 0.42mi | 3/2.0 | 1,101 (+7%) | 7mo | $140,000 | $127 | 64 |
| 2811 Armadillo Dr | 0.64mi | 3/2.0 | 1,070 (+4%) | 3mo | $179,000 | $167 | 62 |
| 1507 Ferndale Dr | 0.39mi | 3/1.0 | 968 (-6%) | 7mo | $159,900 | $165 | 61 |
| 1405 Camilla Rd | 0.50mi | 3/2.0 | 1,125 (+9%) | 4mo | $150,000 | $133 | 58 |
| 2900 Southhill Dr | 0.55mi | 3/2.0 | 1,120 (+8%) | 3mo | $175,000 | $156 | 58 |
| 1305 West Ln | 0.55mi | 3/2.0 | 1,138 (+10%) | 3mo | $153,000 | $134 | 55 |
| 1215 Alta Vista Dr | 0.33mi | 3/2.0 | 1,180 (+14%) | 15mo | $175,000 | $148 | 48 |
| 2806 Hemlock Dr | 0.58mi | 3/2.0 | 1,165 (+13%) | 7mo | $180,000 | $155 | 46 |
Match score weights: distance 35% · size 25% · config 20% · recency 20%. Top-matched comps best support the ARV.
Projected returns pro-forma
-3.0% appreciation · 1.14% rent growth · sell at horizon
- IRR
- -15.1%
- Equity multiple
- 0.47×
- Total profit
- $-19,200
- Equity at exit
- $19,369
- IRR
- -10.2%
- Equity multiple
- 0.43×
- Total profit
- $-20,567
- Equity at exit
- $11,231
Cash invested: $36,372 (down + closing). Projections, not guarantees.
Landlord ↔ Tenant lean methodology
- Overall (STATE)
- 87 Strongly Landlord-Friendly
- State Texas
- 87 Strongly Landlord-Friendly · R+5
- County
- — inherits STATE
- City
- — inherits STATE
ZIP-level market 76549
- Home prices YoY
- -12.6%
- Rents YoY
- 1.1%
- Active inventory
- 429
- Price-to-rent
- 8.3×
Monthly cashflow live
- Estimated rent
- $1,307 high interval (Pro) →
- Mortgage (P&I)
- −$681
- Tax from tax record
- −$232 /mo · $2,778/yr
- Insurance
- −$54
- HOA
- −$0
- Vacancy / Maint / Mgmt
- −$274
- Net cashflow
- $66
Break-even live
UW: 25.0% down · 7.5% · 30yr · 1.5% tax · 5.0% vac · 8.0% maint · 8.0% mgmt
Financing live
Cash to close
- Down payment
- $32,475
- Closing costs
- $3,897
- Reserves months
- —
- Total cash needed
- —
Loan-product check · same deal, 3 products live
Conventional
25% down · 7.5% · 30yr
- Down + closing
- —
- Monthly P&I
- —
- Monthly cashflow
- —
- DSCR
- —
- Eligible?
- —
Personal DTI + credit; lowest rate.
DSCR
20% down · 8.5% · 30yr
- Down + closing
- —
- Monthly P&I
- —
- Monthly cashflow
- —
- DSCR
- —
- Eligible?
- —
No personal income docs; deal must DSCR.
Hard money
10% down · 12.0% · 12mo
- Down + closing
- —
- Monthly P&I
- —
- Monthly cashflow
- —
- DSCR
- —
- Eligible?
- —
Short-term bridge; refi at stabilization.
Rent comps 40 comps
| Address | Beds | Baths | Sqft | Rent | $/sqft | DOM | Units | Dist |
|---|---|---|---|---|---|---|---|---|
| 1714 West Ln Killeen, TX | 2.0 | 1.0 | 899 | $1,200 | $1.33 | 43d | 1 | 0.08mi |
| 1806 Bobby Lee Dr Killeen, TX | 3.0 | 2.0 | 1220 | $1,295 | $1.06 | 23d | 1 | 0.08mi |
| 1613 Bobby Lee Dr Killeen, TX | 3.0 | 2.5 | 1274 | $1,495 | $1.17 | 23d | 1 | 0.08mi |
| 2410 Grasslands Dr Killeen, TX | 3.0 | 2.0 | 1352 | $1,395 | $1.03 | 23d | 1 | 0.12mi |
| 2104 Corona Dr Killeen, TX | 3.0 | 2.0 | 1480 | $1,450 | $0.98 | 21d | 1 | 0.18mi |
| 2104 Corona Dr Killeen, TX | 3.0 | 2.0 | 1480 | $1,450 | $0.98 | 23d | 1 | 0.18mi |
| 1513 Janis Dr Unit A Killeen, TX | 2.0 | 1.0 | 756 | $750 | $0.99 | 43d | 1 | 0.21mi |
| 1213 Meadow Dr Killeen, TX | 3.0 | 2.0 | 1213 | $1,345 | $1.11 | 43d | 1 | 0.21mi |
| 1228 Chippendale Dr Killeen, TX | 3.0 | 2.0 | 1271 | $1,395 | $1.10 | 13d | 1 | 0.22mi |
| 2002 Hinkle Ave Killeen, TX | 3.0 | 2.0 | 1370 | $1,225 | $0.89 | 23d | 1 | 0.22mi |
| 2609 Bermuda Dr Unit C Killeen, TX | 2.0 | 1.5 | 1025 | $950 | $0.93 | 23d | 1 | 0.26mi |
| 1301 Willow Springs Rd Unit A Killeen, TX | 2.0 | 1.0 | 761 | $625 | $0.82 | 43d | 1 | 0.27mi |
| 1304 Quail Cir Unit D Killeen, TX | 2.0 | 1.0 | 964 | $650 | $0.67 | 13d | 1 | 0.28mi |
| 1302 Quail Cir Unit B Killeen, TX | 2.0 | 1.0 | 900 | $800 | $0.89 | 23d | 1 | 0.28mi |
| 2701 Bermuda Dr Unit A Killeen, TX | 2.0 | 1.5 | 924 | $949 | $1.03 | 43d | 1 | 0.29mi |
| 1315 Quail Cir Unit C Killeen, TX | 2.0 | 1.0 | 850 | $700 | $0.82 | 13d | 1 | 0.29mi |
| 1305 Quail Cir Apt B Killeen, TX | 2.0 | 1.0 | 900 | $695 | $0.77 | 13d | 1 | 0.31mi |
| 2404 Fieldstone Dr Killeen, TX | 3.0 | 2.0 | 1200 | $1,365 | $1.14 | 23d | 1 | 0.34mi |
| 2200 Wheeler Ave Killeen, TX | 2.0 | 1.0 | 842 | $850 | $1.01 | 43d | 1 | 0.36mi |
| 2204 Wheeler Ave Killeen, TX | 2.0 | 1.0 | 840 | $950 | $1.13 | 13d | 1 | 0.36mi |
| 1501 Ferndale Dr Killeen, TX | 3.0 | 2.0 | 1328 | $1,550 | $1.17 | 23d | 1 | 0.37mi |
| 2404 Bluebonnet Dr Killeen, TX | 3.0 | 2.0 | 1095 | $1,350 | $1.23 | 43d | 1 | 0.38mi |
| 2806 Grasslands Dr Killeen, TX | 3.0 | 2.0 | 1451 | $1,395 | $0.96 | 13d | 1 | 0.38mi |
| 2211 Wheeler Ave Apt B Killeen, TX | 2.0 | 2.0 | 1168 | $1,050 | $0.90 | 13d | 1 | 0.38mi |
| 1100 Willow Springs Rd Killeen, TX | 1.0–3.0 | 1.0–2.0 | 848 | $1,400 | $1.65 | 13d | 36 | 0.38mi |
| 1704 Big Bend Dr Killeen, TX | 3.0 | 2.0 | 1472 | $1,600 | $1.09 | 23d | 1 | 0.39mi |
| 1208 Ridgemont Dr Killeen, TX | 3.0 | 1.0 | 1224 | $1,150 | $0.94 | 23d | 1 | 0.41mi |
| 2206 Silverway Dr Unit A Killeen, TX | 2.0 | 2.0 | 855 | $825 | $0.96 | 43d | 1 | 0.41mi |
| 2404 Windmill Dr Killeen, TX | 2.0 | 1.0 | 915 | $1,195 | $1.31 | 13d | 1 | 0.43mi |
| 1108 Ridgeway Dr Killeen, TX | 3.0 | 2.0 | 1295 | $1,345 | $1.04 | 23d | 1 | 0.43mi |
| 2604 Woodlands Dr Killeen, TX | 3.0 | 2.0 | 1089 | $1,300 | $1.19 | 13d | 1 | 0.45mi |
| 2604 Woodlands Dr Killeen, TX | 3.0 | 2.0 | 1089 | $1,295 | $1.19 | 23d | 1 | 0.45mi |
| 1214 Valentine St Killeen, TX | 3.0 | 1.0 | 1090 | $1,025 | $0.94 | 23d | 1 | 0.47mi |
| 2505 Armadillo Dr Killeen, TX | 3.0 | 2.0 | 1118 | $1,400 | $1.25 | 43d | 1 | 0.49mi |
| 1129 Wales Dr Unit D Killeen, TX | 2.0 | 2.0 | 840 | $850 | $1.01 | 43d | 1 | 0.49mi |
| 2701 Woodlands Dr Killeen, TX | 3.0 | 2.0 | 1293 | $1,495 | $1.16 | 23d | 1 | 0.49mi |
| 1510 Westway Dr Killeen, TX | 3.0 | 2.0 | 1073 | $1,225 | $1.14 | 13d | 1 | 0.50mi |
| 1505 Daude Ave Killeen, TX | 3.0 | 2.0 | 1223 | $1,350 | $1.10 | 23d | 1 | 0.51mi |
| 1804 Clarawood Dr Killeen, TX | 3.0 | 2.0 | 1238 | $1,300 | $1.05 | 13d | 1 | 0.53mi |
| 1105 Alta Vista Dr Killeen, TX | 3.0 | 1.5 | 1168 | $1,500 | $1.28 | 23d | 1 | 0.53mi |
Listing history 16 events
-
2026-06-09status $129,900 Pending 88 DOM
-
2026-06-08days on market $129,900 Active 88 DOM
-
2026-06-07days on market $129,900 Active 87 DOM
-
2026-06-03days on market $129,900 Active 83 DOM
-
2026-06-02days on market $129,900 Active 82 DOM
-
2026-06-01days on market $129,900 Active 81 DOM
-
2026-05-31days on market $129,900 Active 80 DOM
-
2026-05-30days on market $129,900 Active 79 DOM
-
2026-04-22price $134,900 550-char remark
Show marketing remark (550 chars)
Welcome to comfort and style. Inside, enjoy bright, open living spaces with elegant finishes and seamless flow for everyday living and entertaining. The remodeled bath adds modern charm, while the primary suite features peace and tranquility . Step outside to a spacious concrete back patio, perfect for relaxing or hosting gatherings, surrounded by privacy fence. This move-in-ready property blends modern upgrades with everyday functionality in a welcoming setting. Less than 10 minutes to Ft. Hood, shopping and dining. Schedule your private tour!
-
2026-03-12$139,900 Active 550-char remark
Show marketing remark (550 chars)
Welcome to comfort and style. Inside, enjoy bright, open living spaces with elegant finishes and seamless flow for everyday living and entertaining. The remodeled bath adds modern charm, while the primary suite features peace and tranquility . Step outside to a spacious concrete back patio, perfect for relaxing or hosting gatherings, surrounded by privacy fence. This move-in-ready property blends modern upgrades with everyday functionality in a welcoming setting. Less than 10 minutes to Ft. Hood, shopping and dining. Schedule your private tour!
-
2020-01-06soldstatus
-
2019-11-09status Pending
-
2019-10-21$90,000 Active
-
2019-09-27soldstatus
-
1995-12-06soldstatus
-
1992-07-30soldstatus
ⓘ Source: listings_history table (triggers on properties + properties_extension) + one-shot
backfill from property_details.listing_events for pre-trigger history.
Tax reassessment forecast TX · Resets to sale price
- Current annual tax
- $2,778 · $232/mo
- Projected year-2 tax
- $2,778 · $232/mo
- Expected delta
- $0/yr ($0/mo · 0.0%)
ⓘ Screening estimate from a state-policy table — verify with the county assessor before closing.
Climate risk First Street
- Flood 1/10 Low FEMA zone X (unshaded) · 0% chance over 30 yrs
- Wildfire 2/10 Low
- Heat 8/10 Severe 7 d/yr ≥107°F today · 24 d/yr by 30 yrs out
- Wind 6/10 Major 60% chance of damaging wind over 30 yrs
- Air quality 1/10 Low 0 unhealthy d/yr today · 0 by 30 yrs out
Nearby sold comps map
Loading sold comps map…
Walkable amenities ~0.75 mi
Loading nearby amenities…
Taxation est. · year 1
- Rental income
- $15,685
- − Mortgage interest
- −$7,276
- − Property taxes
- −$2,778
- − Insurance
- −$650
- − Repairs & maintenance
- −$1,255
- − Management
- −$1,255
- − Depreciation
- −$3,779
- Taxable loss
- −$1,307
- Est. tax savings @ 24.0%
- +$314
- After-tax cash flow
- $1,103/yr
For passive investors: Depreciation is non-cash, so a rental often shows a tax loss while cash-flowing — sheltering income. Rental losses are passive: they offset passive income freely, and up to $25,000/yr can offset ordinary (W-2) income if you actively participate and your MAGI is under $100k (phasing out to $0 by $150k); unused losses carry forward. On sale, claimed depreciation is recaptured at up to 25%, and gains may owe capital-gains tax (a 1031 exchange can defer both). Figures are a year-1 estimate at your 24.0% rate — not tax advice; consult a CPA.
Schools (NCES district)
- District
- Killeen ISD
- NCES district ID
- 4825660
- Math proficiency
- 31% ▼ -16.00%
- Reading proficiency
- 38% ▼ -3.00%
- Median HH income
- $47,665
- Composite
- 29.69/100
- National rank
- #6458
- State rank
- #524 of 826 in TX
Livability — Killeen
- Score
- 63/100
- State rank
- #853
- US rank
- #15359
Category grades
Schools grade is shown separately in the Schools card above.
Census & demographics
- Census place
- Killeen, TX
- County
- Bell County · 345,090 people
- City population
- 163,398
- Metro
- Killeen-Temple, TX
- Population (ZIP)
- 56,038
- Household income
- $70,871
- Rent vs Own
- Severe rent burden
- 1874.0
Population outlook (Bell County) Hauer SSP2
- Today (2025)
- 371,114 people
- By 2030
- 389,104 · +4.8%
- By 2040
- 420,592 · +13.3%
- By 2050
- 447,779 · +20.7%
- By 2075
- 499,130 · +34.5%
- By 2100
- 505,680 · +36.3%
Race, ethnicity, and origin ACS 2023
- Neighborhood character
- Highly diverse neighborhood (Simpson 0.74)
- Race & ethnicity
- Black 35% White 27% Hispanic / Latino 26% Two or more races 16% Asian 4% Pacific Islander 1%
- Hispanic origin (detail)
- Mexican 13% Puerto Rican 9%
- Common ancestry
- Italian 3% Romanian 1% Slovak 1%
- Foreign-born
- 8% · Canada, Vietnam, South Korea
- Languages at home
- 77% English-only · Spanish 17% Tagalog/Filipino 1% German/W. Germanic 1%
Political lean MEDSL · Bell
- 2024 margin
- R (+16.2) · D 41.3% · R 57.6% · Other 1.1%
- 2008→2024 swing
- -6.5pp toward R · 2008: -9.8pp · 2024: -16.2pp
- All cycles
- 2024: R+16.2 2020: R+8.5 2016: R+15.1 2012: R+16.4 2008: R+9.8
Not yet ingested
- Civics
- —
Market trends
- HPI YoY
- ▼ -24.68%
- Current HPI
- 171.2708
- Rent YoY
- ▲ 1.14%
- Metro
- Killeen-Temple, TX
- State GDP YoY
- ▲ 3.95%
- F500 in state
- 110
Industry mix (Fortune 500 HQ in TX)
| Industry | F500 HQs | Revenue |
|---|---|---|
| Energy | 16 | $1,198B |
|
||
| Technology | 5 | $198B |
|
||
| Engineering / Construction | 4 | $72B |
|
||
| Energy Services | 3 | $60B |
|
||
| Utilities | 3 | $41B |
|
||
| Healthcare | 2 | $330B |
|
||
Price history
+49.9% since first listed8 events — show timeline
- 2026-04-22 Price Changed $134,900 CTXMLS
- 2026-03-12 Listed $139,900 CTXMLS
- 2020-01-06 Sold (Public Records) — Public Records
- 2019-11-09 Pending — CTXMLS
- 2019-10-21 Listed $90,000 CTXMLS
- 2019-09-27 Sold (Public Records) — Public Records
- 1995-12-06 Sold (Public Records) — Public Records
- 1992-07-30 Sold (Public Records) — Public Records
Property tax history
+5.4%/yrLatest (2025): $2,778 · +12.0% YoY. Source: county tax records.
Cash-flow waterfall
monthlySold comps — $/sqft
last 12 mo · ≤1 miLoading sold comps…