 🔨 Auction
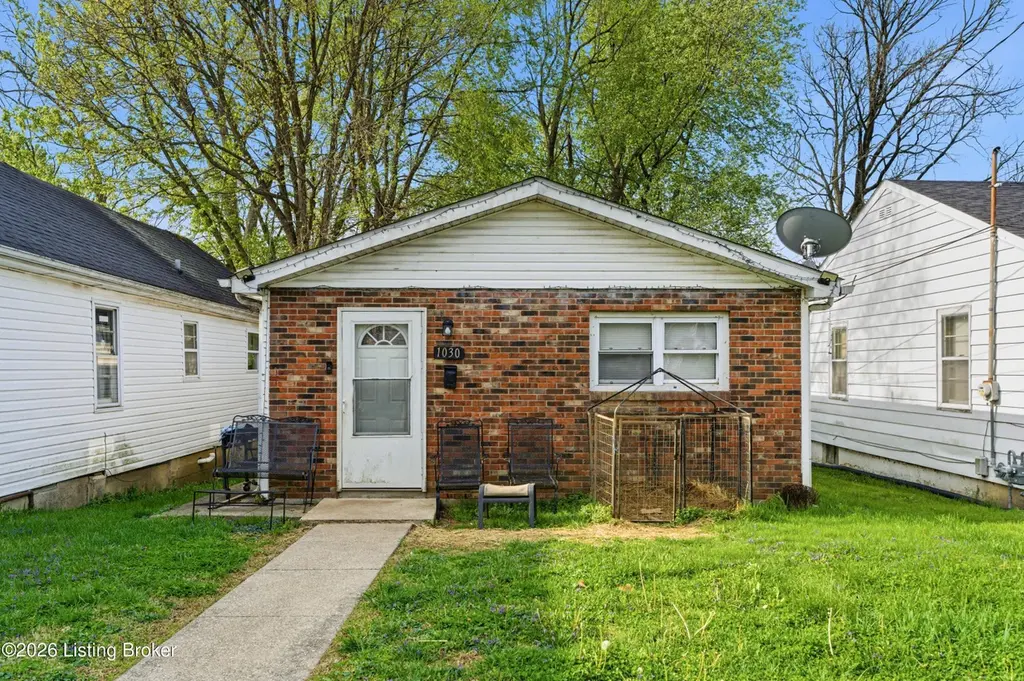
1030 High St · Shelbyville, KY
Flood risk 1/10 · Minimal
- FEMA flood zone
- X (unshaded)
- Chance of flooding over 30 yrs
- 0.0%
- Est. flood insurance / yr
- $473 – $860
Fire risk 1/10 · Minimal
- Est. fire insurance / yr
- $839 – $1,559
Heat risk 5/10 · Moderate
- Hot days now (above 104°F)
- 7 days/yr
- Hot days in 30 yrs
- 19 days/yr
Wind risk 2/10 · Minimal
- Chance of severe wind over 30 yrs
- 2.0%
Air-quality risk 2/10 · Minimal
- Unhealthy air days now
- 1 days/yr
- Unhealthy air days in 30 yrs
- 2 days/yr
Risk factors via First Street. Map © Google.
Why this score? — see what drove the F grade
The composite is a weighted blend of 9 inputs, each scored 0–100. Each bar is that input's sub-score; the figure is the points it added to the 100-point composite (weight × sub-score).
- ARV discount +7.5/15.0
- Cash flow +6.3/30.0
- Livability +3.8/5.0
- Schools +2.8/10.0
- Rent growth +2.5/5.0
- Condition / age +2.5/5.0
- 1% rule +1.5/10.0
- DSCR +0.6/10.0
- Appreciation +0.0/10.0
$1
🖨 Deal sheet 📄 Offer letter ✓ Due diligence
Listing remarks MLS
Public Auction on May 9th at 10 AM at the Shelby County Fair Grounds in the Floral Hall. Open House on April 19th from 2 to 4 PM. Home has 2 bedrooms and 1 full bath. New shingles in 2022. Age and lot size are estimated.
Key facts
- 0.25 acre lot
- Built 1975
- Listed 34 days
Neighborhood map
What this means for you Summary
Snapshot
- This is a 2-bed/1.0-bath other listed at $1.
Deal economics
- At list price, monthly cash flow is $-343 ($-4k/yr) — negative.
- The deal already cash-flows at list — no discount required.
- Meets the 1% rule at list price ($1k rent vs $1).
Location & tenants
- Location reads 75/100 on livability (#101 in KY, #4,143 nationally) — a middle-class / working-renter tenant base. Strengths: cost of living A+, housing A+, crime A; Watch: schools D, amenities F, commute F.
- Shelby County (town): math 26% / reading 37% proficiency, ranked #77 of 165 in KY (top 47%) — families likely to look elsewhere, expect single-tenant / working-renter base with shorter leases.
- Market conditions: 292 active listings in the ZIP; 9 comparable units currently listed for rent nearby; rentals at typical pace (median 24d on market — plan ~3-4 weeks tenant-placement turnaround); solid renter incomes; 237 units permitted in Shelby County in 2024 (0 in 5+ unit buildings).
Forward outlook
- Local home prices are declining (-3.0%/yr); year-one equity from $1k of loan paydown is wiped out by about $6k of value loss. Plan a longer hold.
- Shelby County population projected at +34% by 2050 — long-run rental-demand tailwind backs the buy-and-hold thesis.
Negotiation context
- It's been on market 34 days — a 3% lower offer ($0) is reasonable based on typical stale-listing flexibility.
- 3 sale attempts since 20y ago with the ask held roughly flat each time — persistent listings suggest the price (not the market) is what's stuck; bring a comps-based counter.
Risks & watch-outs
- Watch-outs: property tax is 290153.5% of price.
- Climate carrying-cost: extreme-heat days projected 7→19/yr by 2055 (HVAC capex compounding) — expect insurance premiums to compound above CPI over the hold.
Questions for the listing agent
- What do current leases actually rent for vs. the listed asking? Can we see a recent rent roll and the last 12 months of T-12 income?
- It's been on market 34 days. Have you received any prior offers? Is the seller open to a 5% concession, seller financing, or rate buy-down credit?
- Built in 1975 — when were the roof, HVAC, electrical panel, plumbing, and water heater last replaced?
- Property tax is high relative to price — has the assessment been appealed recently, and will the sale trigger a re-assessment?
- Is there a deadline driving the sale (1031 exchange, divorce, estate, relocation)? That informs how much negotiation room exists.
- Schools are D-rated, which usually means shorter tenancies and higher turnover. Who's the typical renter profile here, and what's been the actual vacancy rate?
- The area grade is low — what's the realistic commute time and amenity access for the typical tenant pool here? Any planned neighborhood developments (good or bad) we should know about?
- What's the average days-on-market for RENTAL listings here right now (not sales)? A rising rental-DOM trend means longer vacancies and softer asking-rent achievability than the comps imply.
- What's the recent tenant-quality profile in this submarket — average credit score on applications, eviction rate, late-payment / NSF rate, and stable-employment percentage? A property-management company in the area should have these aggregated.
- How much new for-sale + rental construction is in the pipeline within 1–3 miles? Heavy new supply typically softens prices + rents 12–24 months out; constrained supply supports both.
Investment metrics
- 1% rule
- 0.65% ✗
- Cap rate
- 4.17%
- Cash-on-cash
- -7.60%
- DSCR
- 0.66
- GRM
- 12.8
CMA / ARV
- ARV (median comp)
- $193,436
- List price
- $1
- Delta
- -100.00%
- Verdict
- UNDERPRICED
- Comps
- 20 within 1.0 mi
Projected returns pro-forma
-3.0% appreciation · 3.0% rent growth · sell at horizon
- IRR
- -29.6%
- Equity multiple
- 0.02×
- Total profit
- $-53,171
- Equity at exit
- $28,842
- IRR
- -30.3%
- Equity multiple
- -0.37×
- Total profit
- $-74,352
- Equity at exit
- $16,725
Cash invested: $54,162 (down + closing). Projections, not guarantees.
Landlord ↔ Tenant lean methodology
- Overall (STATE)
- 83 Strongly Landlord-Friendly
- State Kentucky
- 83 Strongly Landlord-Friendly · R+16
- County
- — inherits STATE
- City
- — inherits STATE
ZIP-level market 40065
- Active inventory
- 292
Monthly cashflow live
- Estimated rent
- $1,258 high interval (Pro) →
- Mortgage (P&I)
- −$1,014
- Tax est. 1.5%
- −$242 /mo · $2,902/yr
- Insurance
- −$81
- HOA
- −$0
- Vacancy / Maint / Mgmt
- −$264
- Net cashflow
- $-343
Break-even live
UW: 25.0% down · 7.5% · 30yr · 1.5% tax · 5.0% vac · 8.0% maint · 8.0% mgmt
Financing live
Cash to close
- Down payment
- $48,359
- Closing costs
- $5,803
- Reserves months
- —
- Total cash needed
- —
Loan-product check · same deal, 3 products live
Conventional
25% down · 7.5% · 30yr
- Down + closing
- —
- Monthly P&I
- —
- Monthly cashflow
- —
- DSCR
- —
- Eligible?
- —
Personal DTI + credit; lowest rate.
DSCR
20% down · 8.5% · 30yr
- Down + closing
- —
- Monthly P&I
- —
- Monthly cashflow
- —
- DSCR
- —
- Eligible?
- —
No personal income docs; deal must DSCR.
Hard money
10% down · 12.0% · 12mo
- Down + closing
- —
- Monthly P&I
- —
- Monthly cashflow
- —
- DSCR
- —
- Eligible?
- —
Short-term bridge; refi at stabilization.
Rent comps 9 comps
| Address | Beds | Baths | Sqft | Rent | $/sqft | DOM | Units | Dist |
|---|---|---|---|---|---|---|---|---|
| 103 Martin Luther King Jr St Shelbyville, KY | 2.0 | 1.0 | 909 | $1,295 | $1.42 | 17d | 1 | 0.11mi |
| 1016 Washington St Unit 2 Shelbyville, KY | 1.0 | 1.0 | 600 | $825 | $1.38 | 23d | 1 | 0.20mi |
| 113 Ada Ave Shelbyville, KY | 2.0 | 1.5 | 1008 | $1,025 | $1.02 | 43d | 1 | 0.51mi |
| 1569 Sanford Ln Shelbyville, KY | 1.0–2.0 | 1.0–2.0 | 1017 | $1,225 | $1.20 | 1d | 5 | 0.62mi |
| 149 Gray Hill Ct Shelbyville, KY | 2.0 | 1.5 | 1050 | $895 | $0.85 | 23d | 1 | 0.87mi |
| 3025 Squire Cir Shelbyville, KY | 1.0 | 1.0 | 720 | $992 | $1.38 | 10d | 1 | 0.92mi |
| 874 Marian Village Dr Shelbyville, KY | 2.0–3.0 | 1.5–2.0 | 1015 | $1,095 | $1.08 | 1d | 4 | 1.08mi |
| 1856 Blackwell Rd Unit 1858 Blackwell Shelbyville, KY | 3.0 | 2.0 | 1100 | $1,695 | $1.54 | 43d | 1 | 1.18mi |
| 1814 Oakwood Dr Shelbyville, KY | 3.0 | 1.0 | 1050 | $1,599 | $1.52 | 43d | 1 | 1.19mi |
Listing history 6 events
-
2026-05-12status Pending 220-char remark
Show marketing remark (220 chars)
Public Auction on May 9th at 10 AM at the Shelby County Fair Grounds in the Floral Hall. Open House on April 19th from 2 to 4 PM. Home has 2 bedrooms and 1 full bath. New shingles in 2022. Age and lot size are estimated.
-
2026-04-08$1 Active 220-char remark
Show marketing remark (220 chars)
Public Auction on May 9th at 10 AM at the Shelby County Fair Grounds in the Floral Hall. Open House on April 19th from 2 to 4 PM. Home has 2 bedrooms and 1 full bath. New shingles in 2022. Age and lot size are estimated.
-
2010-09-25historical
-
2009-09-25$45,000
-
2007-11-15historical
-
2006-08-15$49,900
ⓘ Source: listings_history table (triggers on properties + properties_extension) + one-shot
backfill from property_details.listing_events for pre-trigger history.
Climate risk First Street
- Flood 1/10 Low FEMA zone X (unshaded) · 0% chance over 30 yrs
- Wildfire 1/10 Low
- Heat 5/10 Major 7 d/yr ≥104°F today · 19 d/yr by 30 yrs out
- Wind 2/10 Low 2% chance of damaging wind over 30 yrs
- Air quality 2/10 Low 1 unhealthy d/yr today · 2 by 30 yrs out
Nearby sold comps map
Loading sold comps map…
Walkable amenities ~0.75 mi
Loading nearby amenities…
Taxation est. · year 1
- Rental income
- $15,096
- − Mortgage interest
- −$10,835
- − Property taxes
- −$2,902
- − Insurance
- −$967
- − Repairs & maintenance
- −$1,208
- − Management
- −$1,208
- − Depreciation
- −$5,627
- Taxable loss
- −$7,651
- Est. tax savings @ 24.0%
- +$1,836
- After-tax cash flow
- $-2,280/yr
For passive investors: Depreciation is non-cash, so a rental often shows a tax loss while cash-flowing — sheltering income. Rental losses are passive: they offset passive income freely, and up to $25,000/yr can offset ordinary (W-2) income if you actively participate and your MAGI is under $100k (phasing out to $0 by $150k); unused losses carry forward. On sale, claimed depreciation is recaptured at up to 25%, and gains may owe capital-gains tax (a 1031 exchange can defer both). Figures are a year-1 estimate at your 24.0% rate — not tax advice; consult a CPA.
Schools (NCES district)
- District
- Shelby County
- NCES district ID
- 2105320
- Math proficiency
- 26% ▼ -10.00%
- Reading proficiency
- 37% ▼ -11.00%
- Median HH income
- $58,163
- Composite
- 28.19/100
- National rank
- #6809
- State rank
- #77 of 165 in KY
Livability — Shelbyville
- Score
- 75/100
- State rank
- #101
- US rank
- #4143
Category grades
Schools grade is shown separately in the Schools card above.
Census & demographics
- Census place
- Shelbyville, KY
- County
- Shelby County · 32,160 people
- City population
- 32,160
- Metro
- Louisville/Jefferson County, KY-IN
- Population (ZIP)
- 32,160
- Household income
- $77,869
- Rent vs Own
- Severe rent burden
- 655.0
Population outlook (Shelby County) Hauer SSP2
- Today (2025)
- 52,947 people
- By 2030
- 56,624 · +6.9%
- By 2040
- 63,983 · +20.8%
- By 2050
- 70,917 · +33.9%
- By 2075
- 87,345 · +65.0%
- By 2100
- 97,345 · +83.9%
Race, ethnicity, and origin ACS 2023
- Neighborhood character
- Predominantly White (74%)
- Race & ethnicity
- White 74% Hispanic / Latino 14% Two or more races 10% Black 6% Asian 1%
- Hispanic origin (detail)
- Mexican 7% Puerto Rican 1%
- Common ancestry
- Slovak 3% Serbian 2% Italian 2%
- Foreign-born
- 8% · Canada
- Languages at home
- 87% English-only · Spanish 11% Tagalog/Filipino 1% Other Asian/Pacific 1%
Political lean MEDSL · Shelby
- 2024 margin
- Solid R (+34.7) · D 31.8% · R 66.5% · Other 1.7%
- 2008→2024 swing
- -10.0pp toward R · 2008: -24.7pp · 2024: -34.7pp
- All cycles
- 2024: R+34.7 2020: R+29.6 2016: R+33.6 2012: R+27.6 2008: R+24.7
Not yet ingested
- Civics
- —
Market trends
- HPI YoY
- ▼ -144.73%
- Current HPI
- 177.2875
- Rent YoY
- —
- Metro
- Louisville/Jefferson County, KY-IN
- State GDP YoY
- ▲ 1.81%
- F500 in state
- 4
Industry mix (Fortune 500 HQ in KY)
| Industry | F500 HQs | Revenue |
|---|---|---|
| Healthcare | 1 | $118B |
|
||
| Food / Beverage | 1 | $7B |
|
||
Price history
-9.8% since first listed6 events — show timeline
- 2026-05-12 Pending — Metro Search MLS
- 2026-04-08 Listed $1 Metro Search MLS
- 2010-09-25 Listing Removed — Metro Search MLS
- 2009-09-25 Listed $45,000 Metro Search MLS
- 2007-11-15 Listing Removed — Metro Search MLS
- 2006-08-15 Listed $49,900 Metro Search MLS
Property tax history
+0.6%/yrLatest (2025): $406 · -0.9% YoY. Source: county tax records.
Cash-flow waterfall
monthlySold comps — $/sqft
last 12 mo · ≤1 miLoading sold comps…