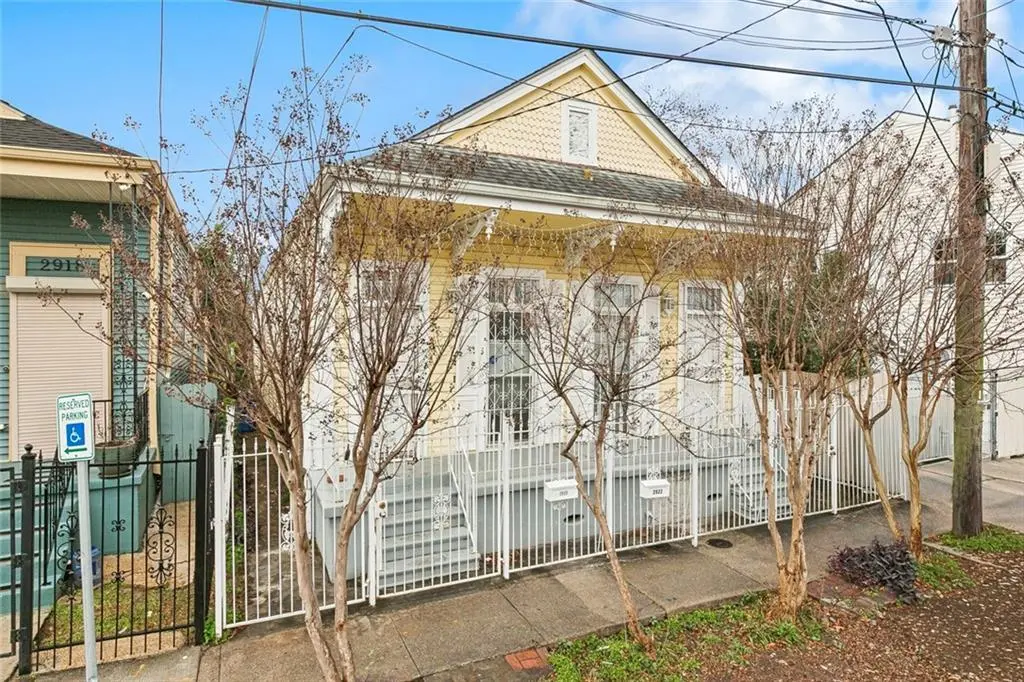
2920 Philip St · New Orleans, LA
Flood risk 8/10 · Major
- FEMA flood zone
- AE
- Chance of flooding over 30 yrs
- 0.77%
- Est. flood insurance / yr
- $1,737 – $8,500
Fire risk 1/10 · Minimal
- Est. fire insurance / yr
- $1,269 – $2,357
Heat risk 10/10 · Severe
- Hot days now (above 108°F)
- 7 days/yr
- Hot days in 30 yrs
- 20 days/yr
Wind risk 10/10 · Severe
- Chance of severe wind over 30 yrs
- 99.0%
Air-quality risk 3/10 · Minor
- Unhealthy air days now
- 3 days/yr
- Unhealthy air days in 30 yrs
- 4 days/yr
Risk factors via First Street. Map © Google.
Why this score? — see what drove the B grade
The composite is a weighted blend of 9 inputs, each scored 0–100. Each bar is that input's sub-score; the figure is the points it added to the 100-point composite (weight × sub-score).
- Cash flow +24.3/30.0
- ARV discount +15.0/15.0
- Appreciation +10.0/10.0
- DSCR +7.9/10.0
- 1% rule +5.6/10.0
- Rent growth +4.0/5.0
- Livability +4.0/5.0
- Condition / age +2.5/5.0
- Schools +1.6/10.0
$199,500
🖨 Deal sheet 📄 Offer letter ✓ Due diligence
Listing remarks MLS
Step into this classic New Orleans double shotgun-style gem featuring a spacious layout and a large shed in the backyard. Currently, the property has been converted into a single residence, but it can be restored to a double. This home offers 4 bedrooms, 2 full baths, and two living areas with high ceilings throughout. The backyard unit includes a functional half bath, good for guests or storage flexibility. For investors, the property can be reconfigured into two 2BD/1BA units, good for rental income. Conveniently located to shopping, dining, and the Superdome. Easy access to I-10.
Key facts
- Two living areas
- Backyard unit
- Double shotgun style
Tags
Neighborhood map
What this means for you Summary
Snapshot
- This is a 4-bed/2.0-bath single-family listed at $200k.
Deal economics
- At list price, monthly cash flow is $-24 ($-285/yr) — negative.
- To cash-flow at today's rent, offer at most $195k (2.1% below list).
- Meets the 1% rule at list price ($2k rent vs $200k).
- Recommended offer: $188k (6.0% below list) — sets the bar for market timing.
- Cap rate 8.7% vs local median 4.4% in New Orleans — top-decile yield for the area; either an underpriced asset or a hidden risk that comps aren't pricing in. Stress-test before assuming the spread holds.
Location & tenants
- Location reads 81/100 on livability (#3 in LA, #1,383 nationally) — a professional / high-income tenant draw. Strengths: amenities A+, commute A+, health & safety A+; Watch: crime C-, employment D.
- Orleans Parish (urban): math 11% / reading 27% proficiency, ranked #69 of 98 in LA (top 70%) — low school quality limits family demand, transient renter base, plan for 1-2y turnover; 68% free/reduced lunch — lower-income household profile, screen leases tightly.
- Market conditions: Rents rising fast (+6.0%/yr); 137 active listings in the ZIP; 40 comparable units currently listed for rent nearby; rentals at typical pace (median 24d on market — plan ~3-4 weeks tenant-placement turnaround); lower-income renter base — watch delinquency; 710 units permitted in Orleans Parish in 2024 (244 in 5+ unit buildings).
- At $2,117/mo this rent would consume 65% of the median local household income ($39k/yr) (locally 714% of renters already pay >50% of income on rent) — very limited rent-growth headroom before tenants either downsize or default.
Forward outlook
- In year one you build about $21k of equity ($1k loan paydown + $20k appreciation (10.0% local appreciation)).
- Orleans County population projected at +61% by 2050 — long-run rental-demand tailwind backs the buy-and-hold thesis.
- At projected returns (10.0% appreciation + 6.0% rent growth), your $56k cash investment doubles in ~3 years — after that, you're playing with house money.
- By year 2, paydown + projected appreciation supports a ~$34k cash-out refi (75% LTV) — recoverable capital for the next deal without selling this one.
Negotiation context
- It's been on market 67 days — a 6% lower offer ($188k) is reasonable based on typical stale-listing flexibility.
- 8 sale attempts since 32y ago with the ask held roughly flat each time — persistent listings suggest the price (not the market) is what's stuck; bring a comps-based counter.
Risks & watch-outs
- Watch-outs: flood insurance adds $427/mo; built in 1940 — expect roof / HVAC / electrical / plumbing capex.
- Climate carrying-cost: in FEMA flood zone AE (mandatory federal flood insurance); severe wind risk, 99% chance of damaging wind over 30y; extreme-heat days projected 7→20/yr by 2055 (HVAC capex compounding) — expect insurance premiums to compound above CPI over the hold.
Questions for the listing agent
- What do current leases actually rent for vs. the listed asking? Can we see a recent rent roll and the last 12 months of T-12 income?
- It's been on market 67 days. Have you received any prior offers? Is the seller open to a 6% concession, seller financing, or rate buy-down credit?
- Built in 1940 — when were the roof, HVAC, electrical panel, plumbing, and water heater last replaced?
- What's the actual annual flood-insurance premium (NFIP or private), and is the property in a SFHA with mandatory coverage?
- Why hasn't it sold? Are there any deal-killer items the seller is aware of (foundation, flood, title, zoning, code violations)?
- Is there a deadline driving the sale (1031 exchange, divorce, estate, relocation)? That informs how much negotiation room exists.
- What's the average days-on-market for RENTAL listings here right now (not sales)? A rising rental-DOM trend means longer vacancies and softer asking-rent achievability than the comps imply.
- What's the recent tenant-quality profile in this submarket — average credit score on applications, eviction rate, late-payment / NSF rate, and stable-employment percentage? A property-management company in the area should have these aggregated.
- How much new for-sale + rental construction is in the pipeline within 1–3 miles? Heavy new supply typically softens prices + rents 12–24 months out; constrained supply supports both.
Investment metrics
- 1% rule
- 1.06% ✓
- Cap rate
- 8.72%
- Cash-on-cash
- 8.65%
- DSCR
- 1.39
- GRM
- 7.9
CMA / ARV
- ARV (median comp)
- $252,047
- List price
- $199,500
- Delta
- -20.85%
- Verdict
- UNDERPRICED
- Comps
- 20 within 1.0 mi
Show comp detail 12 sales within ~0.75 mi
| Address | Dist | Beds/Ba | Sqft | Sold | Price | $/sf | Match |
|---|---|---|---|---|---|---|---|
| 2725 Philip St | 0.12mi | 3/2.0 (-1) | 1,404 (-7%) | 7mo | $199,000 | $142 | 72 |
| 1301 S Saratoga St | 0.64mi | 3/2.0 (-1) | 1,510 (-0%) | 2mo | $250,000 | $166 | 63 |
| 2014 Philip St | 0.61mi | 3/2.0 (-1) | 1,476 (-2%) | 3mo | $310,000 | $210 | 60 |
| 3404 Delachaise St | 0.58mi | 3/2.0 (-1) | 1,532 (+1%) | 8mo | $294,000 | $192 | 59 |
| 2321 Seventh St | 0.57mi | 3/2.0 (-1) | 1,425 (-6%) | 2mo | $325,000 | $228 | 57 |
| 1323 S Rampart St | 0.67mi | 3/2.0 (-1) | 1,477 (-2%) | 10mo | $275,000 | $186 | 52 |
| 2305 Washington Ave | 0.49mi | 3/2.0 (-1) | 1,382 (-9%) | 9mo | $337,000 | $244 | 50 |
| 4119 Clara St | 0.69mi | 3/2.0 (-1) | 1,404 (-7%) | 2mo | $400,000 | $285 | 49 |
| 2015 Martin Luther King Blvd | 0.63mi | 3/2.0 (-1) | 1,332 (-12%) | 3mo | $249,000 | $187 | 43 |
| 2107 Harmony St | 0.72mi | 4/2.0 | 1,730 (+14%) | 1mo | $322,000 | $186 | 42 |
| 1819 Baronne St | 0.74mi | 3/2.0 (-1) | 1,375 (-9%) | 5mo | $315,000 | $229 | 41 |
| 3205 S Saratoga St | 0.73mi | 3/2.5 (-1) | 1,677 (+11%) | 2mo | $425,000 | $253 | 39 |
Match score weights: distance 35% · size 25% · config 20% · recency 20%. Top-matched comps best support the ARV.
Projected returns pro-forma
10.0% appreciation · 5.98% rent growth · sell at horizon
- IRR
- 25.2%
- Equity multiple
- 3.04×
- Total profit
- $113,905
- Equity at exit
- $179,725
- IRR
- 23.2%
- Equity multiple
- 7.30×
- Total profit
- $352,026
- Equity at exit
- $387,585
Cash invested: $55,860 (down + closing). Projections, not guarantees.
Landlord ↔ Tenant lean methodology
- Overall (STATE)
- 90 Strongly Landlord-Friendly
- State Louisiana
- 90 Strongly Landlord-Friendly · R+12
- County
- — inherits STATE
- City
- — inherits STATE
ZIP-level market 70113
- Rents YoY
- 6.0%
- Active inventory
- 137
- Price-to-rent
- 7.9×
Monthly cashflow live
- Estimated rent
- $2,117 high interval (Pro) →
- Mortgage (P&I)
- −$1,046
- Tax from tax record
- −$140 /mo · $1,680/yr
- Insurance
- −$83
- Flood insurance flood zone
- −$427 /mo · $5,118/yr
- HOA
- −$0
- Vacancy / Maint / Mgmt
- −$444
- Net cashflow
- $-24
Break-even live
UW: 25.0% down · 7.5% · 30yr · 1.5% tax · 5.0% vac · 8.0% maint · 8.0% mgmt
Financing live
Cash to close
- Down payment
- $49,875
- Closing costs
- $5,985
- Reserves months
- —
- Total cash needed
- —
Loan-product check · same deal, 3 products live
Conventional
25% down · 7.5% · 30yr
- Down + closing
- —
- Monthly P&I
- —
- Monthly cashflow
- —
- DSCR
- —
- Eligible?
- —
Personal DTI + credit; lowest rate.
DSCR
20% down · 8.5% · 30yr
- Down + closing
- —
- Monthly P&I
- —
- Monthly cashflow
- —
- DSCR
- —
- Eligible?
- —
No personal income docs; deal must DSCR.
Hard money
10% down · 12.0% · 12mo
- Down + closing
- —
- Monthly P&I
- —
- Monthly cashflow
- —
- DSCR
- —
- Eligible?
- —
Short-term bridge; refi at stabilization.
Rent comps 40 comps
| Address | Beds | Baths | Sqft | Rent | $/sqft | DOM | Units | Dist |
|---|---|---|---|---|---|---|---|---|
| 3108 Second St New Orleans, LA | 3.0 | 3.0 | 1216 | $2,100 | $1.73 | 3d | 1 | 0.20mi |
| 2722 Martin L King Bl New Orleans, LA | 3.0 | 2.5 | 1350 | $1,800 | $1.33 | 23d | 1 | 0.21mi |
| 3120 Second St New Orleans, LA | 3.0 | 3.0 | 1256 | $2,050 | $1.63 | 23d | 1 | 0.21mi |
| 3122 2nd St New Orleans, LA | 3.0 | 3.0 | 1206 | $2,075 | $1.72 | 23d | 1 | 0.21mi |
| 2608 Magnolia St New Orleans, LA | 4.0 | 2.5 | 1950 | $3,200 | $1.64 | 43d | 1 | 0.24mi |
| 1407 Magnolia St New Orleans, LA | 3.0 | 2.0 | 1824 | $1,500 | $0.82 | 23d | 1 | 0.28mi |
| 2526 Martin Luther King Junior Blvd New Orleans, LA | 3.0 | 2.0 | 1200 | $2,200 | $1.83 | 3d | 1 | 0.29mi |
| 3218 Jackson Ave New Orleans, LA | 3.0 | 2.0 | 1267 | $1,750 | $1.38 | 23d | 1 | 0.30mi |
| 2614 S Johnson St New Orleans, LA | 3.0 | 2.0 | 1536 | $2,079 | $1.35 | 14d | 1 | 0.37mi |
| 2231 S Liberty St New Orleans, LA | 3.0 | 3.5 | 1752 | $2,000 | $1.14 | 17d | 1 | 0.37mi |
| 2123 S Liberty St Unit 2125 New Orleans, LA | 3.0 | 2.0 | 1500 | $2,100 | $1.40 | 3d | 1 | 0.37mi |
| 2833 S Derbigny St New Orleans, LA | 3.0 | 2.0 | 1500 | $1,795 | $1.20 | 23d | 1 | 0.38mi |
| 2318 Martin Luther King Junior Blvd New Orleans, LA | 3.0 | 2.0 | 1400 | $1,700 | $1.21 | 23d | 1 | 0.41mi |
| 2225 2nd St New Orleans, LA | 3.0 | 2.0 | 1100 | $1,800 | $1.64 | 23d | 1 | 0.45mi |
| 2606 S Miro St New Orleans, LA | 3.0 | 2.0 | 1450 | $2,016 | $1.39 | 23d | 1 | 0.47mi |
| 3044 Louisiana Avenue Pkwy New Orleans, LA | 3.0 | 2.0 | 1800 | $1,900 | $1.06 | 23d | 1 | 0.51mi |
| 2102 Josephine St New Orleans, LA | 4.0 | 2.0 | 1286 | $2,100 | $1.63 | 23d | 1 | 0.52mi |
| 3617 Fourth St Unit A New Orleans, LA | 3.0 | 2.0 | 1225 | $1,995 | $1.63 | 17d | 1 | 0.53mi |
| 3208 Louisiana Avenue Pkwy New Orleans, LA | 3.0 | 2.0 | 1391 | $1,900 | $1.37 | 17d | 1 | 0.53mi |
| 2717 Loyola Ave New Orleans, LA | 3.0 | 2.0 | 1250 | $2,300 | $1.84 | 2d | 1 | 0.54mi |
| 2717 Loyola Ave New Orleans, LA | 3.0 | 2.0 | 1232 | $2,300 | $1.87 | 23d | 1 | 0.54mi |
| 2403 S Saratoga St New Orleans, LA | 3.0 | 2.5 | 1600 | $2,500 | $1.56 | 23d | 1 | 0.54mi |
| 3035 Delachaise St New Orleans, LA | 3.0 | 1.0 | 1968 | $1,750 | $0.89 | 2d | 1 | 0.55mi |
| 1944 Jackson Ave New Orleans, LA | 3.0 | 2.5 | 1572 | $2,500 | $1.59 | 43d | 1 | 0.57mi |
| 3429 Clara St New Orleans, LA | 3.0 | 2.0 | 1620 | $2,350 | $1.45 | 14d | 1 | 0.57mi |
| 2107 Fourth St New Orleans, LA | 3.0 | 1.0 | 1292 | $1,775 | $1.37 | 17d | 1 | 0.58mi |
| 3435 Magnolia St New Orleans, LA | 3.0 | 1.0 | 1050 | $1,500 | $1.43 | 23d | 1 | 0.60mi |
| 1915 Philip St New Orleans, LA | 3.0 | 1.5 | 1300 | $2,450 | $1.88 | 23d | 1 | 0.62mi |
| 3514 S Miro St New Orleans, LA | 3.0 | 2.0 | 1230 | $1,950 | $1.59 | 17d | 1 | 0.66mi |
| 2301 Dryades St New Orleans, LA | 3.0 | 3.0 | 2070 | $3,000 | $1.45 | 3d | 1 | 0.66mi |
| 2733 Danneel St New Orleans, LA | 4.0 | 2.0 | 1350 | $1,775 | $1.31 | 23d | 1 | 0.66mi |
| 2539 Amelia St New Orleans, LA | 3.0 | 2.0 | 1296 | $2,200 | $1.70 | 23d | 1 | 0.66mi |
| 4206 S Derbigny St New Orleans, LA | 3.0 | 1.0 | 1300 | $1,600 | $1.23 | 23d | 1 | 0.72mi |
| 2625 Baronne St Unit 1 New Orleans, LA | 3.0 | 1.5 | 2100 | $2,600 | $1.24 | 43d | 1 | 0.76mi |
| 2717 Milan St New Orleans, LA | 3.0 | 1.5 | 1850 | $1,650 | $0.89 | 14d | 1 | 0.76mi |
| 2535 Marengo St New Orleans, LA | 3.0 | 1.0 | 1300 | $1,200 | $0.92 | 14d | 1 | 0.77mi |
| 2713 Baronne St New Orleans, LA | 3.0 | 2.5 | 1600 | $2,300 | $1.44 | 23d | 1 | 0.77mi |
| 4305 S Johnson St Unit 4305 New Orleans, LA | 3.0 | 1.0 | 1175 | $1,595 | $1.36 | 11d | 1 | 0.78mi |
| 3212 Danneel St New Orleans, LA | 3.0 | 2.0 | 1945 | $2,000 | $1.03 | 23d | 1 | 0.81mi |
| 1201 Baronne St #1 New Orleans, LA | 3.0 | 2.5 | 1892 | $2,700 | $1.43 | 17d | 1 | 0.82mi |
Listing history 35 events
-
2026-06-18days on market $199,500 Active 67 DOM
-
2026-06-17days on market $199,500 Active 66 DOM
-
2026-06-16days on market $199,500 Active 65 DOM
-
2026-06-15days on market $199,500 Active 64 DOM
-
2026-06-13days on market $199,500 Active 62 DOM
-
2026-06-10days on market $199,500 Active 59 DOM
-
2026-06-09days on market $199,500 Active 58 DOM
-
2026-06-08days on market $199,500 Active 57 DOM
-
2026-06-07days on market $199,500 Active 56 DOM
-
2026-06-05days on market $199,500 Active 53 DOM
-
2026-06-03days on market $199,500 Active 52 DOM
-
2026-06-02days on market $199,500 Active 51 DOM
-
2026-06-01days on market $199,500 Active 50 DOM
-
2026-05-31days on market $199,500 Active 49 DOM
-
2026-05-01price $199,500 589-char remark
Show marketing remark (595 chars)
Step into this classic New Orleans double shotgun–style gem featuring a spacious layout and a large shed in the backyard. Currently, the property has been converted into a single residence, but it can be restored to a double. This home offers 4 bedrooms, 2 full baths, and two living areas with high ceilings throughout. The backyard unit includes a functional half bath, good for guests or storage flexibility. For investors, the property can be reconfigured into two 2BD/1BA units, good for rental income. Conveniently located to shopping, dining, and the Superdome. Easy access to I-10.
-
2026-05-01price $199,500 595-char remark
Show marketing remark (595 chars)
Step into this classic New Orleans double shotgun–style gem featuring a spacious layout and a large shed in the backyard. Currently, the property has been converted into a single residence, but it can be restored to a double. This home offers 4 bedrooms, 2 full baths, and two living areas with high ceilings throughout. The backyard unit includes a functional half bath, good for guests or storage flexibility. For investors, the property can be reconfigured into two 2BD/1BA units, good for rental income. Conveniently located to shopping, dining, and the Superdome. Easy access to I-10.
-
2026-04-12$204,500 Active 589-char remark
Show marketing remark (595 chars)
Step into this classic New Orleans double shotgun–style gem featuring a spacious layout and a large shed in the backyard. Currently, the property has been converted into a single residence, but it can be restored to a double. This home offers 4 bedrooms, 2 full baths, and two living areas with high ceilings throughout. The backyard unit includes a functional half bath, good for guests or storage flexibility. For investors, the property can be reconfigured into two 2BD/1BA units, good for rental income. Conveniently located to shopping, dining, and the Superdome. Easy access to I-10.
-
2026-04-12$204,500 Active 595-char remark
Show marketing remark (595 chars)
Step into this classic New Orleans double shotgun–style gem featuring a spacious layout and a large shed in the backyard. Currently, the property has been converted into a single residence, but it can be restored to a double. This home offers 4 bedrooms, 2 full baths, and two living areas with high ceilings throughout. The backyard unit includes a functional half bath, good for guests or storage flexibility. For investors, the property can be reconfigured into two 2BD/1BA units, good for rental income. Conveniently located to shopping, dining, and the Superdome. Easy access to I-10.
-
2026-03-21price $204,500
-
2026-03-21price $204,500
-
2026-01-23$209,500 Active
-
2025-11-03price $215,000
-
2025-11-03price $215,000
-
2025-10-08$225,000 Active
-
2021-05-17soldstatus $225,000
-
2021-05-14soldstatus $225,000 Closed
-
2021-03-18status Pending
-
2020-11-10price $225,000
-
2020-10-12$225,000
-
2020-10-12$235,000 Active
-
1994-12-29soldstatus $4,500
-
1994-12-23soldstatus $4,500
-
1994-09-22$5,300
-
1994-09-22$5,300
-
1985-07-19soldstatus $407,310
ⓘ Source: listings_history table (triggers on properties + properties_extension) + one-shot
backfill from property_details.listing_events for pre-trigger history.
Tax reassessment forecast LA · Resets to sale price
- Current annual tax
- $1,680 · $140/mo
- Projected year-2 tax
- $1,680 · $140/mo
- Expected delta
- $0/yr ($0/mo · 0.0%)
ⓘ Screening estimate from a state-policy table — verify with the county assessor before closing.
Climate risk First Street
- Flood 8/10 Severe FEMA zone AE · 77% chance over 30 yrs
- Wildfire 1/10 Low
- Heat 10/10 Extreme 7 d/yr ≥108°F today · 20 d/yr by 30 yrs out
- Wind 10/10 Extreme 99% chance of damaging wind over 30 yrs
- Air quality 3/10 Moderate 3 unhealthy d/yr today · 4 by 30 yrs out
Nearby sold comps map
Loading sold comps map…
Walkable amenities ~0.75 mi
Loading nearby amenities…
Taxation est. · year 1
- Rental income
- $25,400
- − Mortgage interest
- −$11,175
- − Property taxes
- −$1,680
- − Insurance
- −$6,116
- − Repairs & maintenance
- −$2,032
- − Management
- −$2,032
- − Depreciation
- −$5,804
- Taxable loss
- −$3,439
- Est. tax savings @ 24.0%
- +$825
- After-tax cash flow
- $541/yr
For passive investors: Depreciation is non-cash, so a rental often shows a tax loss while cash-flowing — sheltering income. Rental losses are passive: they offset passive income freely, and up to $25,000/yr can offset ordinary (W-2) income if you actively participate and your MAGI is under $100k (phasing out to $0 by $150k); unused losses carry forward. On sale, claimed depreciation is recaptured at up to 25%, and gains may owe capital-gains tax (a 1031 exchange can defer both). Figures are a year-1 estimate at your 24.0% rate — not tax advice; consult a CPA.
Schools (NCES district)
- District
- Orleans Parish
- NCES district ID
- 2201170
- Math proficiency
- 11% ▼ -52.00%
- Reading proficiency
- 27% ▼ -46.00%
- Median HH income
- $37,011
- Composite
- 15.78/100
- National rank
- #9271
- State rank
- #69 of 98 in LA
Livability — New Orleans
- Score
- 81/100
- State rank
- #3
- US rank
- #1383
Category grades
Schools grade is shown separately in the Schools card above.
Census & demographics
- Census place
- New Orleans, LA
- County
- Orleans Parish · 338,817 people
- City population
- 338,817
- Metro
- New Orleans-Metairie, LA
- Population (ZIP)
- 9,387
- Household income
- $39,333
- Rent vs Own
- Severe rent burden
- 714.0
Population outlook (Orleans County) Hauer SSP2
- Today (2025)
- 513,025 people
- By 2030
- 575,781 · +12.2%
- By 2040
- 700,174 · +36.5%
- By 2050
- 826,541 · +61.1%
- By 2075
- 1,123,374 · +119.0%
- By 2100
- 1,355,609 · +164.2%
Race, ethnicity, and origin ACS 2023
- Neighborhood character
- Diverse neighborhood (Simpson 0.57)
- Race & ethnicity
- Black 61% White 20% Hispanic / Latino 13% Two or more races 11% Asian 2%
- Hispanic origin (detail)
- Mexican 2%
- Common ancestry
- Lithuanian 2% Portuguese 1% Slovak 1%
- Foreign-born
- 13% · Canada, Vietnam, China
- Languages at home
- 86% English-only · Spanish 11% Other Indo-European 1% Vietnamese 1%
Political lean MEDSL · Orleans
- 2024 margin
- Solid D (+67.0) · D 82.2% · R 15.2% · Other 2.7%
- 2008→2024 swing
- +6.7pp toward D · 2008: 60.3pp · 2024: 67.0pp
- All cycles
- 2024: D+67.0 2020: D+68.2 2016: D+66.2 2012: D+62.5 2008: D+60.3
Not yet ingested
- Civics
- —
Market trends
- HPI YoY
- ▲ 65.92%
- Current HPI
- 229.3968
- Rent YoY
- ▲ 5.98%
- Metro
- New Orleans-Metairie, LA
- State GDP YoY
- ▲ 3.29%
- F500 in state
- 10
Industry mix (Fortune 500 HQ in LA)
| Industry | F500 HQs | Revenue |
|---|---|---|
| Telecommunications | 2 | $23B |
|
||
| Utilities | 1 | $12B |
|
||
| Wholesale / Distribution | 1 | $5B |
|
||
| Advertising | 1 | $2B |
|
||
Price history
-51.0% since first listed21 events — show timeline
- 2026-05-01 Price Changed $199,500 AcadianaMLS
- 2026-05-01 Price Changed $199,500 GSREIN
- 2026-04-12 Listed $204,500 GSREIN
- 2026-04-12 Listed $204,500 AcadianaMLS
- 2026-03-21 Price Changed $204,500 AcadianaMLS
- 2026-03-21 Price Changed $204,500 GSREIN
- 2026-01-23 Listed $209,500 AcadianaMLS
- 2025-11-03 Price Changed $215,000 AcadianaMLS
- 2025-11-03 Price Changed $215,000 GSREIN
- 2025-10-08 Listed $225,000 AcadianaMLS
- 2021-05-17 Sold (Public Records) $225,000 Public Records
- 2021-05-14 Sold (MLS) $225,000 GSREIN
- 2021-03-18 Pending — GSREIN
- 2020-11-10 Price Changed $225,000 GSREIN
- 2020-10-12 Listed $235,000 GSREIN
- 2020-10-12 Listed $225,000 AcadianaMLS
- 1994-12-29 Sold (Public Records) $4,500 Public Records
- 1994-12-23 Sold (MLS) $4,500 GSREIN
- 1994-09-22 Listed $5,300 AcadianaMLS
- 1994-09-22 Listed $5,300 GSREIN
- 1985-07-19 Sold (Public Records) $407,310 Public Records
Property tax history
+12.1%/yrLatest (2026): $1,680 · -5.0% YoY. Source: county tax records.
Cash-flow waterfall
monthlySold comps — $/sqft
last 12 mo · ≤1 miLoading sold comps…