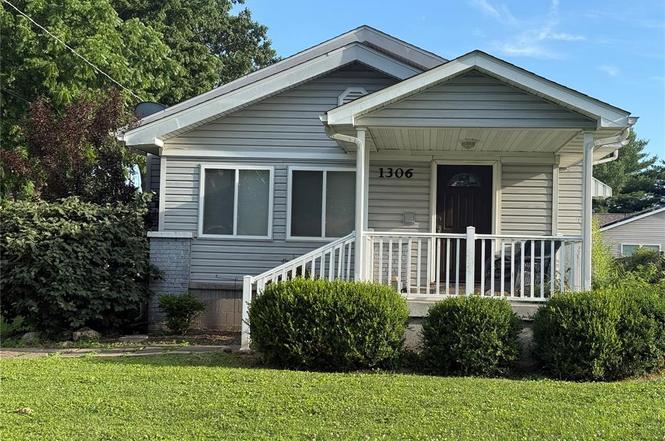
1306 Main St · South Roxana, IL
Flood risk 1/10 · Minimal
- FEMA flood zone
- X
- Chance of flooding over 30 yrs
- 0.0%
- Est. flood insurance / yr
- $473 – $860
Fire risk 1/10 · Minimal
- Est. fire insurance / yr
- $804 – $1,492
Heat risk 5/10 · Moderate
- Hot days now (above 107°F)
- 7 days/yr
- Hot days in 30 yrs
- 20 days/yr
Wind risk 2/10 · Minimal
- Chance of severe wind over 30 yrs
- 2.0%
Air-quality risk 4/10 · Minor
- Unhealthy air days now
- 5 days/yr
- Unhealthy air days in 30 yrs
- 6 days/yr
Risk factors via First Street. Map © Google.
Why this score? — see what drove the D+ grade
The composite is a weighted blend of 9 inputs, each scored 0–100. Each bar is that input's sub-score; the figure is the points it added to the 100-point composite (weight × sub-score).
- ARV discount +12.6/15.0
- Cash flow +12.0/30.0
- Appreciation +5.0/10.0
- 1% rule +3.9/10.0
- DSCR +3.5/10.0
- Livability +2.9/5.0
- Rent growth +2.5/5.0
- Condition / age +2.5/5.0
- Schools +1.7/10.0
$105,000
🖨 Deal sheet 📄 Offer letter ✓ Due diligence
Listing remarks
Come see this whimsical home that boast charm, character, and beautiful landscaping with lots of perennial flowers! The home has two bedrooms, full bath, spacious kitchen with lots of cabinets and main floor laundry off the kitchen. The lower level has a bonus room, storage area, utility area and a water softener tank that will stay. The kitchen appliances, washer and dryer will stay with the home. Some of the outdoor features are a covered front porch, a back porch, 2 car garage with a 3 car carport, shed for storage, partial fencing, extra long driveway for parking and it has an extra lot that goes with it! Additional PIN# 18-2-14-01-13-304-008. Roof 2019, A/C 2024 or 2025,
Key facts
- Covered front porch
- Water softener tank
- Spacious kitchen
Tags
Property features AI
Finance
- HOA & community: Community amenities include nearby park and pool
Exterior
- Parking: Total 5 parking spaces; 2-car garage with automatic door (garage faces side) — approx. 25 x 26; 3-car carport; Additional garage(s) and shed(s) on the property
- Utilities: Public water; Public sewer; Electric service by Ameren; Cable available; Natural gas connected; Electricity connected
- Home design: Single family residence; Private ownership; One level
- Construction: Vinyl siding; Architectural shingle roof; Block foundation; Home built (year per assessor)
- Exterior features: Front porch; Rear porch; Front yard; Landscaped lot; Level lot; Chip-and-seal road frontage; No fencing
Interior
- Kitchen: Dishwasher; Range; Microwave; Refrigerator
- Bedrooms: 2 bedrooms (both on the main level)
- Flooring: Tile; Vinyl
- Bathrooms: 1 full bathroom (on the main level)
- Heating & cooling: Forced air heating; Central air conditioning
- Interior features: Eat-in kitchen; Basement is block construction
- Laundry & utility: Washer; Dryer; Laundry on the main level
Neighborhood map
What this means for you Summary
Snapshot
- This is a 2-bed/1.0-bath single-family listed at $105k.
Deal economics
- At list price, monthly cash flow is $-25 ($-299/yr) — negative.
- To cash-flow at today's rent, offer at most $101k (4.2% below list).
- To meet the 1% rule (rent ≥ 1% of price), the offer needs to be $93k (11.2% below list).
- Recommended offer: $93k (11.2% below list) — sets the bar for 1% rule.
Location & tenants
- Location reads 58/100 on livability (#1,141 in IL) — a working-class tenant base; expect higher turnover. Strengths: cost of living A+, housing A+; Watch: amenities F, commute F, employment F.
- Roxana CUSD 1 (suburban): math 18% / reading 19% proficiency, ranked #440 of 620 in IL (top 71%) — low school quality limits family demand, transient renter base, plan for 1-2y turnover.
- Zoned schools: Roxana Sr High School (math 12% / reading 12%, grade F, #511 of 693 statewide, top 75%, 515 students, 0% FRL) — zoned schools average 0% FRL vs 51% district-wide (51 pts lower); this property's tenant base skews higher-income than the district average.
- Market conditions: 6 active listings in the ZIP; 336 units permitted in Madison County in 2024 (0 in 5+ unit buildings).
Forward outlook
- In year one you build about $4k of equity ($726 loan paydown + $3k appreciation (3.0% local appreciation)).
- Madison County population projected at -18% by 2050 — secular population decline; favor cash flow + early exit over multi-decade hold.
- At projected returns (3.0% appreciation + 3.0% rent growth), your $29k cash investment doubles in ~7 years — after that, you're playing with house money.
- By year 9, paydown + projected appreciation supports a ~$33k cash-out refi (75% LTV) — recoverable capital for the next deal without selling this one.
Negotiation context
- Only 1 days on market — expect competitive offers; lowballing is unlikely to land.
- Current owner paid $85k; 24% above their basis — modest negotiation headroom, anchor on the comps not their cost.
Risks & watch-outs
- Watch-outs: built in 1940 — expect roof / HVAC / electrical / plumbing capex.
- Climate carrying-cost: extreme-heat days projected 7→20/yr by 2055 (HVAC capex compounding) — expect insurance premiums to compound above CPI over the hold.
Questions for the listing agent
- What do current leases actually rent for vs. the listed asking? Can we see a recent rent roll and the last 12 months of T-12 income?
- Built in 1940 — when were the roof, HVAC, electrical panel, plumbing, and water heater last replaced?
- Is there a deadline driving the sale (1031 exchange, divorce, estate, relocation)? That informs how much negotiation room exists.
- Schools are F-rated, which usually means shorter tenancies and higher turnover. Who's the typical renter profile here, and what's been the actual vacancy rate?
- The area grade is low — what's the realistic commute time and amenity access for the typical tenant pool here? Any planned neighborhood developments (good or bad) we should know about?
- What's the average days-on-market for RENTAL listings here right now (not sales)? A rising rental-DOM trend means longer vacancies and softer asking-rent achievability than the comps imply.
- What's the recent tenant-quality profile in this submarket — average credit score on applications, eviction rate, late-payment / NSF rate, and stable-employment percentage? A property-management company in the area should have these aggregated.
- How much new for-sale + rental construction is in the pipeline within 1–3 miles? Heavy new supply typically softens prices + rents 12–24 months out; constrained supply supports both.
Investment metrics
- 1% rule
- 0.89% ✗
- Cap rate
- 6.01%
- Cash-on-cash
- -1.02%
- DSCR
- 0.95
- GRM
- 9.4
CMA / ARV
- ARV (on-the-fly)
- $118,560
- Comps found
- 12
Show comp detail 12 sales within ~0.75 mi
| Address | Dist | Beds/Ba | Sqft | Sold | Price | $/sf | Match |
|---|---|---|---|---|---|---|---|
| 434 Ohio Ave | 0.38mi | 3/1.0 (+1) | 1,062 (+2%) | 6mo | $152,700 | $144 | 69 |
| 918 Illinois Ave | 0.29mi | 3/1.0 (+1) | 1,106 (+6%) | 3mo | $85,000 | $77 | 68 |
| 908 Ohio Ave | 0.20mi | 3/1.0 (+1) | 1,118 (+8%) | 14mo | $127,000 | $114 | 61 |
| 459 Missouri Ave | 0.28mi | 3/1.0 (+1) | 960 (-8%) | 15mo | $125,000 | $130 | 56 |
| 1201 Broadway Ave | 0.12mi | 2/1.0 | 912 (-12%) | 22mo | $139,000 | $152 | 55 |
| 912 Washington Dr | 0.20mi | 3/2.0 (+1) | 1,196 (+15%) | 3mo | $55,750 | $47 | 54 |
| 505 Southard Pl | 0.41mi | 3/1.0 (+1) | 1,153 (+11%) | 7mo | $79,900 | $69 | 52 |
| 208 Pennsylvania Ave | 0.50mi | 2/1.0 | 952 (-8%) | 13mo | $40,000 | $42 | 52 |
| 307 Rose Ave | 0.45mi | 2/1.0 | 899 (-14%) | 7mo | $150,000 | $167 | 51 |
| 309 Pennsylvania | 0.42mi | 2/1.0 | 884 (-15%) | 18mo | $99,900 | $113 | 40 |
| 212 Stephenson | 0.49mi | 3/1.0 (+1) | 936 (-10%) | 20mo | $80,000 | $85 | 39 |
| 425 Sinclair Ave | 0.53mi | 2/1.0 | 896 (-14%) | 17mo | $129,900 | $145 | 38 |
Match score weights: distance 35% · size 25% · config 20% · recency 20%. Top-matched comps best support the ARV.
Projected returns pro-forma
3.0% appreciation · 3.0% rent growth · sell at horizon
- IRR
- 6.6%
- Equity multiple
- 1.38×
- Total profit
- $11,098
- Equity at exit
- $47,213
- IRR
- 9.4%
- Equity multiple
- 2.42×
- Total profit
- $41,796
- Equity at exit
- $72,760
Cash invested: $29,400 (down + closing). Projections, not guarantees.
Landlord ↔ Tenant lean methodology
- Overall (STATE)
- 43 Moderately Tenant-Leaning
- State Illinois
- 43 Moderately Tenant-Leaning · D+7
- County
- — inherits STATE
- City
- — inherits STATE
ZIP-level market 62087
- Active inventory
- 6
- Price-to-rent
- 9.4×
Monthly cashflow live
- Estimated rent
- $932 medium interval (Pro) →
- Mortgage (P&I)
- −$551
- Tax from tax record
- −$167 /mo · $2,001/yr
- Insurance
- −$44
- HOA
- −$0
- Vacancy / Maint / Mgmt
- −$196
- Net cashflow
- $-25
Break-even live
UW: 25.0% down · 7.5% · 30yr · 1.5% tax · 5.0% vac · 8.0% maint · 8.0% mgmt
Financing live
Cash to close
- Down payment
- $26,250
- Closing costs
- $3,150
- Reserves months
- —
- Total cash needed
- —
Loan-product check · same deal, 3 products live
Conventional
25% down · 7.5% · 30yr
- Down + closing
- —
- Monthly P&I
- —
- Monthly cashflow
- —
- DSCR
- —
- Eligible?
- —
Personal DTI + credit; lowest rate.
DSCR
20% down · 8.5% · 30yr
- Down + closing
- —
- Monthly P&I
- —
- Monthly cashflow
- —
- DSCR
- —
- Eligible?
- —
No personal income docs; deal must DSCR.
Hard money
10% down · 12.0% · 12mo
- Down + closing
- —
- Monthly P&I
- —
- Monthly cashflow
- —
- DSCR
- —
- Eligible?
- —
Short-term bridge; refi at stabilization.
Listing history 3 events
-
2026-06-18status $105,000 Active 1 DOM
-
2026-06-17remarks 699-char remark
-
2026-06-17$105,000 Coming Soon 1 DOM
ⓘ Source: listings_history table (triggers on properties + properties_extension) + one-shot
backfill from property_details.listing_events for pre-trigger history.
Tax reassessment forecast IL · Partial reset (capped growth)
- Current annual tax
- $2,001 · $167/mo
- Projected year-2 tax
- $2,192 · $183/mo
- Expected delta
- +$191/yr (+$16/mo · 9.6%)
ⓘ Screening estimate from a state-policy table — verify with the county assessor before closing.
Climate risk First Street
- Flood 1/10 Low FEMA zone X · 0% chance over 30 yrs
- Wildfire 1/10 Low
- Heat 5/10 Major 7 d/yr ≥107°F today · 20 d/yr by 30 yrs out
- Wind 2/10 Low 2% chance of damaging wind over 30 yrs
- Air quality 4/10 Moderate 5 unhealthy d/yr today · 6 by 30 yrs out
Nearby sold comps map
Loading sold comps map…
Walkable amenities ~0.75 mi
Loading nearby amenities…
Taxation est. · year 1
- Rental income
- $11,183
- − Mortgage interest
- −$5,882
- − Property taxes
- −$2,001
- − Insurance
- −$525
- − Repairs & maintenance
- −$895
- − Management
- −$895
- − Depreciation
- −$3,055
- Taxable loss
- −$2,068
- Est. tax savings @ 24.0%
- +$496
- After-tax cash flow
- $197/yr
For passive investors: Depreciation is non-cash, so a rental often shows a tax loss while cash-flowing — sheltering income. Rental losses are passive: they offset passive income freely, and up to $25,000/yr can offset ordinary (W-2) income if you actively participate and your MAGI is under $100k (phasing out to $0 by $150k); unused losses carry forward. On sale, claimed depreciation is recaptured at up to 25%, and gains may owe capital-gains tax (a 1031 exchange can defer both). Figures are a year-1 estimate at your 24.0% rate — not tax advice; consult a CPA.
Schools (NCES district)
- District
- Roxana CUSD 1
- NCES district ID
- 1735010
- Math proficiency
- 18% ▼ -8.00%
- Reading proficiency
- 19% ▼ -11.00%
- Median HH income
- $50,661
- Composite
- 16.73/100
- National rank
- #9164
- State rank
- #440 of 620 in IL
Livability — South Roxana
- Score
- 58/100
- State rank
- #1141
- US rank
- #21542
Category grades
Schools grade is shown separately in the Schools card above.
Census & demographics
- Census place
- South Roxana, IL
- Population (ZIP)
- 2,180
Population outlook (Madison County) Hauer SSP2
- Today (2025)
- 258,371 people
- By 2030
- 251,523 · -2.7%
- By 2040
- 233,640 · -9.6%
- By 2050
- 213,042 · -17.5%
- By 2075
- 165,255 · -36.0%
- By 2100
- 123,953 · -52.0%
Race, ethnicity, and origin ACS 2023
- Neighborhood character
- Predominantly White (85%)
- Race & ethnicity
- White 85% Two or more races 9% Hispanic / Latino 5% Black 4%
- Common ancestry
- Iranian 2% Slovak 2% Lithuanian 2%
- Foreign-born
- 2% · Canada
- Languages at home
- 94% English-only · Spanish 6%
Political lean MEDSL · Madison
- 2024 margin
- R (+13.3) · D 42.5% · R 55.8% · Other 1.8%
- 2008→2024 swing
- -22.5pp toward R · 2008: 9.2pp · 2024: -13.3pp
- All cycles
- 2024: R+13.3 2020: R+13.2 2016: R+15.6 2012: R+1.4 2008: D+9.2
Not yet ingested
- Civics
- —
Market trends
- HPI YoY
- —
- Current HPI
- —
- Rent YoY
- —
- Metro
- —
- State GDP YoY
- ▲ 1.59%
- F500 in state
- 60
Industry mix (Fortune 500 HQ in IL)
| Industry | F500 HQs | Revenue |
|---|---|---|
| Insurance | 4 | $201B |
|
||
| Consumer Goods | 4 | $87B |
|
||
| Industrial Machinery | 3 | $64B |
|
||
| Healthcare | 2 | $55B |
|
||
| Retail / Pharmacy | 1 | $148B |
|
||
| Agriculture / Food | 1 | $86B |
|
||
Price history
+61.5% since first listed3 events — show timeline
- 2026-06-17 Coming Soon $105,000 MARIS as Distributed by MLS Grid
- 2022-09-08 Sold (Public Records) $85,000 Public Records
- 2001-01-18 Sold (Public Records) $65,000 Public Records
Property tax history
+5.9%/yrLatest (2024): $2,001 · +5.3% YoY. Source: county tax records.
Cash-flow waterfall
monthlySold comps — $/sqft
last 12 mo · ≤1 miLoading sold comps…