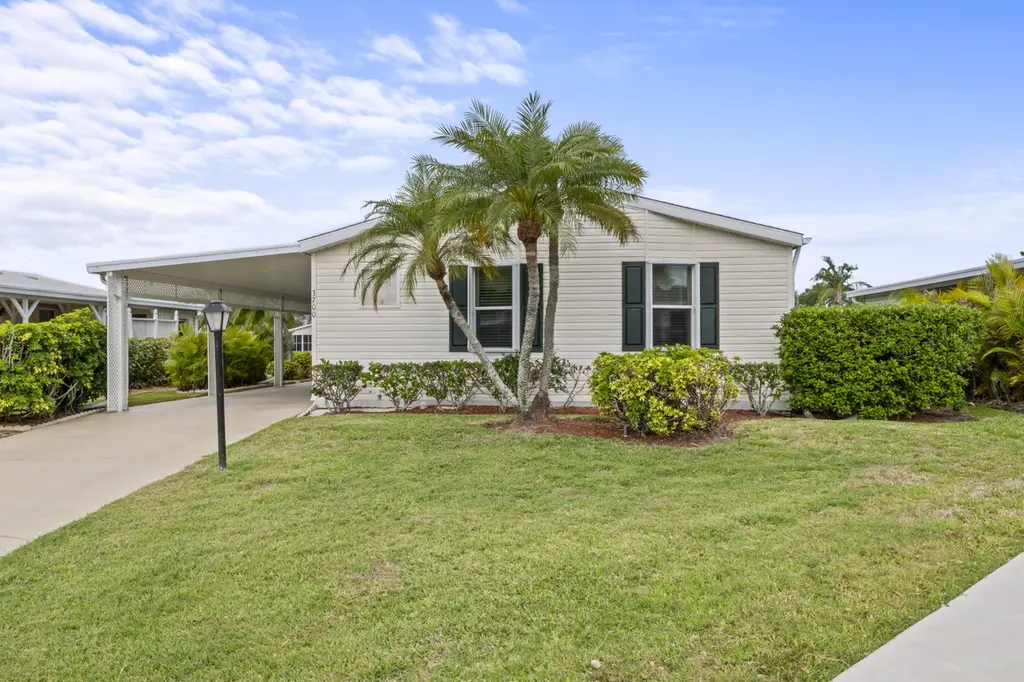
3700 Nimblewill Ct · Indian River Estates, FL
Flood risk 1/10 · Minimal
- FEMA flood zone
- X (unshaded)
- Chance of flooding over 30 yrs
- 0.0%
- Est. flood insurance / yr
- $507 – $1,088
Fire risk 5/10 · Moderate
- Est. fire insurance / yr
- $947 – $1,759
Heat risk 10/10 · Severe
- Hot days now (above 106°F)
- 7 days/yr
- Hot days in 30 yrs
- 24 days/yr
Wind risk 10/10 · Severe
- Chance of severe wind over 30 yrs
- 99.0%
Air-quality risk 2/10 · Minimal
- Unhealthy air days now
- 1 days/yr
- Unhealthy air days in 30 yrs
- 1 days/yr
Risk factors via First Street. Map © Google.
Why this score? — see what drove the B- grade
The composite is a weighted blend of 9 inputs, each scored 0–100. Each bar is that input's sub-score; the figure is the points it added to the 100-point composite (weight × sub-score).
- Cash flow +25.8/30.0
- ARV discount +13.3/15.0
- DSCR +8.6/10.0
- 1% rule +8.2/10.0
- Schools +3.7/10.0
- Livability +3.2/5.0
- Rent growth +3.0/5.0
- Condition / age +2.5/5.0
- Appreciation +0.0/10.0
$154,900
🖨 Deal sheet 📄 Offer letter ✓ Due diligence
Listing remarks
SELLER IS PUTTING A NEW ROOF ON!!! This well maintained home is being sold furnished. Spacious and inviting you are going to feel right at home. Enjoy your morning coffee in the relaxing Florida room while taking in the view of the lake. Accordian shutters throughout. The Islander model features 2 bedrooms , 2 baths with a den/office. Located in the desirable 55+ resort style community Savanna Club. This house was built for entertaining. It features a large kitchen island and an open floor plan. Large closets and tons of storage space including a separate shed. Savanna Club offers amenities that include a 18-hole golf course, 10,000 sq ft Performing Arts Center, Tennis & Fitness Cent
Key facts
- Large kitchen island
- Open floor plan
- Large closets
Tags
Property features AI
Finance
- Other: Senior community
- Financial info: Land lease required (monthly); Pets allowed with restrictions (breed restrictions, number limits, possible pet restrictions)
- HOA & community: Association: Savanna Club; Monthly HOA fee; Association amenities include clubhouse, pool (heated), spa/hot tub, fitness center, tennis courts, basketball court, shuffleboard, golf course/putting green, jogging path, billiards/game room, cafe/restaurant, business center, library, recreation facilities, management and on-site manager
Exterior
- Parking: 2 total parking spaces; Attached carport (1 covered space); Driveway; Concrete surface
- Security: Smoke detector(s)
- Utilities: Public water; Public sewer; Circuit breaker electric service; Cable available; Underground utilities; Water and sewer available
- Home design: Manufactured home (Double wide, Modular); Islander / Islander 3 model; Single-story (one level); Resale condition; Faces east
- Construction: Vinyl siding; Shingle/composition roof; Concrete perimeter foundation; Mobile dimensions approximately 60' x 38'
- Exterior features: Covered patio; Screened patio/porch; Porch; Storage structure; Property on a cul-de-sac; East of US-1 road frontage; Waterfront designation: Yes (no waterfront features listed)
Interior
- Kitchen: Electric range; Dishwasher; Microwave; Refrigerator; Kitchen island
- Bedrooms: 2 bedrooms on the main level
- Flooring: Carpet; Laminate
- Bathrooms: 2 full bathrooms on the main level
- Heating & cooling: Central electric heating; Central air conditioning; Ceiling fans
- Interior features: Cathedral ceilings; Entrance foyer; Kitchen island; Bedroom layout is stacked; Skylight(s); French doors; Furnished
- Laundry & utility: Washer hookup in unit; Washer/dryer hookups inside; Electric dryer hookup; Dedicated laundry room
Neighborhood map
What this means for you Summary
Snapshot
- This is a 2-bed/2.0-bath manufactured listed at $155k.
Deal economics
- At list price, monthly cash flow is $378 ($5k/yr) — positive.
- The deal already cash-flows at list — no discount required.
- Meets the 1% rule at list price ($2k rent vs $155k).
- Recommended offer: $150k (3.0% below list) — sets the bar for market timing.
- Cap rate 9.2% vs local median 5.3% in Indian River Estates — top-decile yield for the area; either an underpriced asset or a hidden risk that comps aren't pricing in. Stress-test before assuming the spread holds.
Location & tenants
- Location reads 65/100 on livability (#653 in FL) — a middle-class / working-renter tenant base. Strengths: cost of living A+, housing A+, crime B+; Watch: employment D+, schools F, amenities F.
- St. Lucie (urban): math 40% / reading 48% proficiency, ranked #51 of 73 in FL (top 70%) — families likely to look elsewhere, expect single-tenant / working-renter base with shorter leases.
- Market conditions: Rents rising (+1.9%/yr); 639 active listings in the ZIP; 8 comparable units currently listed for rent nearby; rentals at typical pace (median 14d on market — plan ~3-4 weeks tenant-placement turnaround); 4,868 units permitted in St. Lucie County in 2024 (268 in 5+ unit buildings).
- This rent runs 40% of the median local income ($62k/yr) — at the standard rent-burdened threshold; future hikes will face affordability resistance.
Forward outlook
- Local home prices are declining (-3.0%/yr); year-one equity from $1k of loan paydown is wiped out by about $5k of value loss. Plan a longer hold.
- St. Lucie County population projected at +20% by 2050 — long-run rental-demand tailwind backs the buy-and-hold thesis.
Negotiation context
- It's been on market 55 days — a 3% lower offer ($150k) is reasonable based on typical stale-listing flexibility.
- 7 sale attempts since 20y ago; this cycle's ask is 19% above the opening price — seller raised mid-cycle; expect resistance to lowballs.
Risks & watch-outs
- Climate carrying-cost: severe wind risk, 99% chance of damaging wind over 30y; moderate wildfire risk; extreme-heat days projected 7→24/yr by 2055 (HVAC capex compounding) — expect insurance premiums to compound above CPI over the hold.
Questions for the listing agent
- It's been on market 55 days. Have you received any prior offers? Is the seller open to a 3% concession, seller financing, or rate buy-down credit?
- What does the HOA fee cover, when was the last increase, and are there any pending special assessments or reserve-fund shortfalls?
- Is there a deadline driving the sale (1031 exchange, divorce, estate, relocation)? That informs how much negotiation room exists.
- Schools are F-rated, which usually means shorter tenancies and higher turnover. Who's the typical renter profile here, and what's been the actual vacancy rate?
- What's the average days-on-market for RENTAL listings here right now (not sales)? A rising rental-DOM trend means longer vacancies and softer asking-rent achievability than the comps imply.
- What's the recent tenant-quality profile in this submarket — average credit score on applications, eviction rate, late-payment / NSF rate, and stable-employment percentage? A property-management company in the area should have these aggregated.
- How much new for-sale + rental construction is in the pipeline within 1–3 miles? Heavy new supply typically softens prices + rents 12–24 months out; constrained supply supports both.
Investment metrics
- 1% rule
- 1.32% ✓
- Cap rate
- 9.22%
- Cash-on-cash
- 10.45%
- DSCR
- 1.46
- GRM
- 6.3
CMA / ARV
- ARV (on-the-fly)
- $177,944
- Comps found
- 12
Show comp detail 12 sales within ~0.75 mi
| Address | Dist | Beds/Ba | Sqft | Sold | Price | $/sf | Match |
|---|---|---|---|---|---|---|---|
| 7928 Meadowlark Ln | 0.08mi | 2/3.0 | 1,475 (-4%) | 1mo | $65,000 | $44 | 85 |
| 7728 Mcclintock Ct | 0.18mi | 2/2.0 | 1,692 (+10%) | 11mo | $185,000 | $109 | 65 |
| 7822 White Ibis Ln | 0.43mi | 3/2.0 (+1) | 1,612 (+5%) | 2mo | $115,000 | $71 | 65 |
| 3700 Westchester Ct | 0.49mi | 2/2.0 | 1,480 (-4%) | 8mo | $130,000 | $88 | 65 |
| 3720 Pebble Bch | 0.45mi | 3/2.0 (+1) | 1,608 (+5%) | 3mo | $225,000 | $140 | 63 |
| 3115 Palm Warbler Ct | 0.39mi | 2/2.0 | 1,429 (-7%) | 9mo | $140,000 | $98 | 63 |
| 3815 Sandlace Ct | 0.20mi | 3/2.0 (+1) | 1,641 (+7%) | 16mo | $190,000 | $116 | 60 |
| 3817 Sleepy Hollow Ln | 0.44mi | 2/2.0 | 1,390 (-9%) | 4mo | $260,000 | $187 | 60 |
| 8380 Gallberry Cir | 0.57mi | 2/2.0 | 1,527 (-0%) | 15mo | $278,000 | $182 | 60 |
| 3005 Approach Shot Way | 0.42mi | 2/2.0 | 1,333 (-13%) | 3mo | $149,900 | $112 | 56 |
| 8394 Delphinium Ct | 0.59mi | 3/2.0 (+1) | 1,392 (-9%) | 4mo | $220,000 | $158 | 49 |
| 8483 Labelia Ct | 0.68mi | 2/2.0 | 1,456 (-5%) | 15mo | $265,000 | $182 | 47 |
Match score weights: distance 35% · size 25% · config 20% · recency 20%. Top-matched comps best support the ARV.
Projected returns pro-forma
-3.0% appreciation · 1.92% rent growth · sell at horizon
- IRR
- -1.9%
- Equity multiple
- 0.93×
- Total profit
- $-3,120
- Equity at exit
- $23,096
- IRR
- 6.5%
- Equity multiple
- 1.46×
- Total profit
- $19,952
- Equity at exit
- $13,393
Cash invested: $43,372 (down + closing). Projections, not guarantees.
Landlord ↔ Tenant lean methodology
- Overall (STATE)
- 87 Strongly Landlord-Friendly
- State Florida
- 87 Strongly Landlord-Friendly · R+3
- County
- — inherits STATE
- City
- — inherits STATE
ZIP-level market 34952
- Home prices YoY
- -29.6%
- Rents YoY
- 1.9%
- Active inventory
- 639
- Price-to-rent
- 6.3×
Monthly cashflow live
- Estimated rent
- $2,051 high interval (Pro) →
- Mortgage (P&I)
- −$812
- Tax from tax record
- −$57 /mo · $681/yr
- Insurance
- −$65
- HOA
- −$309
- Vacancy / Maint / Mgmt
- −$431
- Net cashflow
- $378
Break-even live
UW: 25.0% down · 7.5% · 30yr · 1.5% tax · 5.0% vac · 8.0% maint · 8.0% mgmt
Financing live
Cash to close
- Down payment
- $38,725
- Closing costs
- $4,647
- Reserves months
- —
- Total cash needed
- —
Loan-product check · same deal, 3 products live
Conventional
25% down · 7.5% · 30yr
- Down + closing
- —
- Monthly P&I
- —
- Monthly cashflow
- —
- DSCR
- —
- Eligible?
- —
Personal DTI + credit; lowest rate.
DSCR
20% down · 8.5% · 30yr
- Down + closing
- —
- Monthly P&I
- —
- Monthly cashflow
- —
- DSCR
- —
- Eligible?
- —
No personal income docs; deal must DSCR.
Hard money
10% down · 12.0% · 12mo
- Down + closing
- —
- Monthly P&I
- —
- Monthly cashflow
- —
- DSCR
- —
- Eligible?
- —
Short-term bridge; refi at stabilization.
Rent comps 8 comps
| Address | Beds | Baths | Sqft | Rent | $/sqft | DOM | Units | Dist |
|---|---|---|---|---|---|---|---|---|
| 3784 Sapodilla Ct Port Saint Lucie, FL | 2.0 | 2.0 | 1121 | $2,300 | $2.05 | 23d | 1 | 0.71mi |
| 1900 Bella Vista Way Port Saint Lucie, FL | 1.0–2.0 | 1.0–2.0 | 995 | $1,764 | $1.77 | 14d | 15 | 1.26mi |
| 71 W Caribbean Port St. Lucie, FL | 2.0 | 2.0 | 1417 | $1,700 | $1.20 | 23d | 1 | 1.29mi |
| 2209 SE East Dunbrooke Cir Port Saint Lucie, FL | 3.0 | 2.0 | 1212 | $2,950 | $2.43 | 14d | 1 | 1.33mi |
| 2183 SE Wild Meadow Cir Port Saint Lucie, FL | 2.0 | 2.0 | 1550 | $1,900 | $1.23 | 14d | 1 | 1.43mi |
| 2130 SE Wild Meadow Cir Port Saint Lucie, FL | 2.0 | 2.0 | 1440 | $1,695 | $1.18 | 14d | 1 | 1.47mi |
| 2058 SE Wild Meadow Cir #101 Port St Lucie, FL | 2.0 | 2.5 | 1425 | $2,200 | $1.54 | 14d | 1 | 1.48mi |
| 2082 SE Wild Meadow Cir Port Saint Lucie, FL | 2.0 | 2.0 | 1524 | $1,850 | $1.21 | 23d | 1 | 1.49mi |
HOA detail
- Monthly dues
- $309 · $3,708/yr
Listing history 30 events
-
2026-06-18days on market $154,900 Active 55 DOM
-
2026-06-17days on market $154,900 Active 54 DOM
-
2026-06-16days on market $154,900 Active 53 DOM
-
2026-06-15days on market $154,900 Active 52 DOM
-
2026-06-14days on market $154,900 Active 50 DOM
-
2026-06-13days on market $154,900 Active 49 DOM
-
2026-06-10days on market $154,900 Active 47 DOM
-
2026-06-09days on market $154,900 Active 46 DOM
-
2026-06-08days on market $154,900 Active 45 DOM
-
2026-06-07days on market $154,900 Active 44 DOM
-
2026-06-05days on market $154,900 Active 41 DOM
-
2026-06-03days on market $154,900 Active 40 DOM
-
2026-06-02days on market $154,900 Active 39 DOM
-
2026-06-01days on market $154,900 Active 38 DOM
-
2026-05-31days on market $154,900 Active 37 DOM
-
2026-05-30days on market $154,900 Active 36 DOM
-
2026-05-16status Active
-
2026-05-11historical Active Under Contract
-
2026-04-24$129,900 Active
-
2016-08-10historical
-
2016-06-23$98,900 Active
-
2016-06-23historical
-
2016-06-23$98,900
-
2015-02-05historical
-
2015-02-05historical
-
2014-10-18historical
-
2010-11-05$102,500
-
2008-11-04$112,000
-
2006-03-13$179,900
-
2003-12-08soldstatus $8,500,000
ⓘ Source: listings_history table (triggers on properties + properties_extension) + one-shot
backfill from property_details.listing_events for pre-trigger history.
Tax reassessment forecast FL · Resets to sale price
- Current annual tax
- $681 · $57/mo
- Projected year-2 tax
- $1,286 · $107/mo
- Expected delta
- +$604/yr (+$50/mo · 88.7%)
ⓘ Screening estimate from a state-policy table — verify with the county assessor before closing.
Climate risk First Street
- Flood 1/10 Low FEMA zone X (unshaded) · 0% chance over 30 yrs
- Wildfire 5/10 Major
- Heat 10/10 Extreme 7 d/yr ≥106°F today · 24 d/yr by 30 yrs out
- Wind 10/10 Extreme 99% chance of damaging wind over 30 yrs
- Air quality 2/10 Low 1 unhealthy d/yr today · 1 by 30 yrs out
Nearby sold comps map
Loading sold comps map…
Walkable amenities ~0.75 mi
Loading nearby amenities…
Taxation est. · year 1
- Rental income
- $24,611
- − Mortgage interest
- −$8,677
- − Property taxes
- −$681
- − Insurance
- −$774
- − Repairs & maintenance
- −$1,969
- − Management
- −$1,969
- − HOA
- −$3,708
- − Depreciation
- −$4,506
- Taxable income
- $2,326
- Est. tax owed @ 24.0%
- −$558
- After-tax cash flow
- $3,973/yr
For passive investors: Depreciation is non-cash, so a rental often shows a tax loss while cash-flowing — sheltering income. Rental losses are passive: they offset passive income freely, and up to $25,000/yr can offset ordinary (W-2) income if you actively participate and your MAGI is under $100k (phasing out to $0 by $150k); unused losses carry forward. On sale, claimed depreciation is recaptured at up to 25%, and gains may owe capital-gains tax (a 1031 exchange can defer both). Figures are a year-1 estimate at your 24.0% rate — not tax advice; consult a CPA.
Schools (NCES district)
- District
- St. Lucie
- NCES district ID
- 1201770
- Math proficiency
- 40% ▼ -11.00%
- Reading proficiency
- 48% ▼ -4.00%
- Median HH income
- $44,737
- Composite
- 37.28/100
- National rank
- #4449
- State rank
- #51 of 73 in FL
Livability — Indian River Estates
- Score
- 65/100
- State rank
- #653
- US rank
- #12946
Category grades
Schools grade is shown separately in the Schools card above.
Census & demographics
- County
- Saint Lucie County · 337,150 people
- City population
- 27,447
- Metro
- Port St. Lucie, FL
- Population (ZIP)
- 42,655
- Household income
- $61,628
- Rent vs Own
- Severe rent burden
- 1759.0
Population outlook (St. Lucie County) Hauer SSP2
- Today (2025)
- 338,016 people
- By 2030
- 355,687 · +5.2%
- By 2040
- 385,521 · +14.1%
- By 2050
- 406,106 · +20.1%
- By 2075
- 441,054 · +30.5%
- By 2100
- 436,885 · +29.2%
Race, ethnicity, and origin ACS 2023
- Neighborhood character
- Diverse neighborhood (Simpson 0.57)
- Race & ethnicity
- White 62% Hispanic / Latino 19% Two or more races 14% Black 10% Asian 3%
- Hispanic origin (detail)
- Mexican 4% Puerto Rican 4% Cuban 2% Dominican 2%
- Common ancestry
- Romanian 3% Lithuanian 2% Hispanic 1%
- Foreign-born
- 18% · Canada, Jamaica, China
- Languages at home
- 76% English-only · Spanish 16% French/Haitian/Cajun 3% Tagalog/Filipino 2%
Political lean MEDSL · St. Lucie
- 2024 margin
- Lean R (+9.1) · D 45.1% · R 54.2%
- 2008→2024 swing
- -21.2pp toward R · 2008: 12.1pp · 2024: -9.1pp
- All cycles
- 2024: R+9.1 2020: R+1.6 2016: R+2.5 2012: D+7.9 2008: D+12.1
Not yet ingested
- Civics
- —
Market trends
- HPI YoY
- ▼ -155.80%
- Current HPI
- 371.0573
- Rent YoY
- ▲ 1.92%
- Metro
- Port St. Lucie, FL
- State GDP YoY
- ▲ 3.28%
- F500 in state
- 36
Industry mix (Fortune 500 HQ in FL)
| Industry | F500 HQs | Revenue |
|---|---|---|
| Industrial Technology | 2 | $29B |
|
||
| Insurance | 2 | $17B |
|
||
| Retail | 1 | $60B |
|
||
| Technology Distribution | 1 | $58B |
|
||
| Homebuilding | 1 | $35B |
|
||
| Technology Manufacturing | 1 | $35B |
|
||
Price history
-98.5% since first listed14 events — show timeline
- 2026-05-16 Relisted — Beaches MLS
- 2026-05-11 Contingent — Beaches MLS
- 2026-04-24 Listed $129,900 Beaches MLS
- 2016-08-10 Listing Removed — Beaches MLS
- 2016-06-23 Listed $98,900 Beaches MLS
- 2016-06-23 Listed $98,900 Beaches MLS
- 2016-06-23 Listing Removed — Beaches MLS
- 2015-02-05 Listing Removed — Beaches MLS
- 2015-02-05 Listing Removed — Beaches MLS
- 2014-10-18 Listing Removed — Beaches MLS
- 2010-11-05 Listed $102,500 Beaches MLS
- 2008-11-04 Listed $112,000 Beaches MLS
- 2006-03-13 Listed $179,900 Beaches MLS
- 2003-12-08 Sold (Public Records) $8,500,000 Public Records
Property tax history
+1.3%/yrLatest (2025): $681 · +5.3% YoY. Source: county tax records.
Cash-flow waterfall
monthlySold comps — $/sqft
last 12 mo · ≤1 miLoading sold comps…