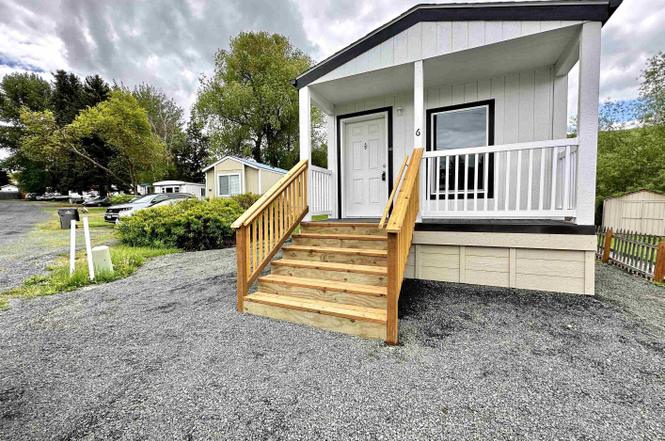
1025 Eid Rd #6 Rd · Moscow, ID
Flood risk 9/10 · Severe
- FEMA flood zone
- X
- Chance of flooding over 30 yrs
- 0.99%
- Est. flood insurance / yr
- $507 – $1,088
Fire risk 5/10 · Moderate
- Est. fire insurance / yr
- $584 – $1,086
Heat risk 2/10 · Minimal
- Hot days now (above 91°F)
- 7 days/yr
- Hot days in 30 yrs
- 15 days/yr
Wind risk 1/10 · Minimal
- Chance of severe wind over 30 yrs
- —
Air-quality risk 8/10 · Major
- Unhealthy air days now
- 11 days/yr
- Unhealthy air days in 30 yrs
- 12 days/yr
Risk factors via First Street. Map © Google.
Why this score? — see what drove the C grade
The composite is a weighted blend of 9 inputs, each scored 0–100. Each bar is that input's sub-score; the figure is the points it added to the 100-point composite (weight × sub-score).
- Cash flow +20.2/30.0
- ARV discount +7.5/15.0
- DSCR +6.4/10.0
- 1% rule +5.4/10.0
- Rent growth +4.8/5.0
- Schools +4.7/10.0
- Livability +4.4/5.0
- Condition / age +2.5/5.0
- Appreciation +0.0/10.0
$89,900
🖨 Deal sheet 📄 Offer letter ✓ Due diligence
Listing remarks MLS
New roof in 2012. Lot rent of $185/mo includes water, sewer, and snow removal. Buyer must be approved by Hidden Valley management. No dogs allowed.
Key facts
- Vinyl wood flooring
- Electric forced heat
- Laundry area
Tags
Property features AI
Finance
- Other: Located in a mobile home park
Exterior
- Utilities: Community water service; Sewer connected
- Home design: Mobile/manufactured home on a rented lot; New construction (built 2025)
- Construction: Wood siding; Composition roof; Built in 2025
- Exterior features: Covered patio/deck
Interior
- Kitchen: Dishwasher; Electric oven/range (freestanding); Refrigerator
- Bedrooms: 2 bedrooms (both on the main level)
- Flooring: Vinyl
- Bathrooms: 1 bathroom
- Heating & cooling: Electric forced air heating; No central cooling
- Interior features: Laminate counters
- Laundry & utility: Electric water heater
Neighborhood map
What this means for you Summary
Snapshot
- This is a 2-bed/1.0-bath manufactured listed at $90k.
Deal economics
- At list price, monthly cash flow is $48 ($571/yr) — positive.
- The deal already cash-flows at list — no discount required.
- Meets the 1% rule at list price ($931 rent vs $90k).
- Recommended offer: $79k (12.0% below list) — sets the bar for market timing.
- Cap rate 7.8% vs local median 1.1% in Moscow — top-decile yield for the area; either an underpriced asset or a hidden risk that comps aren't pricing in. Stress-test before assuming the spread holds.
Location & tenants
- Location reads 87/100 on livability (#2 in ID, #273 nationally) — a professional / high-income tenant draw. Strengths: crime A+, amenities A+, commute A+; Watch: employment F.
- Moscow District (town): math 47% / reading 67% proficiency, ranked #17 of 92 in ID (top 18%) — acceptable for families but not a draw, mixed tenant base, ~2y average lease.
- Zoned schools: West Park Elementary School (173 students, 44% FRL); Moscow High School (math 47% / reading 77%, grade B-, #16 of 169 statewide, top 10%, 769 students, 16% FRL) — zoned schools at 30% FRL track the district average.
- Market conditions: Rents rising fast (+9.0%/yr); 166 active listings in the ZIP; 199 units permitted in Latah County in 2024 (72 in 5+ unit buildings).
Forward outlook
- Local home prices are declining (-3.0%/yr); year-one equity from $622 of loan paydown is wiped out by about $3k of value loss. Plan a longer hold.
- Latah County population projected at +29% by 2050 — long-run rental-demand tailwind backs the buy-and-hold thesis.
- At projected returns (-3.0% appreciation + 8.0% rent growth), your $25k cash investment doubles in ~10 years — after that, you're playing with house money.
Negotiation context
- It's been on market 137 days — a 12% lower offer ($79k) is reasonable based on typical stale-listing flexibility.
- 8 sale attempts since 18y ago with the ask held roughly flat each time — persistent listings suggest the price (not the market) is what's stuck; bring a comps-based counter.
Risks & watch-outs
- Watch-outs: flood insurance adds $66/mo.
- Climate carrying-cost: severe flood risk; moderate wildfire risk — expect insurance premiums to compound above CPI over the hold.
Questions for the listing agent
- It's been on market 137 days. Have you received any prior offers? Is the seller open to a 12% concession, seller financing, or rate buy-down credit?
- What's the actual annual flood-insurance premium (NFIP or private), and is the property in a SFHA with mandatory coverage?
- Why hasn't it sold? Are there any deal-killer items the seller is aware of (foundation, flood, title, zoning, code violations)?
- Is there a deadline driving the sale (1031 exchange, divorce, estate, relocation)? That informs how much negotiation room exists.
- Schools are A-rated — typically a magnet for longer-tenancy family renters. What's the average tenant stay here, and is there a school-zone premium baked into asking?
- What's the average days-on-market for RENTAL listings here right now (not sales)? A rising rental-DOM trend means longer vacancies and softer asking-rent achievability than the comps imply.
- What's the recent tenant-quality profile in this submarket — average credit score on applications, eviction rate, late-payment / NSF rate, and stable-employment percentage? A property-management company in the area should have these aggregated.
- How much new for-sale + rental construction is in the pipeline within 1–3 miles? Heavy new supply typically softens prices + rents 12–24 months out; constrained supply supports both.
Investment metrics
- 1% rule
- 1.04% ✓
- Cap rate
- 7.81%
- Cash-on-cash
- 5.43%
- DSCR
- 1.24
- GRM
- 8.0
CMA / ARV
- ARV (on-the-fly)
- $23,872
- Comps found
- 1
Show comp detail 1 sale within ~0.75 mi
| Address | Dist | Beds/Ba | Sqft | Sold | Price | $/sf | Match |
|---|---|---|---|---|---|---|---|
| 1025 Eid Rd #3 | 0.05mi | 2/1.0 | 784 (+5%) | 15mo | $24,950 | $32 | 76 |
Match score weights: distance 35% · size 25% · config 20% · recency 20%. Top-matched comps best support the ARV.
Projected returns pro-forma
-3.0% appreciation · 8.0% rent growth · sell at horizon
- IRR
- -6.7%
- Equity multiple
- 0.74×
- Total profit
- $-6,566
- Equity at exit
- $13,404
- IRR
- 8.7%
- Equity multiple
- 1.83×
- Total profit
- $20,792
- Equity at exit
- $7,773
Cash invested: $25,172 (down + closing). Projections, not guarantees.
Landlord ↔ Tenant lean methodology
- Overall (STATE)
- 91 Strongly Landlord-Friendly
- State Idaho
- 91 Strongly Landlord-Friendly · R+18
- County
- — inherits STATE
- City
- — inherits STATE
ZIP-level market 83843
- Rents YoY
- 9.0%
- Active inventory
- 166
- Price-to-rent
- 8.0×
Monthly cashflow live
- Estimated rent
- $931 medium interval (Pro) →
- Mortgage (P&I)
- −$471
- Tax est. 1.5%
- −$112 /mo · $1,348/yr
- Insurance
- −$37
- Flood insurance flood zone
- −$66 /mo · $798/yr
- HOA
- −$0
- Vacancy / Maint / Mgmt
- −$195
- Net cashflow
- $48
Break-even live
UW: 25.0% down · 7.5% · 30yr · 1.5% tax · 5.0% vac · 8.0% maint · 8.0% mgmt
Financing live
Cash to close
- Down payment
- $22,475
- Closing costs
- $2,697
- Reserves months
- —
- Total cash needed
- —
Loan-product check · same deal, 3 products live
Conventional
25% down · 7.5% · 30yr
- Down + closing
- —
- Monthly P&I
- —
- Monthly cashflow
- —
- DSCR
- —
- Eligible?
- —
Personal DTI + credit; lowest rate.
DSCR
20% down · 8.5% · 30yr
- Down + closing
- —
- Monthly P&I
- —
- Monthly cashflow
- —
- DSCR
- —
- Eligible?
- —
No personal income docs; deal must DSCR.
Hard money
10% down · 12.0% · 12mo
- Down + closing
- —
- Monthly P&I
- —
- Monthly cashflow
- —
- DSCR
- —
- Eligible?
- —
Short-term bridge; refi at stabilization.
Listing history 31 events
-
2026-06-19days on market $89,900 Active 137 DOM
-
2026-06-18days on market $89,900 Active 136 DOM
-
2026-06-17days on market $89,900 Active 135 DOM
-
2026-06-16days on market $89,900 Active 134 DOM
-
2026-06-15days on market $89,900 Active 133 DOM
-
2026-06-14days on market $89,900 Active 131 DOM
-
2026-06-12days on market $89,900 Active 130 DOM
-
2026-06-09days on market $89,900 Active 127 DOM
-
2026-06-08days on market $89,900 Active 126 DOM
-
2026-06-07days on market $89,900 Active 125 DOM
-
2026-06-07days on market $89,900 Active 124 DOM
-
2026-06-02days on market $89,900 Active 120 DOM
-
2026-06-01days on market $89,900 Active 119 DOM
-
2026-05-31days on market $89,900 Active 118 DOM
-
2026-05-30days on market $89,900 Active 117 DOM
-
2026-05-06price $89,900
-
2026-02-01$92,499 Active
-
2026-01-22historical
-
2025-09-25price $93,999
-
2025-08-18price $97,000
-
2025-06-12$99,500 Active
-
2014-02-24soldstatus 147-char remark
Show marketing remark (147 chars)
New roof in 2012. Lot rent of $185/mo includes water, sewer, and snow removal. Buyer must be approved by Hidden Valley management. No dogs allowed.
-
2013-07-22$16,500
-
2013-06-26$22,000 147-char remark
Show marketing remark (147 chars)
New roof in 2012. Lot rent of $185/mo includes water, sewer, and snow removal. Buyer must be approved by Hidden Valley management. No dogs allowed.
-
2012-08-20soldstatus
-
2012-05-29$22,000
-
2011-10-03soldstatus
-
2011-07-06$15,000
-
2011-05-11$26,500
-
2008-02-22soldstatus
-
2008-01-28$24,000
ⓘ Source: listings_history table (triggers on properties + properties_extension) + one-shot
backfill from property_details.listing_events for pre-trigger history.
Climate risk First Street
- Flood 9/10 Extreme FEMA zone X · 99% chance over 30 yrs
- Wildfire 5/10 Major
- Heat 2/10 Low 7 d/yr ≥91°F today · 15 d/yr by 30 yrs out
- Wind 1/10 Low
- Air quality 8/10 Severe 11 unhealthy d/yr today · 12 by 30 yrs out
Nearby sold comps map
Loading sold comps map…
Walkable amenities ~0.75 mi
Loading nearby amenities…
Taxation est. · year 1
- Rental income
- $11,169
- − Mortgage interest
- −$5,036
- − Property taxes
- −$1,348
- − Insurance
- −$1,247
- − Repairs & maintenance
- −$894
- − Management
- −$894
- − Depreciation
- −$2,615
- Taxable loss
- −$865
- Est. tax savings @ 24.0%
- +$208
- After-tax cash flow
- $778/yr
For passive investors: Depreciation is non-cash, so a rental often shows a tax loss while cash-flowing — sheltering income. Rental losses are passive: they offset passive income freely, and up to $25,000/yr can offset ordinary (W-2) income if you actively participate and your MAGI is under $100k (phasing out to $0 by $150k); unused losses carry forward. On sale, claimed depreciation is recaptured at up to 25%, and gains may owe capital-gains tax (a 1031 exchange can defer both). Figures are a year-1 estimate at your 24.0% rate — not tax advice; consult a CPA.
Schools (NCES district)
- District
- Moscow District
- NCES district ID
- 1602220
- Math proficiency
- 47% ▼ -9.00%
- Reading proficiency
- 67% ▼ -1.00%
- Median HH income
- $35,830
- Composite
- 47.16/100
- National rank
- #2325
- State rank
- #17 of 92 in ID
Livability — Moscow
- Score
- 87/100
- State rank
- #2
- US rank
- #273
Category grades
Schools grade is shown separately in the Schools card above.
Census & demographics
- County
- Latah County · 26,591 people
- City population
- 26,591
- Metro
- Moscow, ID
- Population (ZIP)
- 26,591
- Household income
- $59,444
- Rent vs Own
- Severe rent burden
- 1820.0
Population outlook (Latah County) Hauer SSP2
- Today (2025)
- 43,011 people
- By 2030
- 45,407 · +5.6%
- By 2040
- 50,095 · +16.5%
- By 2050
- 55,480 · +29.0%
- By 2075
- 71,675 · +66.6%
- By 2100
- 88,307 · +105.3%
Race, ethnicity, and origin ACS 2023
- Neighborhood character
- Predominantly White (84%)
- Race & ethnicity
- White 84% Two or more races 7% Hispanic / Latino 5% Asian 3% Black 1%
- Common ancestry
- Portuguese 4% Slovak 3% Italian 2%
- Foreign-born
- 5% · Canada, South Korea, China
- Languages at home
- 93% English-only · Spanish 2% Other Asian/Pacific 1% Other Indo-European 1%
Political lean MEDSL · Latah
- 2024 margin
- Lean R (+8.0) · D 44.2% · R 52.2% · Other 3.6%
- 2008→2024 swing
- -14.8pp toward R · 2008: 6.8pp · 2024: -8.0pp
- All cycles
- 2024: R+8.0 2020: D+3.7 2016: D+4.6 2012: D+4.3 2008: D+6.8
Not yet ingested
- Civics
- —
Market trends
- HPI YoY
- ▼ -217.31%
- Current HPI
- 184.9851
- Rent YoY
- ▲ 9.04%
- Metro
- Moscow, ID
- State GDP YoY
- ▲ 4.51%
- F500 in state
- 6
Industry mix (Fortune 500 HQ in ID)
| Industry | F500 HQs | Revenue |
|---|---|---|
| Retail | 1 | $79B |
|
||
| Technology | 1 | $25B |
|
||
| Food / Agriculture | 1 | $6B |
|
||
Price history
+274.6% since first listed16 events — show timeline
- 2026-05-06 Price Changed $89,900 IMLS
- 2026-02-01 Listed $92,499 IMLS
- 2026-01-22 Listing Removed — IMLS
- 2025-09-25 Price Changed $93,999 IMLS
- 2025-08-18 Price Changed $97,000 IMLS
- 2025-06-12 Listed $99,500 IMLS
- 2014-02-24 Sold (MLS) — IMLS
- 2013-07-22 Listed $16,500 IMLS
- 2013-06-26 Listed $22,000 IMLS
- 2012-08-20 Sold (MLS) — IMLS
- 2012-05-29 Listed $22,000 IMLS
- 2011-10-03 Sold (MLS) — IMLS
- 2011-07-06 Listed $15,000 IMLS
- 2011-05-11 Listed $26,500 IMLS
- 2008-02-22 Sold (MLS) — IMLS
- 2008-01-28 Listed $24,000 IMLS
Cash-flow waterfall
monthlySold comps — $/sqft
last 12 mo · ≤1 miLoading sold comps…