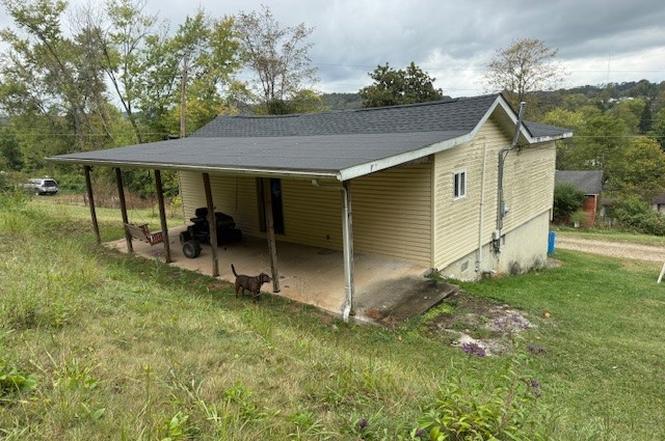
418 Kanawha St · St. Albans, WV
Flood risk No data
- FEMA flood zone
- —
- Chance of flooding over 30 yrs
- —
- Est. flood insurance / yr
- —
Fire risk No data
- Est. fire insurance / yr
- —
Heat risk No data
- Hot days now (above threshold)
- —
- Hot days in 30 yrs
- —
Wind risk No data
- Chance of severe wind over 30 yrs
- —
Air-quality risk No data
- Unhealthy air days now
- —
- Unhealthy air days in 30 yrs
- —
Risk factors via First Street. Map © Google.
Why this score? — see what drove the B- grade
The composite is a weighted blend of 9 inputs, each scored 0–100. Each bar is that input's sub-score; the figure is the points it added to the 100-point composite (weight × sub-score).
- Cash flow +30.0/30.0
- 1% rule +10.0/10.0
- DSCR +10.0/10.0
- ARV discount +7.5/15.0
- Schools +2.9/10.0
- Rent growth +2.5/5.0
- Livability +2.5/5.0
- Condition / age +2.5/5.0
- Appreciation +0.0/10.0
$27,000
🖨 Deal sheet 📄 Offer letter ✓ Due diligence
Listing remarks
Seller intends to take all appliances and furnishings. 1 bedroom, 1 full bath with a full basement. Plenty of room for two bedrooms in the basement. Being sold as is. Cash Only. Seller needs 30 days to move things after a contract is signed. Seller plans to move everything out of the house.
Key facts
- 0.31 acre lot
- Built 1946
- Listed 102 days
Neighborhood map
What this means for you Summary
Snapshot
- This is a 2-bed/1.0-bath single-family listed at $27k.
Deal economics
- At list price, monthly cash flow is $532 ($6k/yr) — positive.
- The deal already cash-flows at list — no discount required.
- Meets the 1% rule at list price ($884 rent vs $27k).
- Recommended offer: $25k (9.0% below list) — sets the bar for market timing.
- Cap rate 29.9% vs local median 4.9% in St. Albans — top-decile yield for the area; either an underpriced asset or a hidden risk that comps aren't pricing in. Stress-test before assuming the spread holds.
Location & tenants
- Location reads: area grade B — affects rentability + tenant quality, not the cash-flow math above.
- Kanawha County Schools (suburban): math 29% / reading 40% proficiency, ranked #17 of 55 in WV (top 31%) — families likely to look elsewhere, expect single-tenant / working-renter base with shorter leases.
- Zoned schools: Andrews Heights Elementary School (math 32% / reading 37%, grade F, #148 of 377 statewide, top 49%, 263 students, 0% FRL); Hayes Middle School (math 24% / reading 39%, grade F, #52 of 109 statewide, top 49%, 436 students, 0% FRL); Saint Albans High School (math 32% / reading 57%, grade F, #11 of 110 statewide, top 11%, 993 students, 0% FRL) — zoned schools average 0% FRL vs 46% district-wide (46 pts lower); this property's tenant base skews higher-income than the district average.
- Market conditions: 116 active listings in the ZIP; 103 units permitted in Kanawha County in 2024 (0 in 5+ unit buildings).
Forward outlook
- Local home prices are declining (-3.0%/yr); year-one equity from $187 of loan paydown is wiped out by about $810 of value loss. Plan a longer hold.
- Kanawha County population projected at -17% by 2050 — secular population decline; favor cash flow + early exit over multi-decade hold.
- At projected returns (-3.0% appreciation + 3.0% rent growth), your $8k cash investment doubles in ~2 years — after that, you're playing with house money.
Negotiation context
- It's been on market 102 days — a 9% lower offer ($25k) is reasonable based on typical stale-listing flexibility.
- 2 sale attempts since 11y ago; this cycle's ask has dropped $100k (79%) from the opening price — seller is motivated, your offer sets the floor, not the list.
Risks & watch-outs
- Watch-outs: built in 1946 — expect roof / HVAC / electrical / plumbing capex.
Questions for the listing agent
- It's been on market 102 days. Have you received any prior offers? Is the seller open to a 9% concession, seller financing, or rate buy-down credit?
- Built in 1946 — when were the roof, HVAC, electrical panel, plumbing, and water heater last replaced?
- Why hasn't it sold? Are there any deal-killer items the seller is aware of (foundation, flood, title, zoning, code violations)?
- Is there a deadline driving the sale (1031 exchange, divorce, estate, relocation)? That informs how much negotiation room exists.
- What's the average days-on-market for RENTAL listings here right now (not sales)? A rising rental-DOM trend means longer vacancies and softer asking-rent achievability than the comps imply.
- What's the recent tenant-quality profile in this submarket — average credit score on applications, eviction rate, late-payment / NSF rate, and stable-employment percentage? A property-management company in the area should have these aggregated.
- How much new for-sale + rental construction is in the pipeline within 1–3 miles? Heavy new supply typically softens prices + rents 12–24 months out; constrained supply supports both.
Investment metrics
- 1% rule
- 3.28% ✓
- Cap rate
- 29.92%
- Cash-on-cash
- 84.39%
- DSCR
- 4.76
- GRM
- 2.5
CMA / ARV
- ARV (on-the-fly)
- $108,593
- Comps found
- 8
Show comp detail 8 sales within ~0.75 mi
| Address | Dist | Beds/Ba | Sqft | Sold | Price | $/sf | Match |
|---|---|---|---|---|---|---|---|
| 414 Lore Street St | 0.22mi | 3/1.0 (+1) | 1,000 (+4%) | 4mo | $130,000 | $130 | 74 |
| 300 Hill St | 0.17mi | 3/1.0 (+1) | 932 (-3%) | 14mo | $20,000 | $21 | 71 |
| 412 Kanawha St | 0.04mi | 3/1.0 (+1) | 1,040 (+8%) | 14mo | $110,000 | $106 | 67 |
| 110 Carte St | 0.13mi | 2/1.0 | 1,077 (+12%) | 21mo | $121,540 | $113 | 56 |
| 11861 Coal River Rd | 0.64mi | 2/1.0 | 1,054 (+10%) | 8mo | $80,000 | $76 | 47 |
| 71 Maple Ln | 0.57mi | 2/1.0 | 1,092 (+14%) | 6mo | $130,900 | $120 | 45 |
| 310 High St | 0.50mi | 3/2.0 (+1) | 1,060 (+10%) | 22mo | $150,000 | $142 | 32 |
| 1131 Strawberry Rd | 0.73mi | 3/1.0 (+1) | 1,040 (+8%) | 18mo | $35,000 | $34 | 32 |
Match score weights: distance 35% · size 25% · config 20% · recency 20%. Top-matched comps best support the ARV.
Projected returns pro-forma
-3.0% appreciation · 3.0% rent growth · sell at horizon
- IRR
- 84.8%
- Equity multiple
- 4.90×
- Total profit
- $29,489
- Equity at exit
- $4,026
- IRR
- 88.0%
- Equity multiple
- 10.17×
- Total profit
- $69,288
- Equity at exit
- $2,334
Cash invested: $7,560 (down + closing). Projections, not guarantees.
Landlord ↔ Tenant lean methodology
- Overall (STATE)
- 83 Strongly Landlord-Friendly
- State West Virginia
- 83 Strongly Landlord-Friendly · R+22
- County
- — inherits STATE
- City
- — inherits STATE
ZIP-level market 25177
- Home prices YoY
- -16.6%
- Active inventory
- 116
- Price-to-rent
- 2.5×
Monthly cashflow live
- Estimated rent
- $884 medium interval (Pro) →
- Mortgage (P&I)
- −$142
- Tax from tax record
- −$14 /mo · $169/yr
- Insurance
- −$11
- HOA
- −$0
- Vacancy / Maint / Mgmt
- −$186
- Net cashflow
- $532
Break-even live
UW: 25.0% down · 7.5% · 30yr · 1.5% tax · 5.0% vac · 8.0% maint · 8.0% mgmt
Financing live
Cash to close
- Down payment
- $6,750
- Closing costs
- $810
- Reserves months
- —
- Total cash needed
- —
Loan-product check · same deal, 3 products live
Conventional
25% down · 7.5% · 30yr
- Down + closing
- —
- Monthly P&I
- —
- Monthly cashflow
- —
- DSCR
- —
- Eligible?
- —
Personal DTI + credit; lowest rate.
DSCR
20% down · 8.5% · 30yr
- Down + closing
- —
- Monthly P&I
- —
- Monthly cashflow
- —
- DSCR
- —
- Eligible?
- —
No personal income docs; deal must DSCR.
Hard money
10% down · 12.0% · 12mo
- Down + closing
- —
- Monthly P&I
- —
- Monthly cashflow
- —
- DSCR
- —
- Eligible?
- —
Short-term bridge; refi at stabilization.
Listing history 4 events
-
2026-01-05status Pending
-
2025-10-31price $27,000
-
2025-09-25$127,000 Active
-
2015-11-10$58,000
ⓘ Source: listings_history table (triggers on properties + properties_extension) + one-shot
backfill from property_details.listing_events for pre-trigger history.
Tax reassessment forecast WV · Resets to sale price
- Current annual tax
- $169 · $14/mo
- Projected year-2 tax
- $169 · $14/mo
- Expected delta
- $0/yr ($0/mo · 0.0%)
ⓘ Screening estimate from a state-policy table — verify with the county assessor before closing.
Nearby sold comps map
Loading sold comps map…
Walkable amenities ~0.75 mi
Loading nearby amenities…
Taxation est. · year 1
- Rental income
- $10,612
- − Mortgage interest
- −$1,512
- − Property taxes
- −$169
- − Insurance
- −$135
- − Repairs & maintenance
- −$849
- − Management
- −$849
- − Depreciation
- −$785
- Taxable income
- $6,312
- Est. tax owed @ 24.0%
- −$1,515
- After-tax cash flow
- $4,865/yr
For passive investors: Depreciation is non-cash, so a rental often shows a tax loss while cash-flowing — sheltering income. Rental losses are passive: they offset passive income freely, and up to $25,000/yr can offset ordinary (W-2) income if you actively participate and your MAGI is under $100k (phasing out to $0 by $150k); unused losses carry forward. On sale, claimed depreciation is recaptured at up to 25%, and gains may owe capital-gains tax (a 1031 exchange can defer both). Figures are a year-1 estimate at your 24.0% rate — not tax advice; consult a CPA.
Schools (NCES district)
- District
- Kanawha County Schools
- NCES district ID
- 5400600
- Math proficiency
- 29% ▼ -13.00%
- Reading proficiency
- 40% ▼ -7.00%
- Median HH income
- $44,329
- Composite
- 29.35/100
- National rank
- #6540
- State rank
- #17 of 55 in WV
Livability — St. Albans
No livability data for this city. (Only ~50 U.S. cities are tracked.)
Census & demographics
- City population
- 23,211
- Population (ZIP)
- 23,211
Population outlook (Kanawha County) Hauer SSP2
- Today (2025)
- 178,946 people
- By 2030
- 172,906 · -3.4%
- By 2040
- 159,874 · -10.7%
- By 2050
- 148,148 · -17.2%
- By 2075
- 123,257 · -31.1%
- By 2100
- 96,454 · -46.1%
Race, ethnicity, and origin ACS 2023
- Neighborhood character
- Predominantly White (89%)
- Race & ethnicity
- White 89% Two or more races 5% Black 5% Hispanic / Latino 1%
- Common ancestry
- Serbian 2% Italian 2% Slovak 1%
- Foreign-born
- 0%
Political lean MEDSL · Kanawha
- 2024 margin
- R (+17.4) · D 40.2% · R 57.6% · Other 2.2%
- 2008→2024 swing
- -17.0pp toward R · 2008: -0.4pp · 2024: -17.4pp
- All cycles
- 2024: R+17.4 2020: R+14.7 2016: R+20.6 2012: R+11.9 2008: R+0.4
Not yet ingested
- Civics
- —
Market trends
- HPI YoY
- ▼ -36.96%
- Current HPI
- 185.502
- Rent YoY
- —
- Metro
- —
- State GDP YoY
- —
- F500 in state
- 0
Price history
-53.4% since first listed4 events — show timeline
- 2026-01-05 Pending — KVBOR
- 2025-10-31 Price Changed $27,000 KVBOR
- 2025-09-25 Listed $127,000 KVBOR
- 2015-11-10 Listed $58,000 KVBOR
Property tax history
-6.0%/yrLatest (2025): $169 · +0.0% YoY. Source: county tax records.
Cash-flow waterfall
monthlySold comps — $/sqft
last 12 mo · ≤1 miLoading sold comps…